

POTENTIALLY UNDERVALUED SMALLCAP STOCK: 🔥
🚀 Sales & profits at all time high
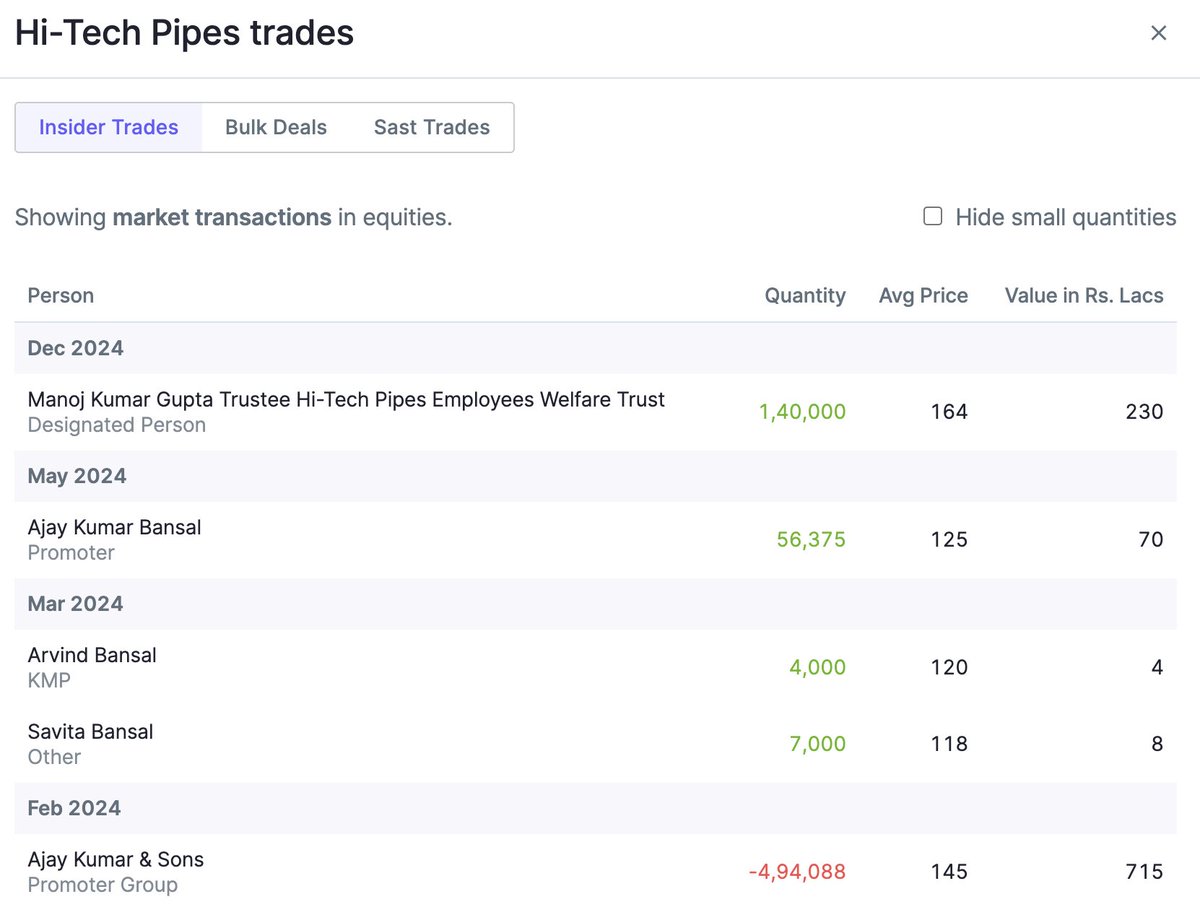
🤑 Insider Buys 1,40,000 Shares
🚀 [ Mega Thread ] 🧵
Techno-Funda Analysis 👇
🚀 Sales & profits at all time high
🤑 Insider Buys 1,40,000 Shares
🚀 [ Mega Thread ] 🧵
Techno-Funda Analysis 👇

(1) About company:
Hi-Tech Pipes Limited (HTPL) is one of India’s biggest steel pipe and tube manufacturers, producing structural tubes, CR sheets, galvanized coils, solar structures, and metal crash barriers. x.com
Hi-Tech Pipes Limited (HTPL) is one of India’s biggest steel pipe and tube manufacturers, producing structural tubes, CR sheets, galvanized coils, solar structures, and metal crash barriers. x.com
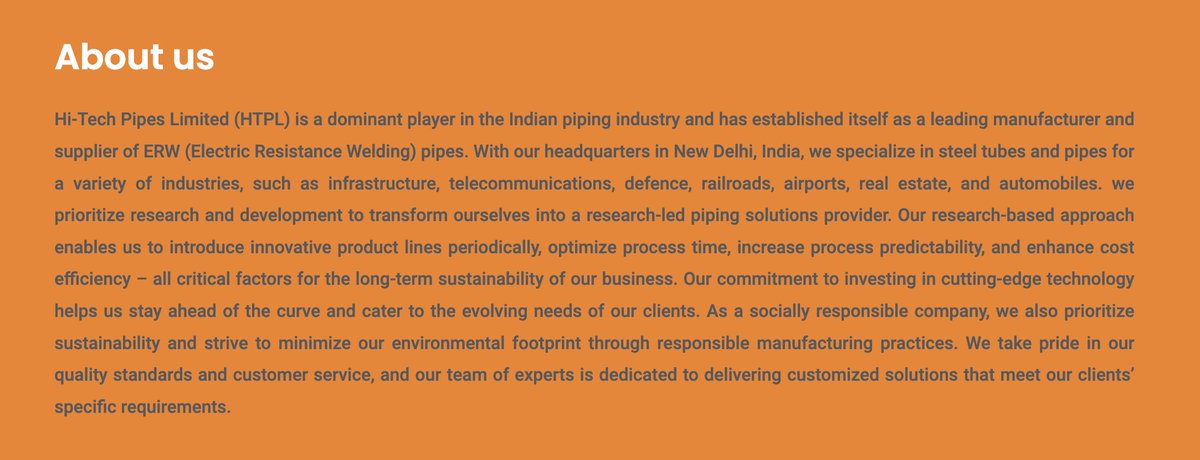
(2) Hi-Tech Pipes serves a broad range of industries:
- Infrastructure
- Real Estate
- Automobile
- Agriculture
- Oil & Gas
- Defense
- Industrial Sectors
- Telecommunications
- Housing
- Infrastructure
- Real Estate
- Automobile
- Agriculture
- Oil & Gas
- Defense
- Industrial Sectors
- Telecommunications
- Housing
(3) H1 FY25 consolidated performance:
Revenue: +13.31%
EBITDA: +77%
PAT: +95.46%
Sales Volume (MT): +32.59%
EBITDA per MT: +33.51% x.com
Revenue: +13.31%
EBITDA: +77%
PAT: +95.46%
Sales Volume (MT): +32.59%
EBITDA per MT: +33.51% x.com


(6) Management outlook for the company:
- Hi-Tech believes it can reach its FY25 target of 500,000 tons, having managed challenges in the first half and expecting a better second half of the year.
- Company plans to double its manufacturing capacity from 1 million to 2 million tons to meet rising demand in infrastructure, construction, and renewable energy.
- India's steel pipes and tubes market is 9-10 million tons and is expected to grow by 15% yearly.
- Company has received its largest order in the solar energy sector and expects growth to continue. Solar projects currently bring 10% of their revenue, and they plan to increase this.
(8) Financial Metrics:
■ CMP: 162
■ Mcap: 3,298 crores
■ TTM PE: 67
■ Forward PE: 46
■ ROCE: 11%
■ ROE: 8%
■ D/E Ratio: 0.38
■ Current ratio: 1.63
■ OPM: 5%
■ Promoter holdings: 44%
■ 3 years sales, profit growth: 29% and 31%
■ CMP: 162
■ Mcap: 3,298 crores
■ TTM PE: 67
■ Forward PE: 46
■ ROCE: 11%
■ ROE: 8%
■ D/E Ratio: 0.38
■ Current ratio: 1.63
■ OPM: 5%
■ Promoter holdings: 44%
■ 3 years sales, profit growth: 29% and 31%
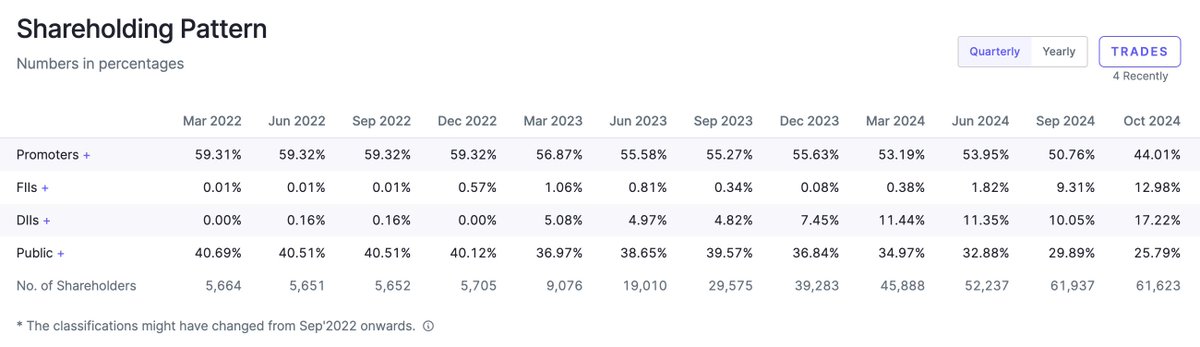
(9) Shareholding pattern:
- FII has been growing its stake over the past 4 quarters.
- DIIs raised their stake by 7.17% in the previous quarter. x.com
- FII has been growing its stake over the past 4 quarters.
- DIIs raised their stake by 7.17% in the previous quarter. x.com
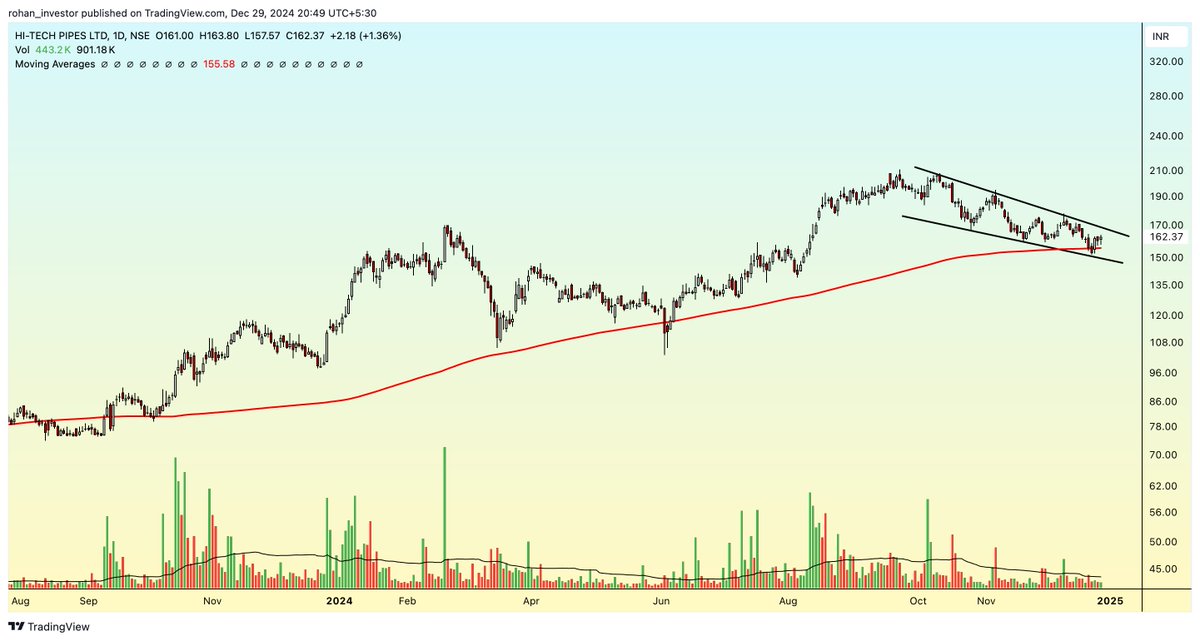
(10) Chart overview:
Price chart is creating a wedge pattern at the 200 SMA, and a breakout above the upper line could spark an uptrend rally. x.com
Price chart is creating a wedge pattern at the 200 SMA, and a breakout above the upper line could spark an uptrend rally. x.com
That's it for today!
If you found this useful:
(1) Follow @rohaninvestor for more such threads.
(2) Bookmark this thread.
x.com
If you found this useful:
(1) Follow @rohaninvestor for more such threads.
(2) Bookmark this thread.
x.com
Loading suggestions...