

Financial Ratios in Fundamental Analysis (A Mega Thread) full of learnings ...
Like & Share With all to spread learnings... x.com
Like & Share With all to spread learnings... x.com

1⃣
Understanding #financialratios is key to analysing a company’s financial health & comparing it with its peers.
Here’s a quick breakdown of the most important ratios every Indian investor must know! 👇👇👇
#fundamentalanalysis #investing
Understanding #financialratios is key to analysing a company’s financial health & comparing it with its peers.
Here’s a quick breakdown of the most important ratios every Indian investor must know! 👇👇👇
#fundamentalanalysis #investing
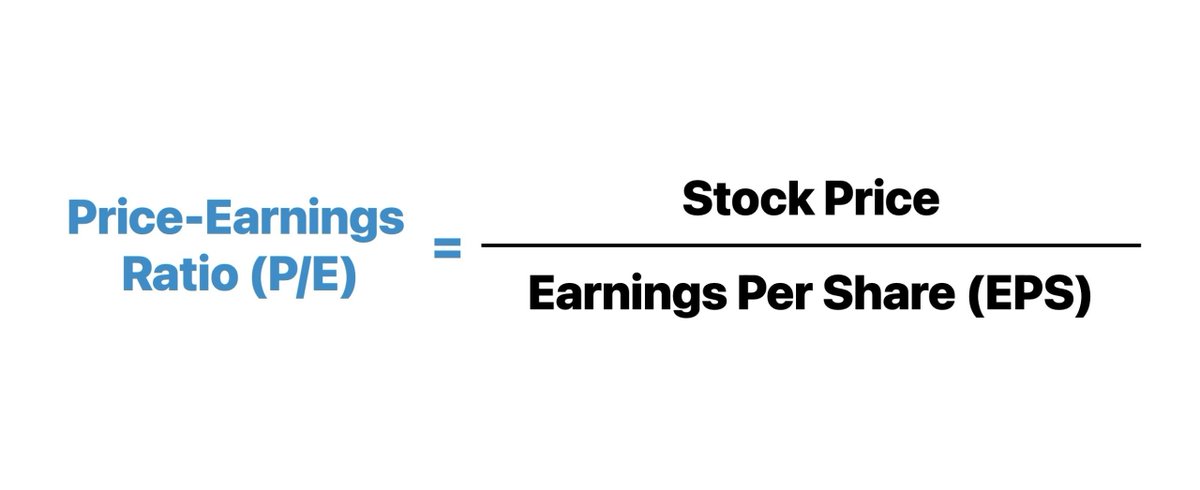
2⃣ - Price-to-Earnings (P/E) Ratio
Formula: Stock Price ÷ Earnings Per Share (EPS)
Shows how much you’re paying for ₹1 of earnings.
High P/E: Could indicate overvaluation or strong growth prospects.
Compare within the same industry.
#fundamentalanalysis x.com
Formula: Stock Price ÷ Earnings Per Share (EPS)
Shows how much you’re paying for ₹1 of earnings.
High P/E: Could indicate overvaluation or strong growth prospects.
Compare within the same industry.
#fundamentalanalysis x.com
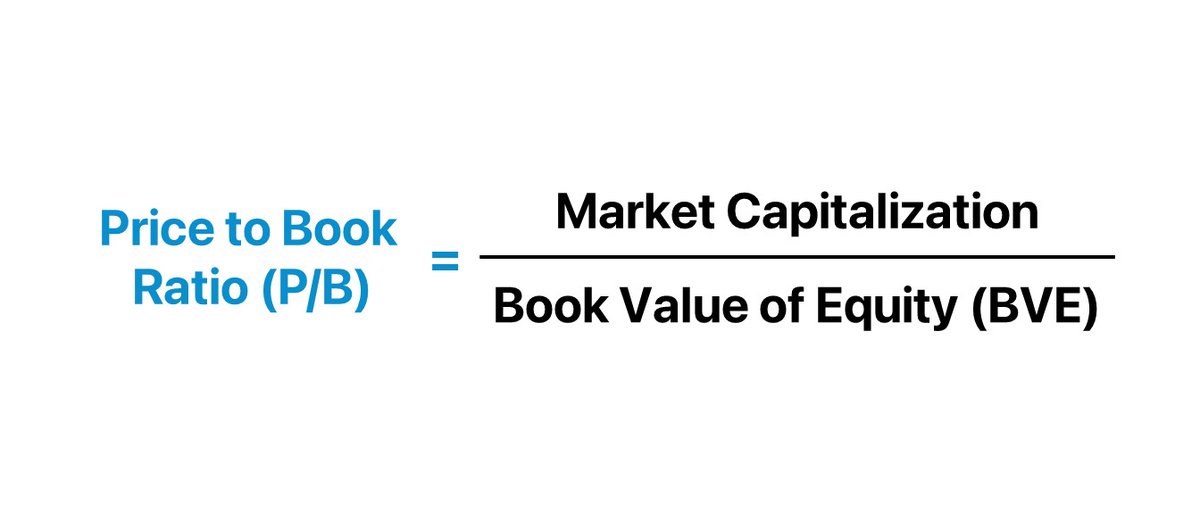
3⃣ - Price-to-Book (P/B) Ratio
Formula: Market Price ÷ Book Value Per Share
Useful for financial & asset-heavy sectors like banks, NBFCs & real estate.
Low P/B (<1) may signal undervaluation, but could also indicate poor fundamentals.
#fundamentalanalysis #investing #shares x.com
Formula: Market Price ÷ Book Value Per Share
Useful for financial & asset-heavy sectors like banks, NBFCs & real estate.
Low P/B (<1) may signal undervaluation, but could also indicate poor fundamentals.
#fundamentalanalysis #investing #shares x.com
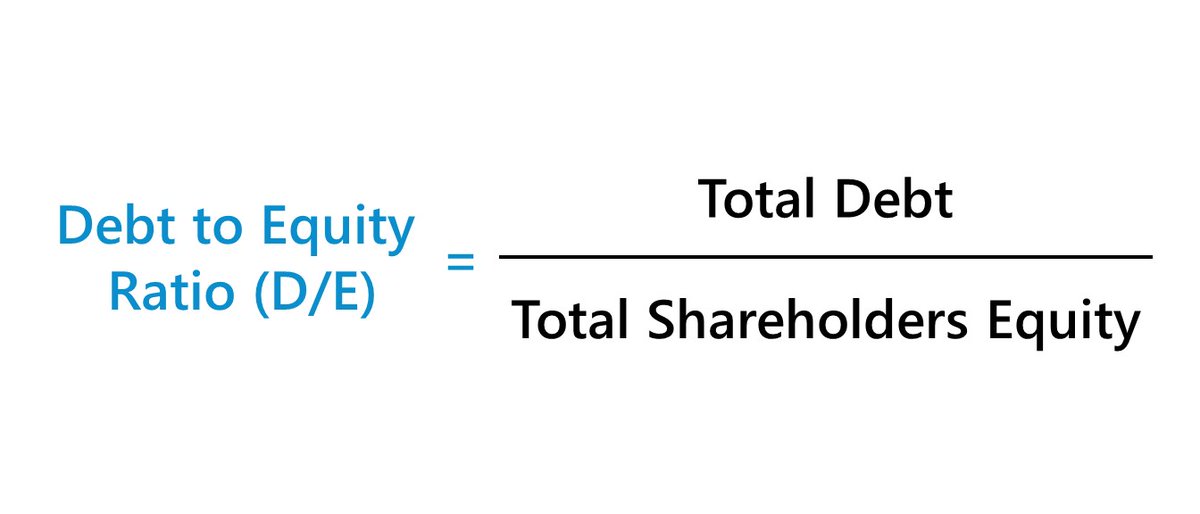
4⃣ - Debt-to-Equity (D/E) Ratio
Formula: Total Debt ÷ Shareholders’ Equity
Indicates a company’s leverage.
D/E <1 is considered safe for most industries.
Capital-intensive sectors (e.g., power, infra) may have higher D/E, but monitor cash flows!
@nid_rockz @caniravkaria x.com
Formula: Total Debt ÷ Shareholders’ Equity
Indicates a company’s leverage.
D/E <1 is considered safe for most industries.
Capital-intensive sectors (e.g., power, infra) may have higher D/E, but monitor cash flows!
@nid_rockz @caniravkaria x.com
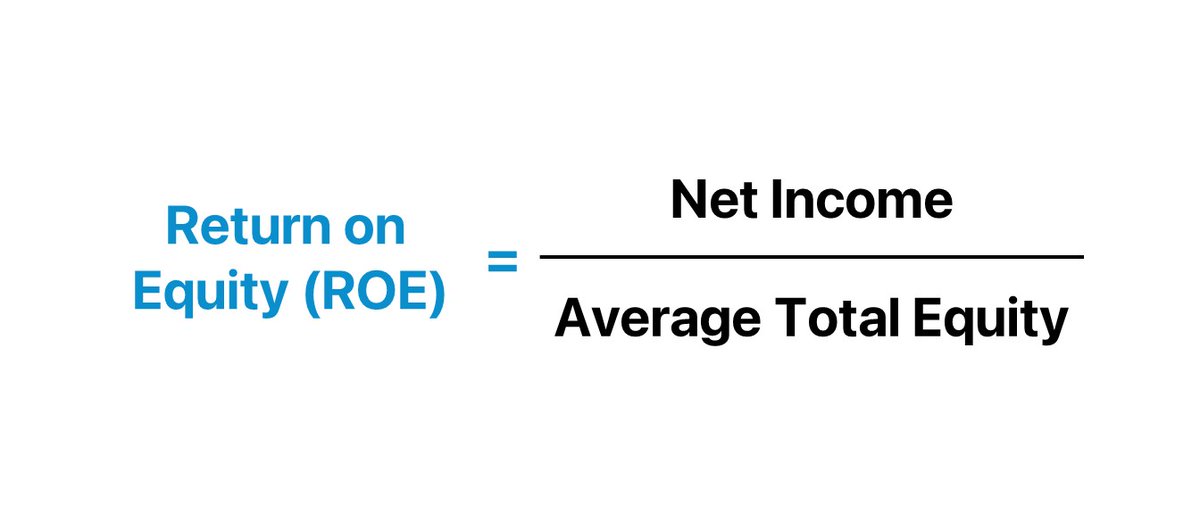
5⃣ - Return on Equity (ROE)
Formula: Net Income ÷ Shareholders’ Equity
Measures how efficiently a company uses shareholders' funds to generate profits.
High ROE (>20% is ideal) is a good sign, but beware of companies with high debt boosting ROE artificially. x.com
Formula: Net Income ÷ Shareholders’ Equity
Measures how efficiently a company uses shareholders' funds to generate profits.
High ROE (>20% is ideal) is a good sign, but beware of companies with high debt boosting ROE artificially. x.com
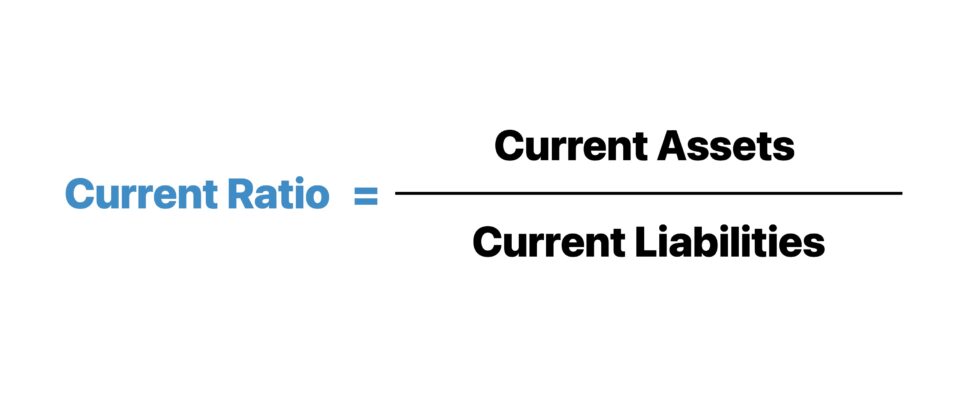
6⃣ - Current Ratio
Formula: Current Assets ÷ Current Liabilities
Reflects short-term liquidity.
Ideal range: 1.5 to 2. A ratio <1 indicates possible liquidity stress.
Useful when analysing small & mid-cap companies with tight working capital cycles. x.com
Formula: Current Assets ÷ Current Liabilities
Reflects short-term liquidity.
Ideal range: 1.5 to 2. A ratio <1 indicates possible liquidity stress.
Useful when analysing small & mid-cap companies with tight working capital cycles. x.com
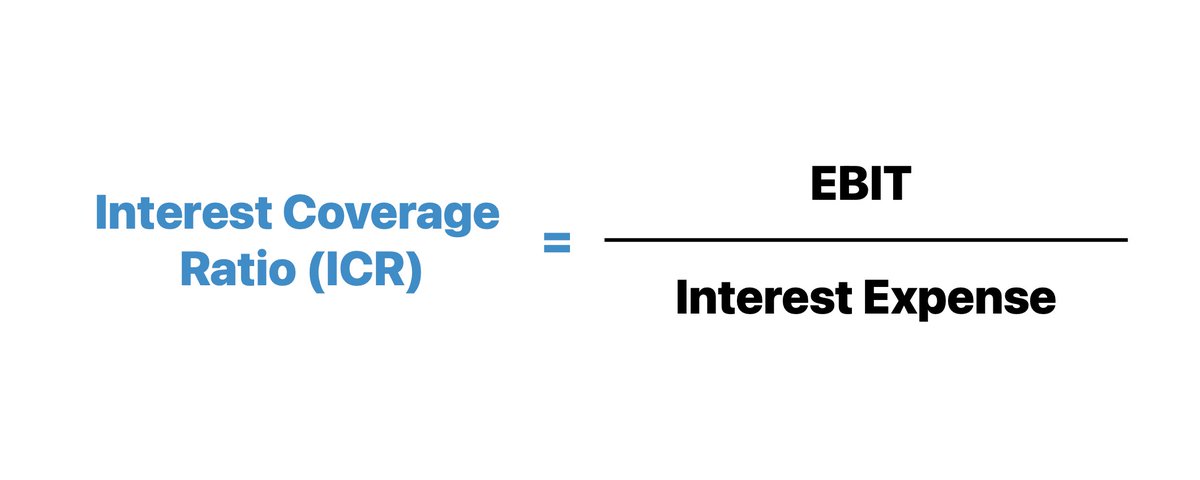
7⃣ - Interest Coverage Ratio
Formula: EBIT ÷ Interest Expense
Measures a company’s ability to pay interest on its debt.
Higher = Safer. A ratio <2 can indicate financial stress.
E.g., Critical for analysing Indian companies in sectors like steel, infra, or airlines. x.com
Formula: EBIT ÷ Interest Expense
Measures a company’s ability to pay interest on its debt.
Higher = Safer. A ratio <2 can indicate financial stress.
E.g., Critical for analysing Indian companies in sectors like steel, infra, or airlines. x.com
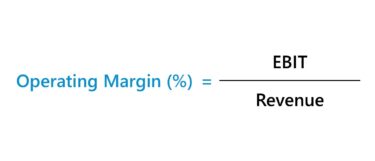
8⃣ - Operating Profit Margin (OPM)
Formula: Operating Profit ÷ Revenue
High OPM = Operational efficiency & pricing power.
Compare OPM across time to track margin trends.
E.g., FMCG companies like Nestlé India often have stable & high OPM due to brand strength. x.com
Formula: Operating Profit ÷ Revenue
High OPM = Operational efficiency & pricing power.
Compare OPM across time to track margin trends.
E.g., FMCG companies like Nestlé India often have stable & high OPM due to brand strength. x.com
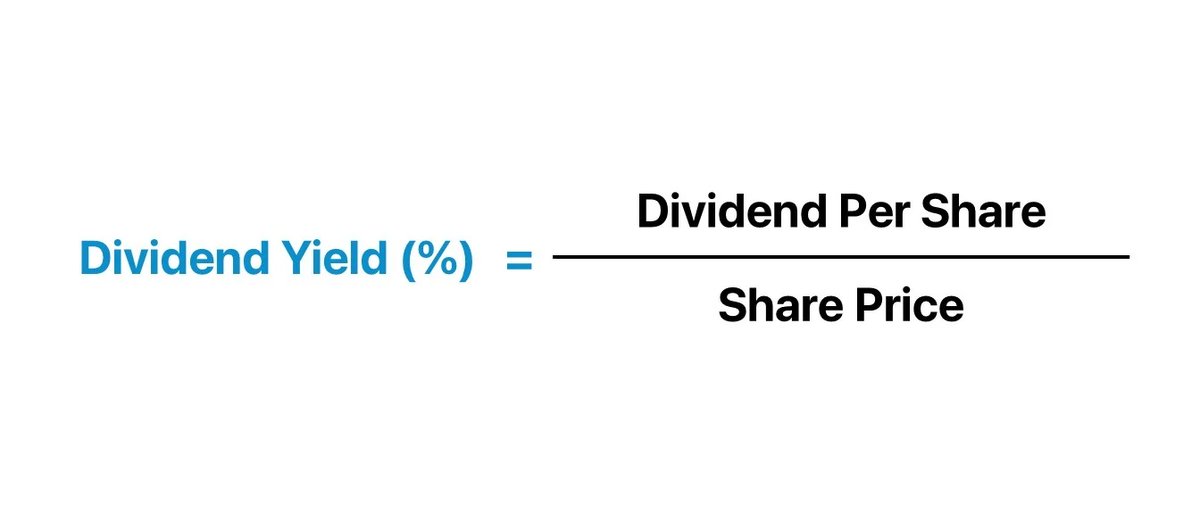
9⃣ - Dividend Yield
Formula: Annual Dividend ÷ Market Price
A higher dividend yield (>3%) is attractive for income-focused investors.
#StockMarket #StockMarketIndia #Shares x.com
Formula: Annual Dividend ÷ Market Price
A higher dividend yield (>3%) is attractive for income-focused investors.
#StockMarket #StockMarketIndia #Shares x.com
🔟 - Earnings Per Share (EPS)
Formula: Net Profit ÷ Total Shares Outstanding
Shows profitability per share. A consistently rising EPS indicates strong fundamentals.
E.g., Compare EPS growth trends of companies. x.com
Formula: Net Profit ÷ Total Shares Outstanding
Shows profitability per share. A consistently rising EPS indicates strong fundamentals.
E.g., Compare EPS growth trends of companies. x.com

1⃣1⃣ - Pro Tip
Financial Ratios are indicators, not absolute truths.
Always compare them with industry peers & averages.
Dig deeper into the reasons behind good or bad numbers to uncover the full story! 📚
Learn basics of Fundamental Analysis Before Investing in any Stock.
Financial Ratios are indicators, not absolute truths.
Always compare them with industry peers & averages.
Dig deeper into the reasons behind good or bad numbers to uncover the full story! 📚
Learn basics of Fundamental Analysis Before Investing in any Stock.
Beginners can read this book to learn basics of Fundamental Analysis of Shares -
amzn.to
Book is also available in Hindi, Gujarati and Marathi languages on Amazon and Flipkart.
amzn.to
Book is also available in Hindi, Gujarati and Marathi languages on Amazon and Flipkart.

Loading suggestions...