

Don't waste your hard earned money💸 on Technical analysis course.
I will teach you how to find Good Stocks using Technical analysis:
Please bookmark this thread 🧵👇
I will teach you how to find Good Stocks using Technical analysis:
Please bookmark this thread 🧵👇
𝐌𝐀𝐑𝐊𝐄𝐓 𝐒𝐓𝐑𝐔𝐂𝐓𝐔𝐑𝐄 :- What to do in different market conditions, whether to buy, sell, or stay out of the markets.
Market structure help us how the market really moves (with the help of the concepts from the four stages).
Market structure help us how the market really moves (with the help of the concepts from the four stages).
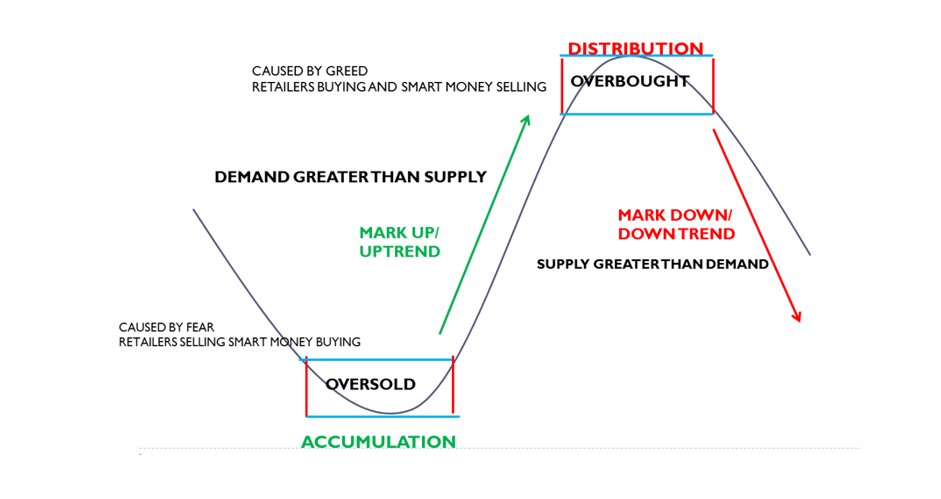
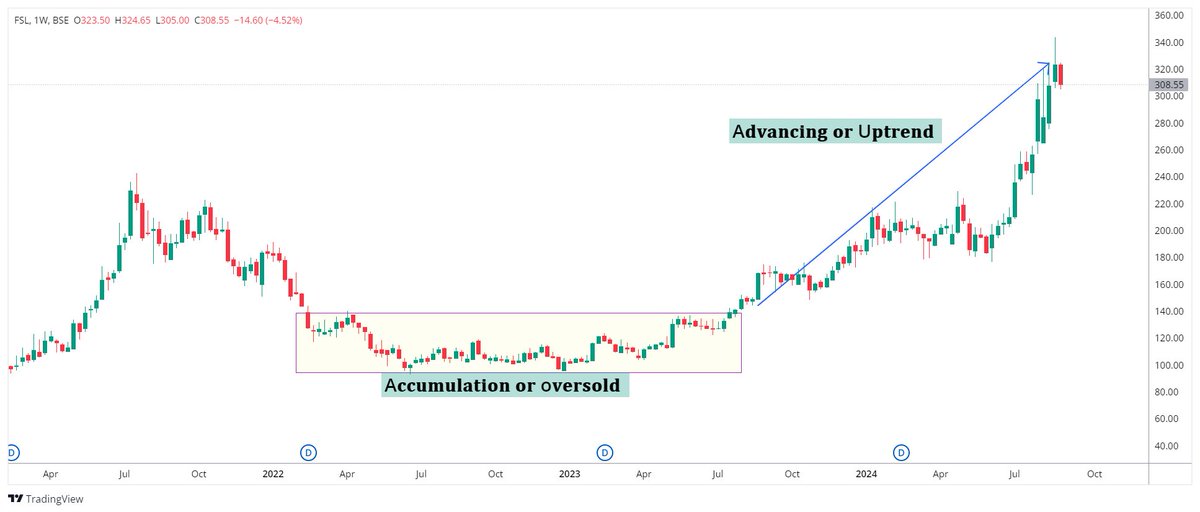
👉An 𝐚𝐜𝐜𝐮𝐦𝐮𝐥𝐚𝐭𝐢𝐨𝐧 𝐨𝐫 𝐨𝐯𝐞𝐫𝐬𝐨𝐥𝐝 stage occurs after a decline in price, and it looks like a range market within a downtrend.
👉The 𝐚𝐝𝐯𝐚𝐧𝐜𝐢𝐧𝐠 𝐨𝐫 𝐮𝐩𝐭𝐫𝐞𝐧𝐝 stage occurs when the price breaks out of resistance or from the accumulation stage.
👉The 𝐚𝐝𝐯𝐚𝐧𝐜𝐢𝐧𝐠 𝐨𝐫 𝐮𝐩𝐭𝐫𝐞𝐧𝐝 stage occurs when the price breaks out of resistance or from the accumulation stage.
👉A 𝐝𝐢𝐬𝐭𝐫𝐢𝐛𝐮𝐭𝐢𝐨𝐧 𝐨𝐫 𝐨𝐯𝐞𝐫𝐛𝐨𝐮𝐠𝐡𝐭 stage occurs after an uptrend in price, and it looks like a range market within an uptrend.
👉 The 𝐝𝐞𝐜𝐥𝐢𝐧𝐢𝐧𝐠 𝐨𝐫 𝐝𝐨𝐰𝐧𝐭𝐫𝐞𝐧𝐝 occurs when the price breaks down of support or from the distribution stage.
👉 The 𝐝𝐞𝐜𝐥𝐢𝐧𝐢𝐧𝐠 𝐨𝐫 𝐝𝐨𝐰𝐧𝐭𝐫𝐞𝐧𝐝 occurs when the price breaks down of support or from the distribution stage.

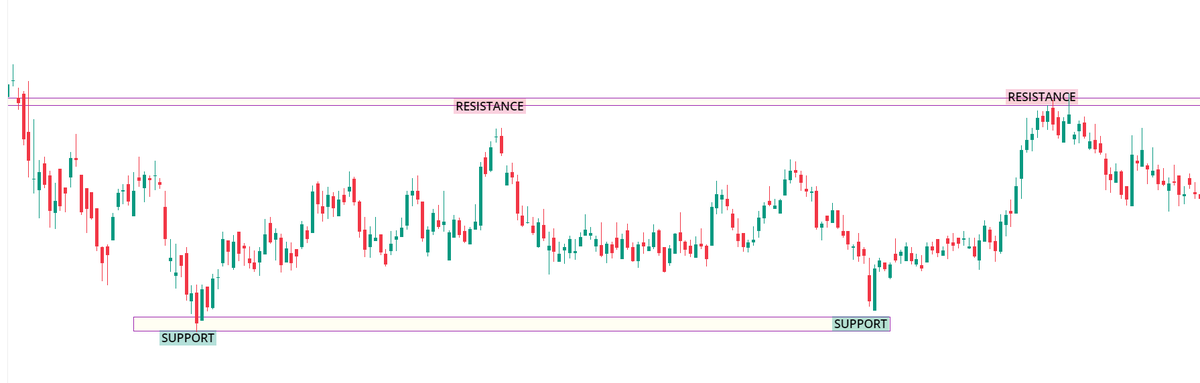
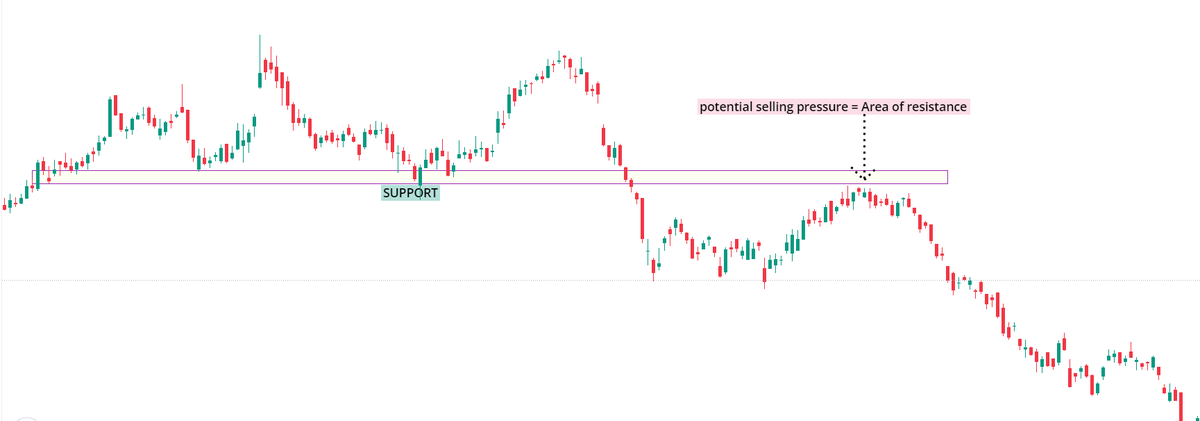
𝐒𝐔𝐏𝐏𝐎𝐑𝐓 & 𝐑𝐄𝐒𝐈𝐒𝐓𝐀𝐍𝐂𝐄 :- Support and resistance as areas of value on our charts to help us buy low and sell high.
support and resistance, how they work, and how to tell when they’ll break. In essence, support and resistance tell us where to buy and sell.
support and resistance, how they work, and how to tell when they’ll break. In essence, support and resistance tell us where to buy and sell.
👉𝐒𝐔𝐏𝐏𝐎𝐑𝐓 :- It's a horizontal area on your chart where potential buying pressure could come in and push the price higher.
👉𝐑𝐄𝐒𝐈𝐒𝐓𝐀𝐍𝐂𝐄 :-It's a horizontal area on your charts where selling pressure could come in and push the price lower.
👉𝐑𝐄𝐒𝐈𝐒𝐓𝐀𝐍𝐂𝐄 :-It's a horizontal area on your charts where selling pressure could come in and push the price lower.
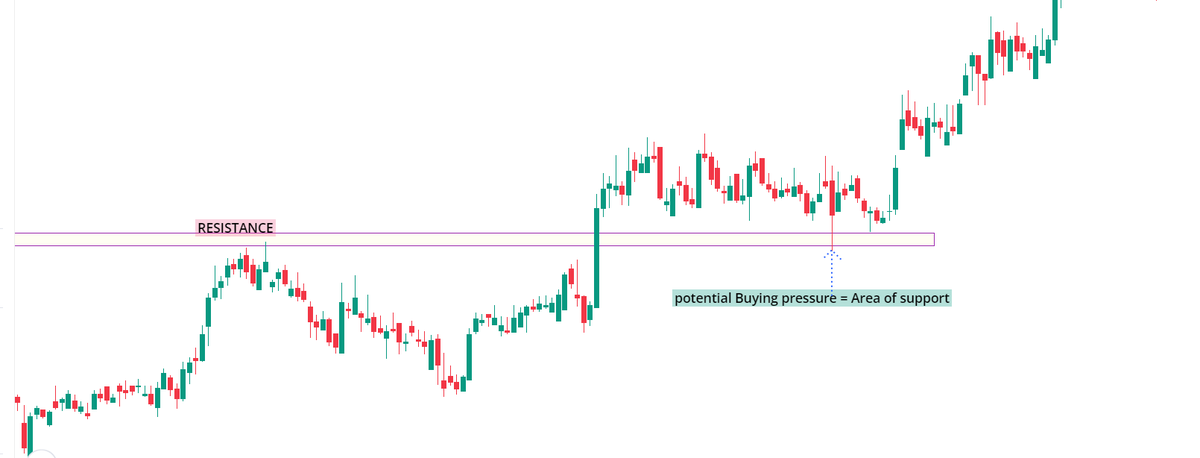
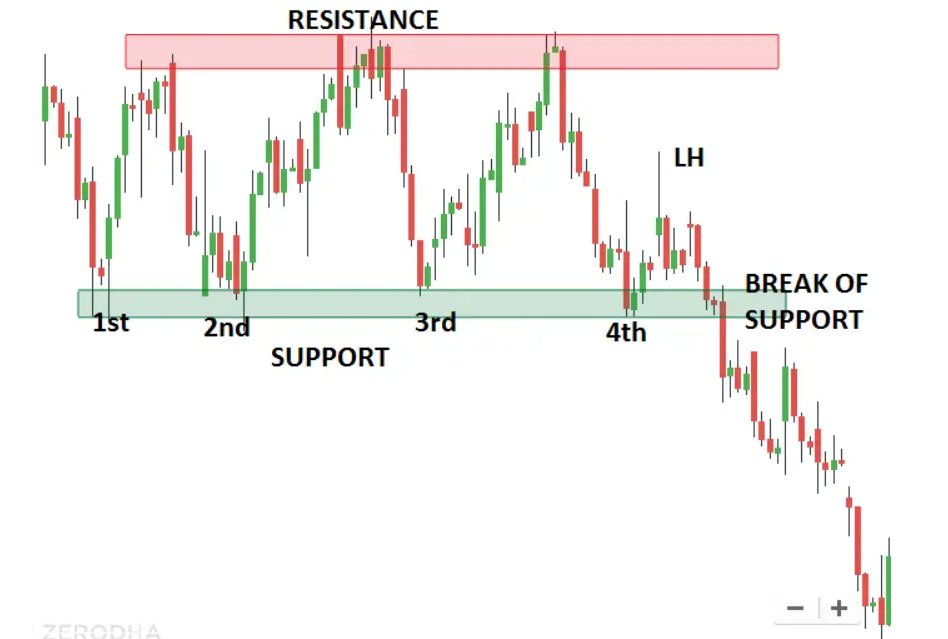
👉The more times support or resistance is tested within a short period of time, the greater the likelihood it will break.
👉Support tends to break in a downtrend or when there are lower highs into support.
👉Resistance tends to break in an uptrend
👉Support tends to break in a downtrend or when there are lower highs into support.
👉Resistance tends to break in an uptrend
SUPPORT AND RESISTANCE ARE DEVELOPED :-
👉In any time frame is the prior bar’s
🔹high=resistance
🔹low=support
👉swing high and swing low
👉Consolidation area
👉Rejection from an area
👉Gap (invisible tail), EMOTIONAL POINT
👉Fibo retracement level
👉Trend line and MA
👉In any time frame is the prior bar’s
🔹high=resistance
🔹low=support
👉swing high and swing low
👉Consolidation area
👉Rejection from an area
👉Gap (invisible tail), EMOTIONAL POINT
👉Fibo retracement level
👉Trend line and MA
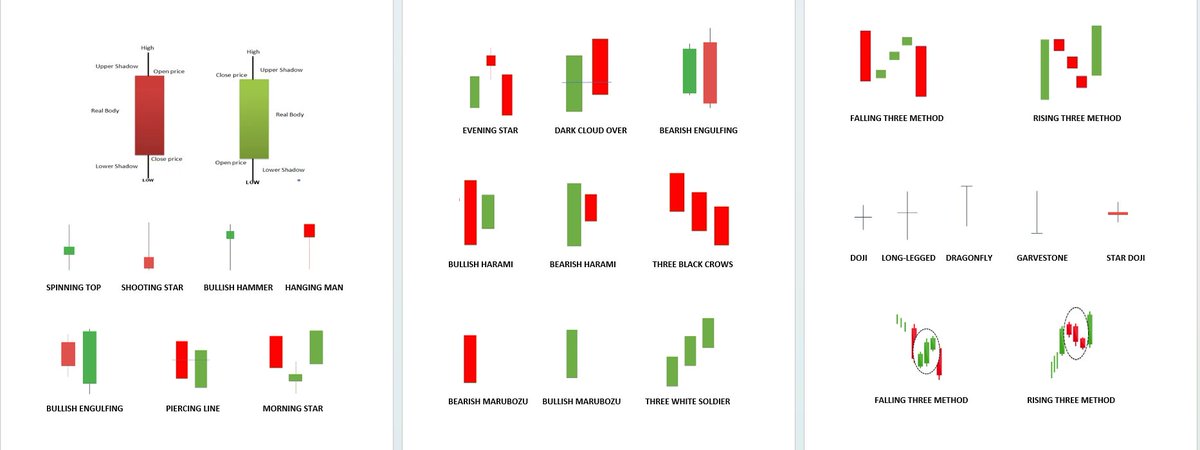
𝐂𝐀𝐍𝐃𝐋𝐄𝐒𝐓𝐈𝐂𝐊𝐒 𝐏𝐀𝐓𝐓𝐄𝐑𝐍 :-
🔹Candlestick patterns are useful as entry triggers to help you time your entry.
🔹Candlestick patterns tell us when to enter in sell or buy.
🔹Candlestick patterns give us an idea of who’s currently in control of the markets.
🔹Candlestick patterns are useful as entry triggers to help you time your entry.
🔹Candlestick patterns tell us when to enter in sell or buy.
🔹Candlestick patterns give us an idea of who’s currently in control of the markets.
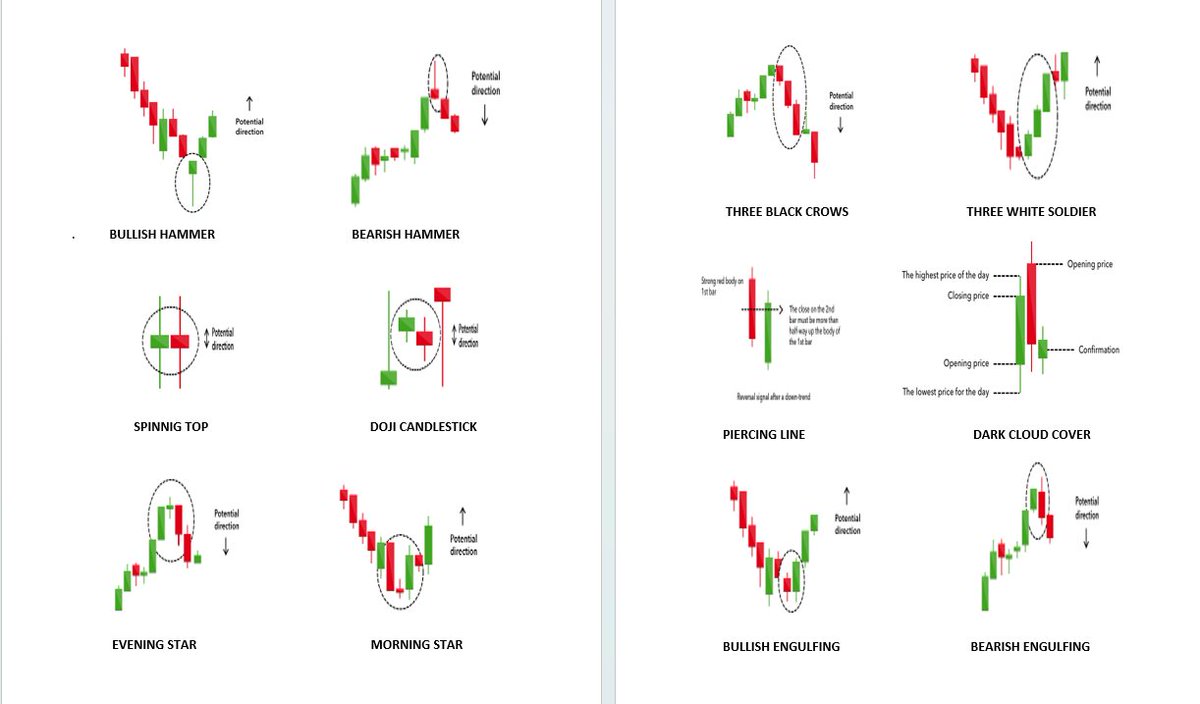
🔹There are three types of candlestick patterns: reversal, indecision, and continuation.
🔹There are many types of candlestick patterns, which can be classified as single, double or triple candle stick patterns.
🔹Please see some common candlestick patterns attached in the image.
🔹There are many types of candlestick patterns, which can be classified as single, double or triple candle stick patterns.
🔹Please see some common candlestick patterns attached in the image.
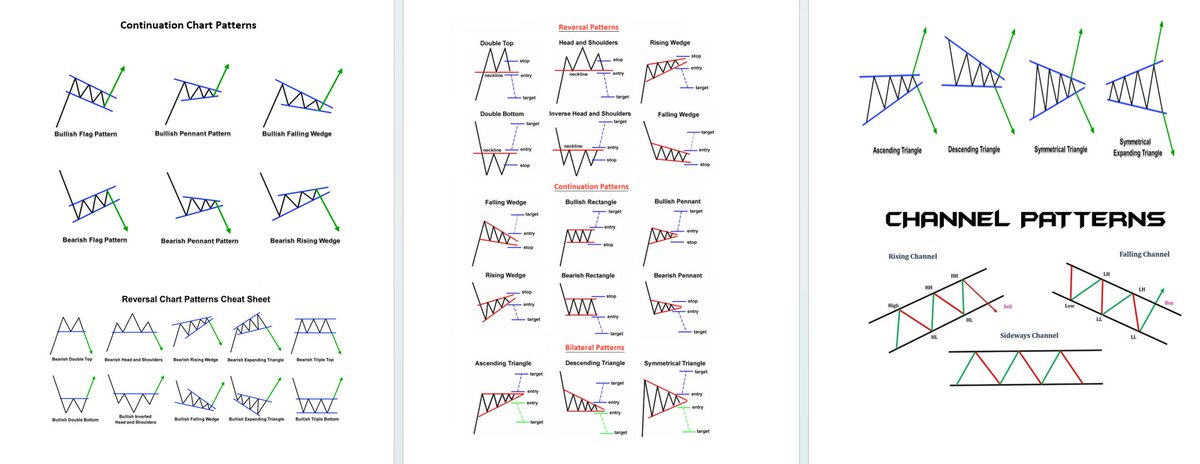
𝐂𝐇𝐀𝐑𝐓 𝐏𝐀𝐓𝐓𝐄𝐑𝐍: -
A chart pattern is a set price action that is repeated again and again. The idea behind chart pattern analysis is that by knowing what happened after a pattern in the past, you can take an educated guess as to what might happen when it appears again.
A chart pattern is a set price action that is repeated again and again. The idea behind chart pattern analysis is that by knowing what happened after a pattern in the past, you can take an educated guess as to what might happen when it appears again.
There are three types of chart patterns:
🔸Reversal chart pattern.
🔸Continuation chart pattern.
🔸Bilateral chart pattern.
🔸Reversal chart pattern.
🔸Continuation chart pattern.
🔸Bilateral chart pattern.
𝐑𝐢𝐬𝐤 𝐌𝐚𝐧𝐚𝐠𝐞𝐦𝐞𝐧𝐭 :-
🔸You can have the best trading strategy in the world, but without proper risk management, you will eventually blow up your trading account.
🔸If you want to ride a trend, you need to trail your stop loss as the price moves in your favor.
🔸You can have the best trading strategy in the world, but without proper risk management, you will eventually blow up your trading account.
🔸If you want to ride a trend, you need to trail your stop loss as the price moves in your favor.
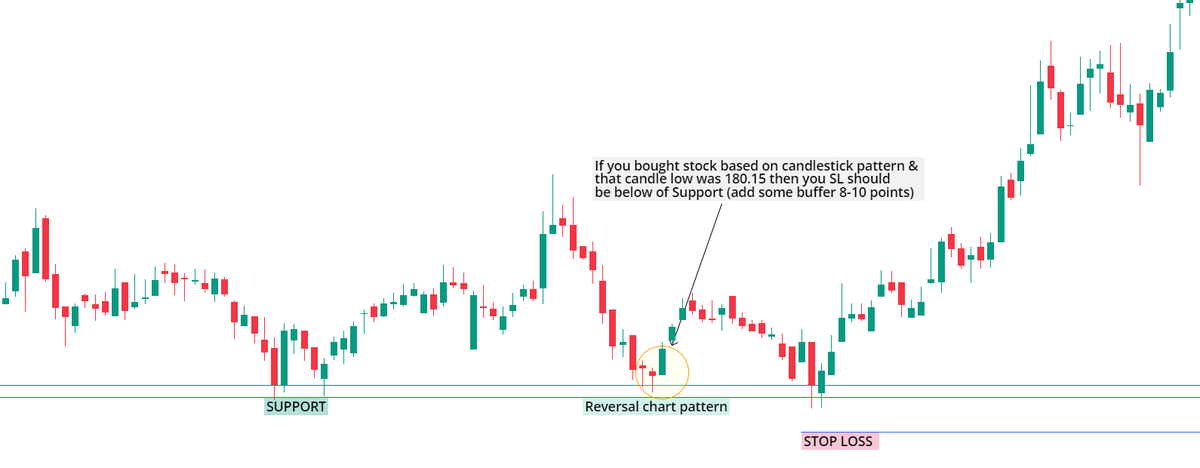
HOW TO SET A PROPER STOP LOSS :-
🔸When you set your stop loss, you want to have a “barrier” working in your favor to prevent the price from moving against you.
🔸When you set your stop loss, you want to have a “barrier” working in your favor to prevent the price from moving against you.
🔸First, identify the area of value like support and resistance, swing highs and lows, trendlines, MA etc.
🔸Then add a “buffer” to it so you don’t get stopped out just because the price spiked through the lows of support or high of the resistance.
🔸Then add a “buffer” to it so you don’t get stopped out just because the price spiked through the lows of support or high of the resistance.
𝐒𝐔𝐌𝐌𝐀𝐑𝐘 :-
🔹Market structure whether to buy, sell, or stay out of the markets.
🔹support and resistance tell you where to buy and sell.
🔹candlestick patterns tell you when to enter.
🔹Risk management how to keep stop loss.
🔹Market structure whether to buy, sell, or stay out of the markets.
🔹support and resistance tell you where to buy and sell.
🔹candlestick patterns tell you when to enter.
🔹Risk management how to keep stop loss.
That's a wrap! 🙏
If you found this useful:
✔️ Follow @jitendrakirar21 for more such threads.
✔️ Bookmark this thread for future.
✔️Like, Retweet & share with your friends.
#learning #trading
If you found this useful:
✔️ Follow @jitendrakirar21 for more such threads.
✔️ Bookmark this thread for future.
✔️Like, Retweet & share with your friends.
#learning #trading
Loading suggestions...