

𝗔 𝘁𝗲𝗰𝗵𝗻𝗶𝗰𝗮𝗹 𝗶𝗻𝗱𝗶𝗰𝗮𝘁𝗼𝗿 is a mathematical pattern derived from historical data that technical traders or investors use to predict future price trends and make trading decisions.
𝗔 𝘁𝗵𝗿𝗲𝗮𝗱🧵. . .
#Like #Repost for Max Reach
@nakulvibhor
@kuttrapali26
𝗔 𝘁𝗵𝗿𝗲𝗮𝗱🧵. . .
#Like #Repost for Max Reach
@nakulvibhor
@kuttrapali26
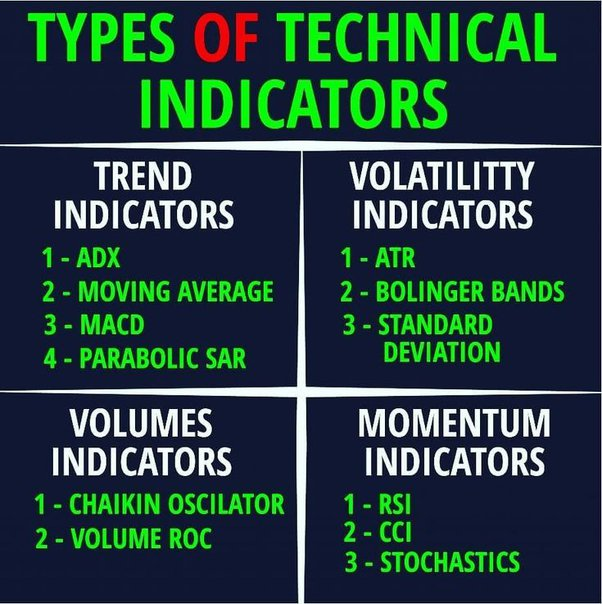
A technical indicator is usually shown graphically and compared with the corresponding price chart for analysis
@KommawarSwapnil
@nishkumar1977
@KommawarSwapnil
@nishkumar1977
A technical indicator captures the behavior and sometimes the investors’ psychology to provide a clue of future trends of price activity.
@BakuSarman
@cakunalshah1983
@ent_wala
@BakuSarman
@cakunalshah1983
@ent_wala
In order to become a successful investor, you need to be able to develop two distinct sets of skills: fundamental and technical analysis.
@GarvModi70
@mystock_myview
@GarvModi70
@mystock_myview
The best investors in the history of stock investment have relied on technical indicators to gain some insight into the demand and supply of securities and related market psychology.
@karthimaths
@me__kaushik
@WaveFinancial
@Niteish_14
@karthimaths
@me__kaushik
@WaveFinancial
@Niteish_14
Traders who use technical analysis in their regular trading routines, are chartists who use a broad variety of indicators, oscillators and patterns to generate signals.
@nirajtanna
@Addition_Singh
@STOCKBAGGER1
@WaveFinancial
@nirajtanna
@Addition_Singh
@STOCKBAGGER1
@WaveFinancial
New technical indicators are often back tested on historic price and volume data to see how effective they would have been to predict future events.
Follow 👇👇
@TechTradesTT for more info & #StockMarket updates
#TradingView
#TechnicalTrades
#StocksToTrade
#stockstowatch
#stockmarketindia
@TechTradesTT for more info & #StockMarket updates
#TradingView
#TechnicalTrades
#StocksToTrade
#stockstowatch
#stockmarketindia
Loading suggestions...