

Traders make around $18M every day
They use trading patterns to maximize profit
I spent 100 days to try 50 of them...
here's every profitable trading strategy I found 🧵👇
(number 5 made me $20k in a week)
They use trading patterns to maximize profit
I spent 100 days to try 50 of them...
here's every profitable trading strategy I found 🧵👇
(number 5 made me $20k in a week)
But before I start...
I've put a lot of effort and time into this research and share a lot of alpha totally FREE. If you don't mind, please like and retweet the first tweet and FOLLOW me - @DeFiTracer
This will help me provide you with even more ALPHA, thank you 🫶
I've put a lot of effort and time into this research and share a lot of alpha totally FREE. If you don't mind, please like and retweet the first tweet and FOLLOW me - @DeFiTracer
This will help me provide you with even more ALPHA, thank you 🫶
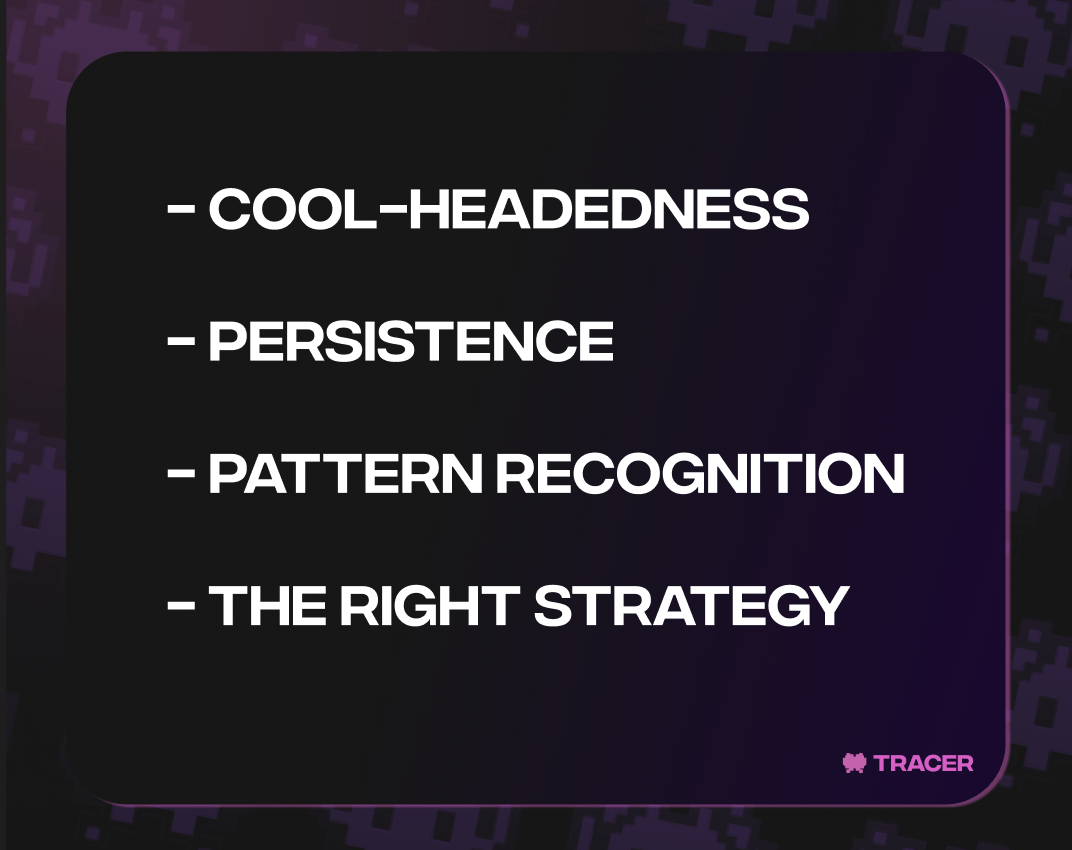
✜ Trading is a quite complex job that requires a range of soft and hard skills from a person:
- Cool-headedness
- Persistence
- Pattern recognition
- The RIGHT STRATEGY
✜ Without the right strategy, you won't be able to trade effectively.
- Cool-headedness
- Persistence
- Pattern recognition
- The RIGHT STRATEGY
✜ Without the right strategy, you won't be able to trade effectively.
✜ Choosing the right strategy is the key to your successful positions in trading.
✜ Most traders simply use ineffective strategies that lead to deposit losses.
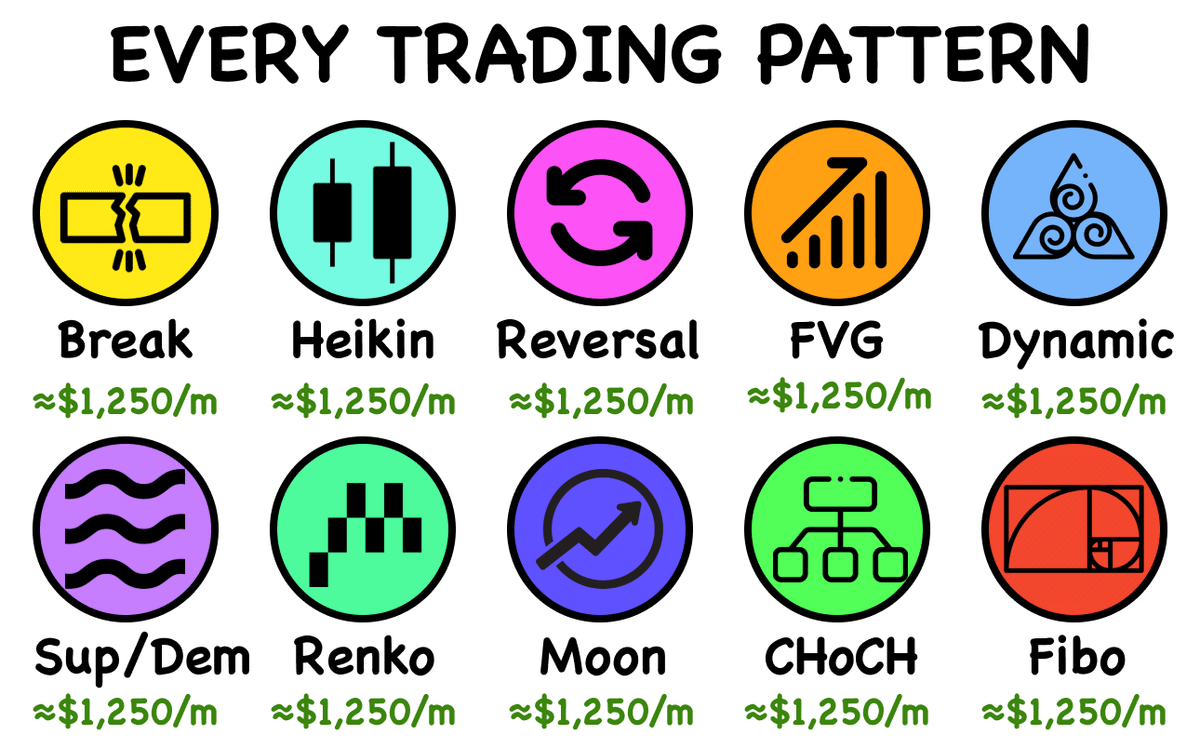
✜ I have highlighted 10 of the most effective ones that will help you achieve significant results.
✜ Most traders simply use ineffective strategies that lead to deposit losses.
✜ I have highlighted 10 of the most effective ones that will help you achieve significant results.
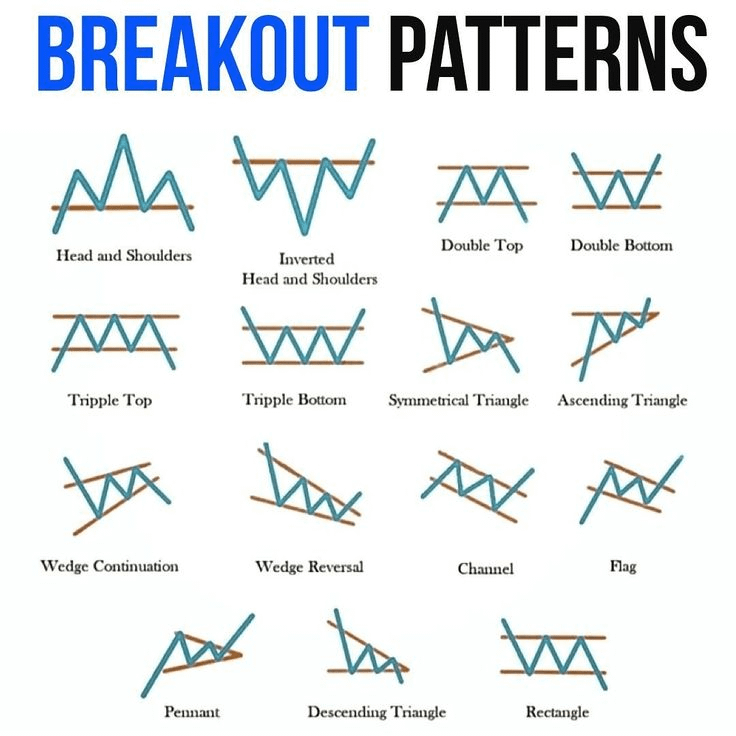
- Breakout:
✜ Breakout is a strategy that involves sudden and significant movement in one direction.
✜ Usually, all breakouts form during consolidation periods.
✜ By using a series of breakout patterns, you can enter positions wisely, but don’t forget about the manipulations of large players in these situations.
- Fibonacci Retracements:
✜ This is an effective tool that displays horizontal lines based on Fibonacci numbers, which act as support and resistance zones.
✜ To set up the tool, perform a series of actions:
- Identify the Minimum and Maximum of the fluctuation
- Stretch the Fibonacci from the minimum to the maximum
- Use the common 0.382 zone

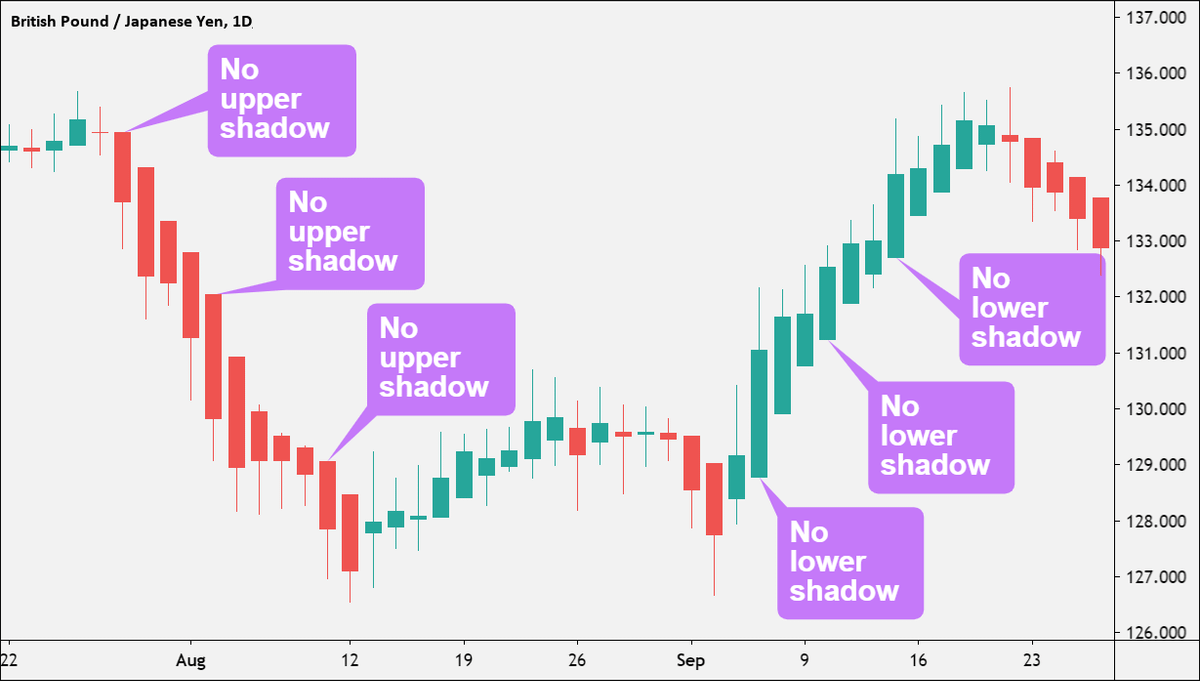
- Heikin Ashi:
✜ This is an indicator that completely replaces the traditional candlestick chart with the Heikin Ashi chart.
✜ It gives much less noise on the chart and shows the real pressure on the candles of your desired timeframe.
✜ This allows you to understand the real market sentiment and use this information when opening positions.
- Reversal Patterns:
✜ A pattern where the price moves in the opposite direction of the current trend.
✜ Thus, it forms a counter-trend.
✜ For this, a series of working patterns are used:
- Double Bottom
- Triple Top
- Head & Shoulders
✜ A pattern where the price moves in the opposite direction of the current trend.
✜ Thus, it forms a counter-trend.
✜ For this, a series of working patterns are used:
- Double Bottom
- Triple Top
- Head & Shoulders

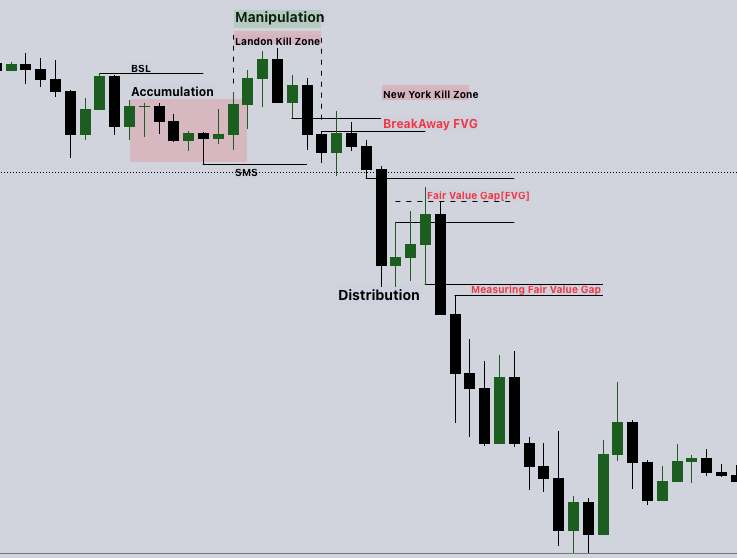
- Fair Value Gaps (FVG):
✜ A strategy that involves a significant imbalance of buying or selling.
✜ To find FVG, you need to:
- Find a candle with a large body
- Draw a rectangle at the gap between the previous candle and the next one
✜ This level now works as a potential magnet.
✜ A strategy that involves a significant imbalance of buying or selling.
✜ To find FVG, you need to:
- Find a candle with a large body
- Draw a rectangle at the gap between the previous candle and the next one
✜ This level now works as a potential magnet.
- Dynamic S&R:
✜ A complete but improved analogy of support and resistance lines.
✜ This strategy also works as key levels but is based on the moving average indicator.
✜ It is very effective in current realities and helps to normally find key levels.
✜ A complete but improved analogy of support and resistance lines.
✜ This strategy also works as key levels but is based on the moving average indicator.
✜ It is very effective in current realities and helps to normally find key levels.

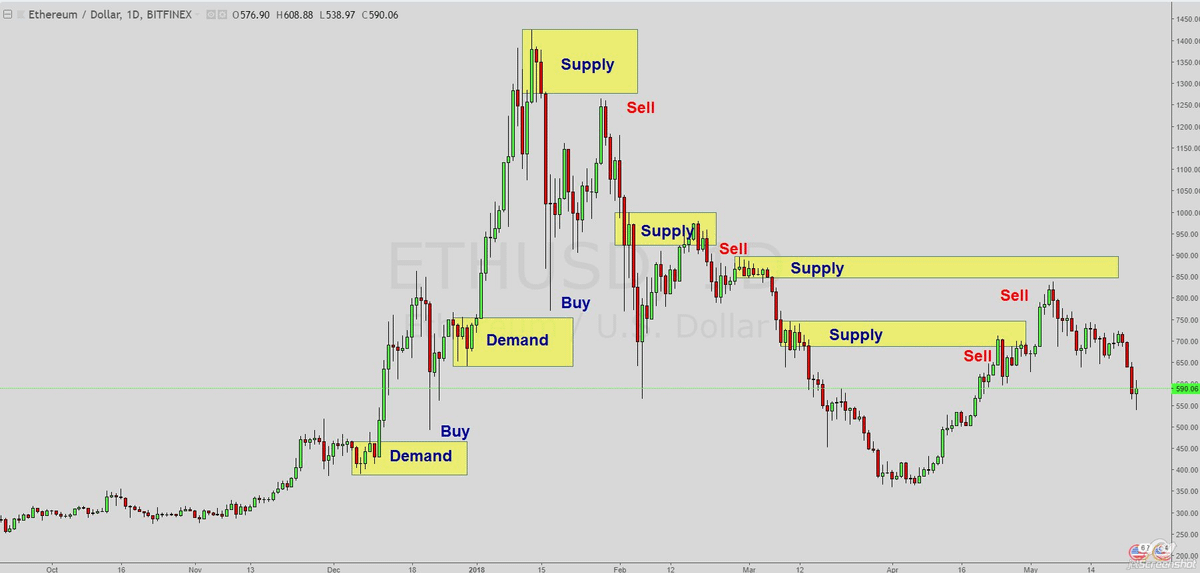
- Supply & Demand:
✜ Order blocks - zones where significant movements occurred:
- If the price rises significantly - Demand zone
- If the price falls significantly - Supply zone
✜ For traders, these zones can be used as key points for opening positions.
✜ Order blocks - zones where significant movements occurred:
- If the price rises significantly - Demand zone
- If the price falls significantly - Supply zone
✜ For traders, these zones can be used as key points for opening positions.
- Renko:
✜ Also, one of the indicators that replaces traditional candles with a Renko chart.
✜ The main difference from regular candles is that Renko forms its block based on price changes.
✜ On average, each block represents a 1% price change.
✜ Also, one of the indicators that replaces traditional candles with a Renko chart.
✜ The main difference from regular candles is that Renko forms its block based on price changes.
✜ On average, each block represents a 1% price change.

- Moon Phases:
✜ A strategy that uses lunar cycles to determine market timing.
✜ It is quite a true fact that lunar cycles correlate with human emotions:
- Full Moon - bearish tendency.
- New Moon - bullish tendency.
✜ A strategy that uses lunar cycles to determine market timing.
✜ It is quite a true fact that lunar cycles correlate with human emotions:
- Full Moon - bearish tendency.
- New Moon - bullish tendency.

- Change of Character (CHoCH):
✜ A strategy that occurs when the price breaks the previous structure during a trend.
✜ This mainly signals a reversal of the current trend.
✜ At such moments, traders should act more carefully with their positions.
✜ A strategy that occurs when the price breaks the previous structure during a trend.
✜ This mainly signals a reversal of the current trend.
✜ At such moments, traders should act more carefully with their positions.

In a few days, I'll start dropping my calls, scripts, and many more alpha in TG channel!
Make sure to subscribe, while it's still open for FREE!
Also I am running giveaway here rn, make sure to participate.
Link: t.me
Make sure to subscribe, while it's still open for FREE!
Also I am running giveaway here rn, make sure to participate.
Link: t.me


If you loved this thread, don't forget to:
• Follow me @DeFiTracer for more exciting content!
• Like, retweet, and leave a comment 👾
x.com
• Follow me @DeFiTracer for more exciting content!
• Like, retweet, and leave a comment 👾
x.com
Loading suggestions...