

The most efficient way to process nightlights data?
Using Google Earth Engine.
But using it with R can be tough.
So here's a detailed guide on how to do it:
#rstats
Using Google Earth Engine.
But using it with R can be tough.
So here's a detailed guide on how to do it:
#rstats

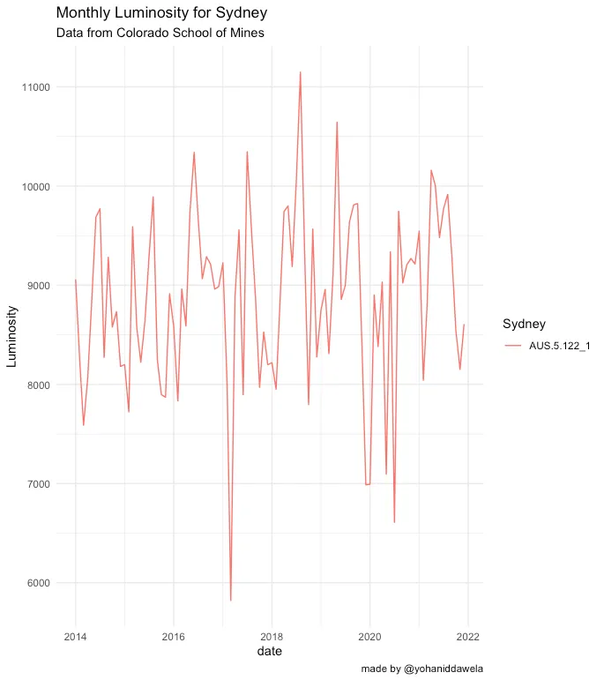
By the end of this post, you'll know the steps required to create the following graph of monthly luminosity data in R using Google Earth Engine.
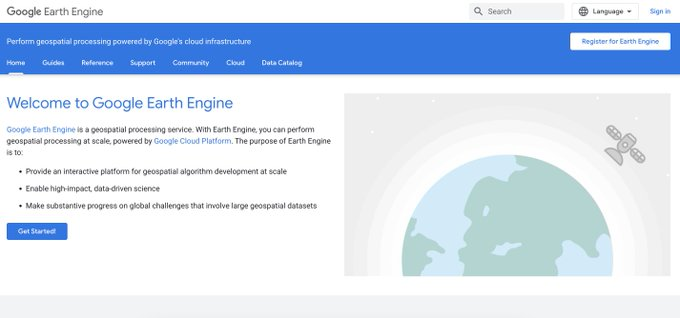
GEE is a fantastic resource—the computations are done on the cloud, so you won't be limited by your computer's hardware.
GEE is a fantastic resource—the computations are done on the cloud, so you won't be limited by your computer's hardware.

Step 1:
If you haven't already, you'll need to register for a GEE account.
It can take a couple of days for your account to get approved.
If you haven't already, you'll need to register for a GEE account.
It can take a couple of days for your account to get approved.
Step 2:
Install the RGEE package using the following instructions from Ricardo Dalagnol's video:
youtu.be
Install the RGEE package using the following instructions from Ricardo Dalagnol's video:
youtu.be
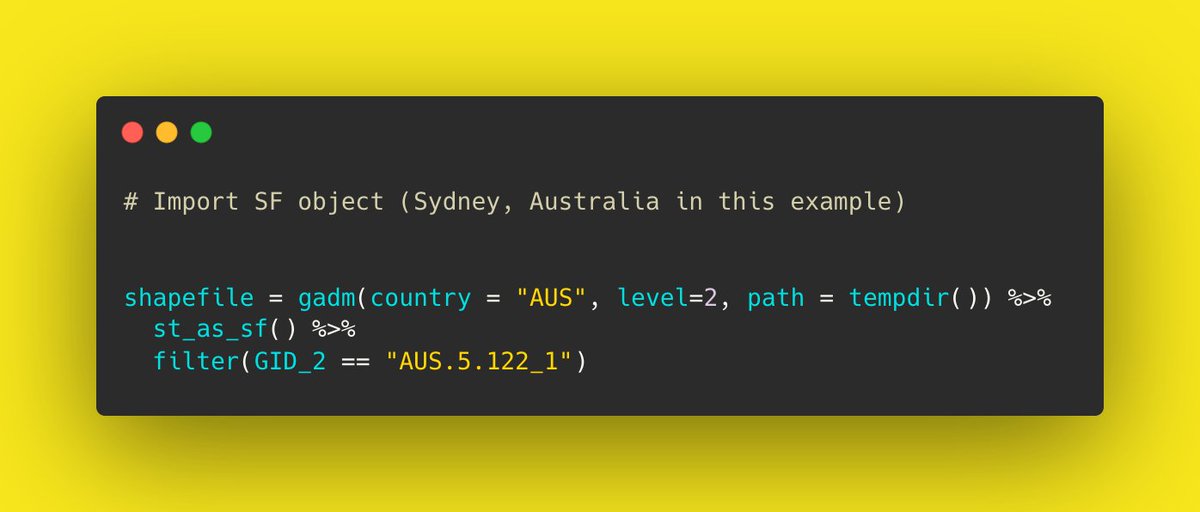
Step 3:
Import your region of interest—i.e. an SF object.
You can download this directly to your workspace using the geodata package.
Import your region of interest—i.e. an SF object.
You can download this directly to your workspace using the geodata package.
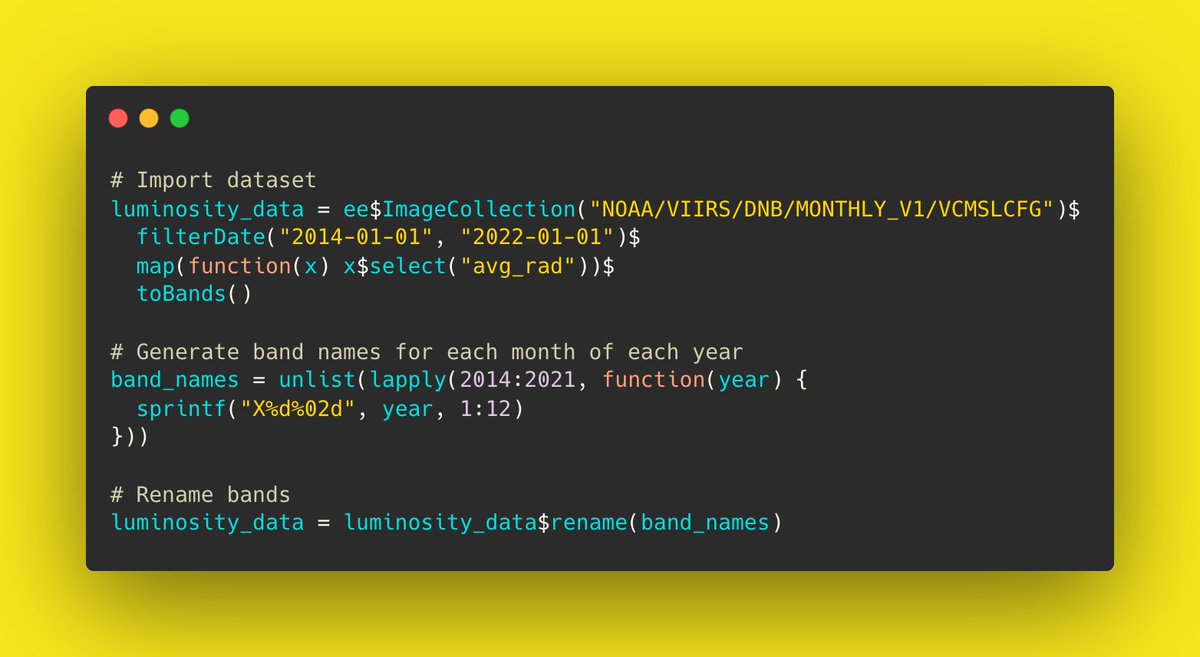
Step 4:
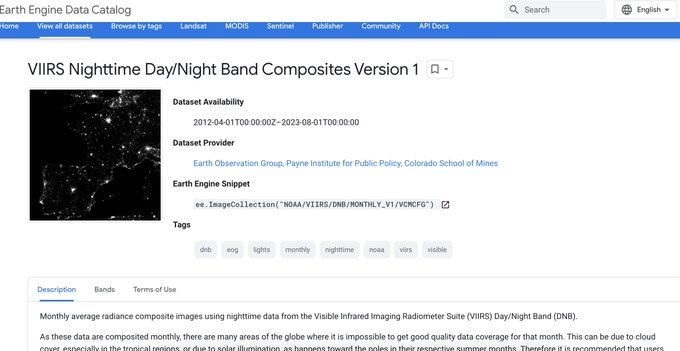
Import the nightlights data.
In this example, we'll be using monthly nightlights data from the Colorado School of Mines.
You can do this using the ee$ImageCollection() command from RGEE.
Import the nightlights data.
In this example, we'll be using monthly nightlights data from the Colorado School of Mines.
You can do this using the ee$ImageCollection() command from RGEE.
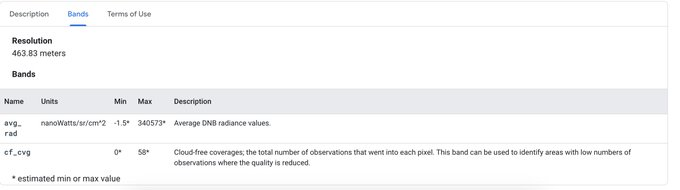
Step 5:
Select the relevant band from the nightlights images.
For us, it's the average radiance band (avg_rad).
Select the relevant band from the nightlights images.
For us, it's the average radiance band (avg_rad).
Step 6:
Filter for the months we're interested in.
It will be January 2014 - December 2022.
We can do this using the filterDate() command from RGEE.
Filter for the months we're interested in.
It will be January 2014 - December 2022.
We can do this using the filterDate() command from RGEE.
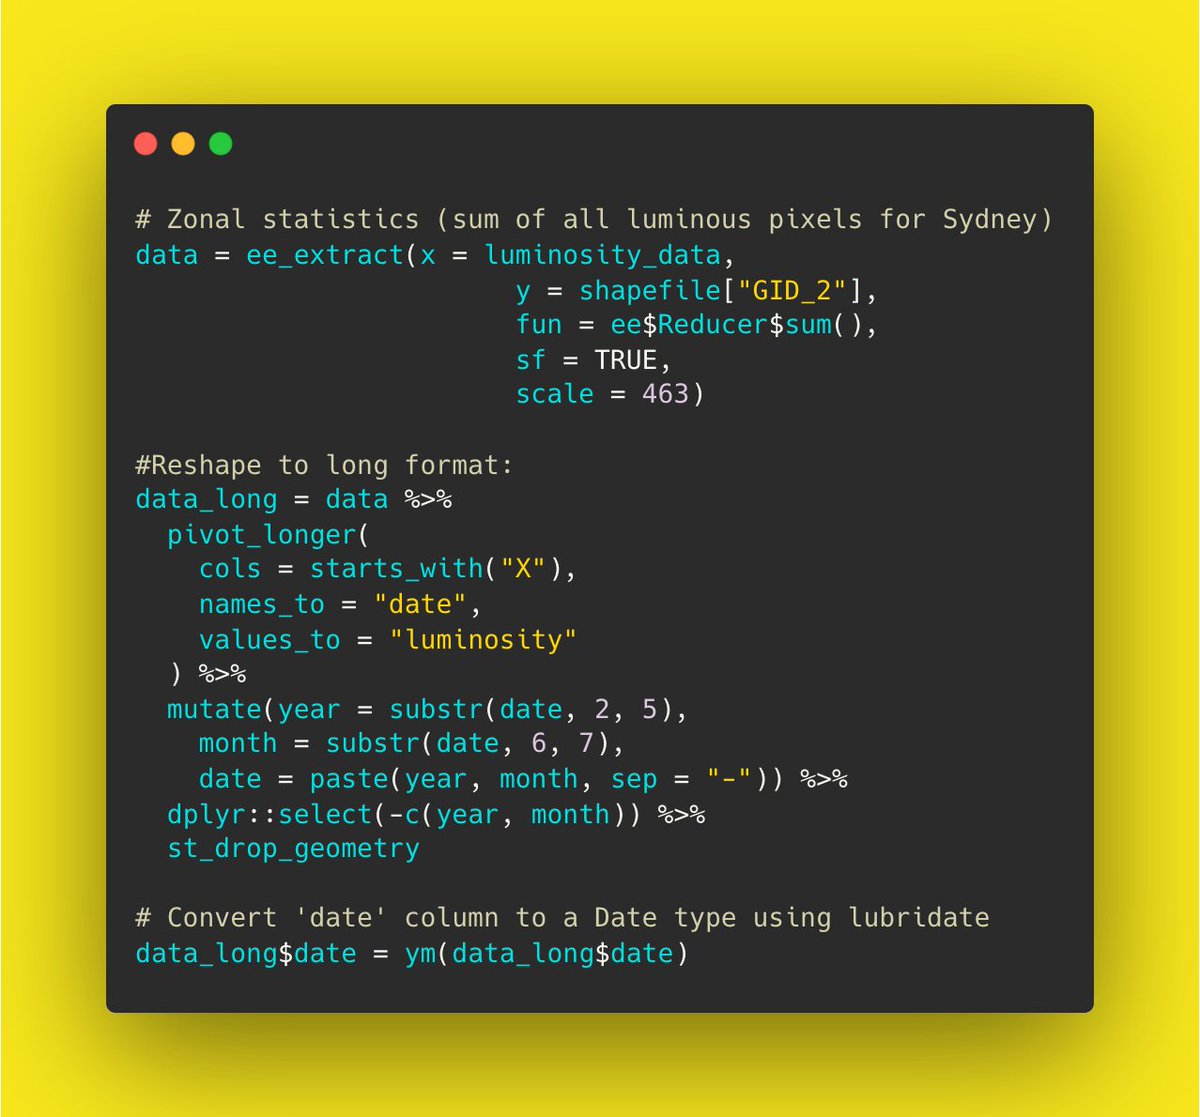
Step 7:
Calculate the zonal statistics for the region of interest.
We can sum up all luminous pixels for the region using the ee_extract() command.
The output will be a wide data frame.
Calculate the zonal statistics for the region of interest.
We can sum up all luminous pixels for the region using the ee_extract() command.
The output will be a wide data frame.
Step 8:
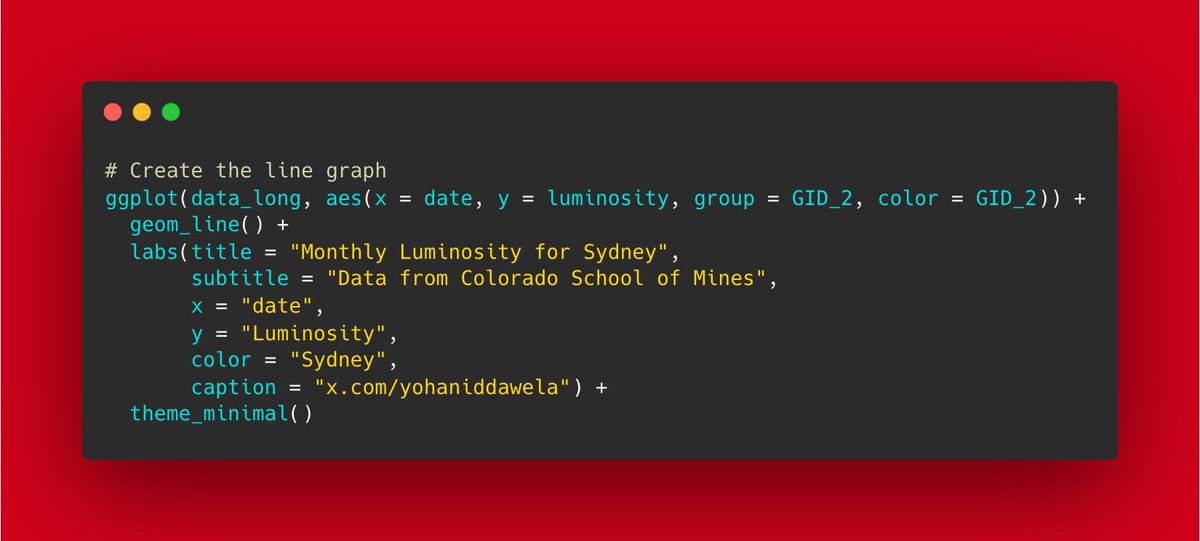
Finally, we can transform the data frame into long format.
Then we can easily the graph the results using ggplot2.
The output is as follows:
Finally, we can transform the data frame into long format.
Then we can easily the graph the results using ggplot2.
The output is as follows:
𝗛𝗲𝗿𝗲'𝘀 𝘁𝗵𝗲 𝗳𝘂𝗹𝗹 𝗰𝗼𝗱𝗲𝗯𝗮𝘀𝗲:
Loading the packages:
Loading the packages:

Import geometries (Sydney in this example)
Import the Image Collection from Google Earth Engine:
Calculate zonal statistics:
Create linegraph on ggplot2:
And there you have it.
Nightlights data processed and visualised in just 5 steps.
No downloading data locally needed.
Nightlights data processed and visualised in just 5 steps.
No downloading data locally needed.
If you liked this then give us a follow @yohaniddawela for more breakdowns and tutorials.
You may also enjoy this post on nightlights data:
You may also enjoy this post on nightlights data:
Interested in going deeper?
I provide more in-depth geospatial analyses and tutorials in my newsletter.
You can subscribe here: yohan.so
I provide more in-depth geospatial analyses and tutorials in my newsletter.
You can subscribe here: yohan.so


Loading suggestions...