


Let's see an example
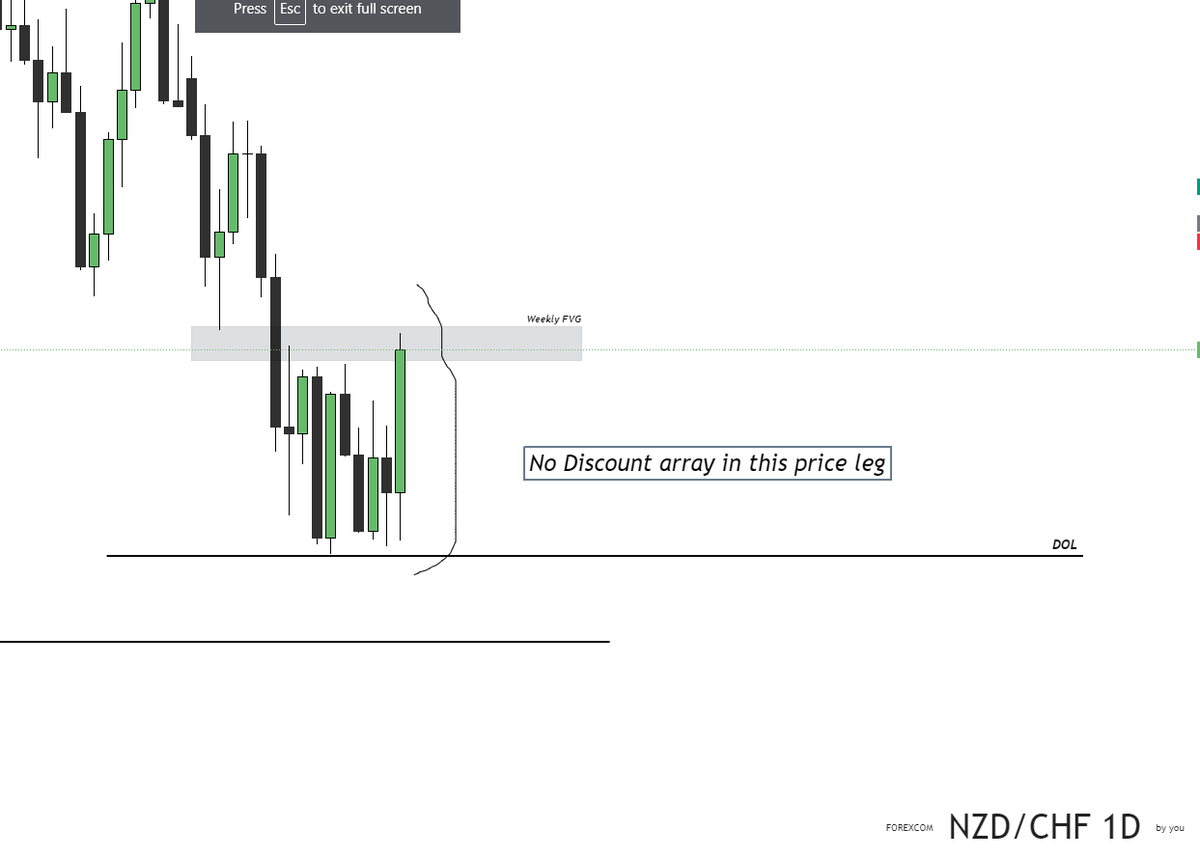
In The Weekly Timeframe in NZDCHF, We can see that the orderflow is bearish and the Draw on Liquidity is clear and near.
Price also has no reason to retrace beyond the weekly FVG.
In The Weekly Timeframe in NZDCHF, We can see that the orderflow is bearish and the Draw on Liquidity is clear and near.
Price also has no reason to retrace beyond the weekly FVG.
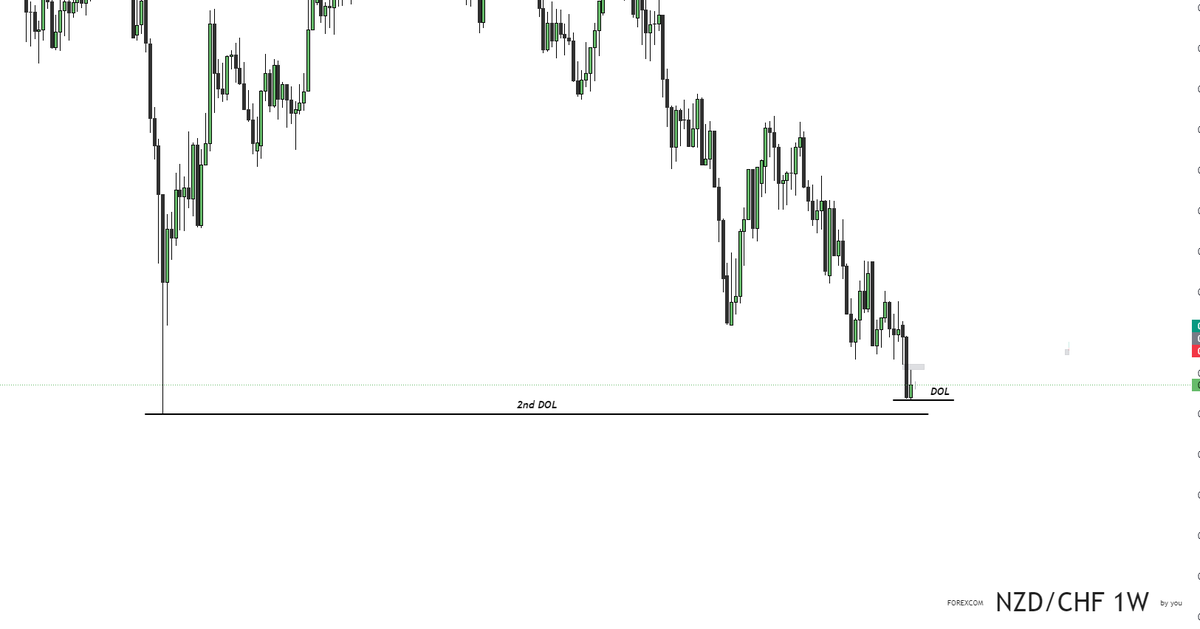
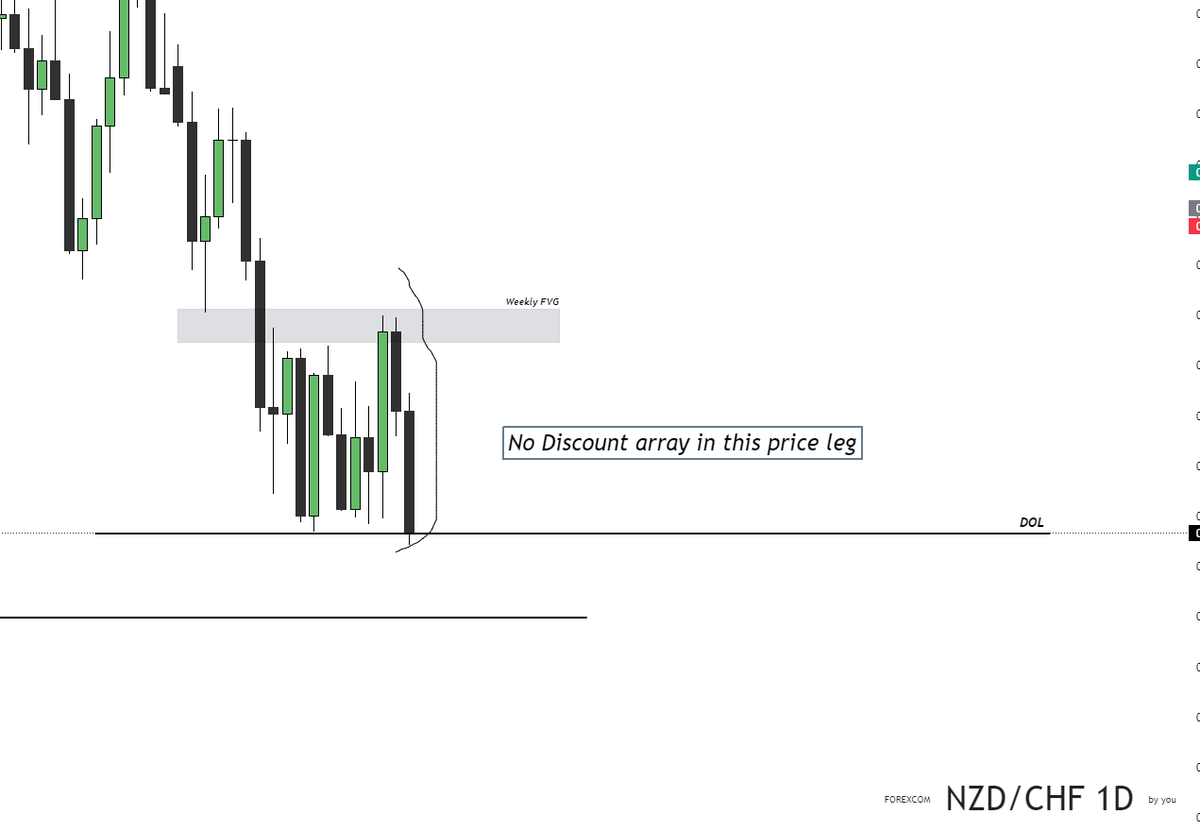
On the Daily Timeframe, once we tap into the Weekly FVG, we can see THAT THERE IS NO OPPOSING DISCOUNT ARRAYS to hold back price until we reach the Draw on Liquidity.
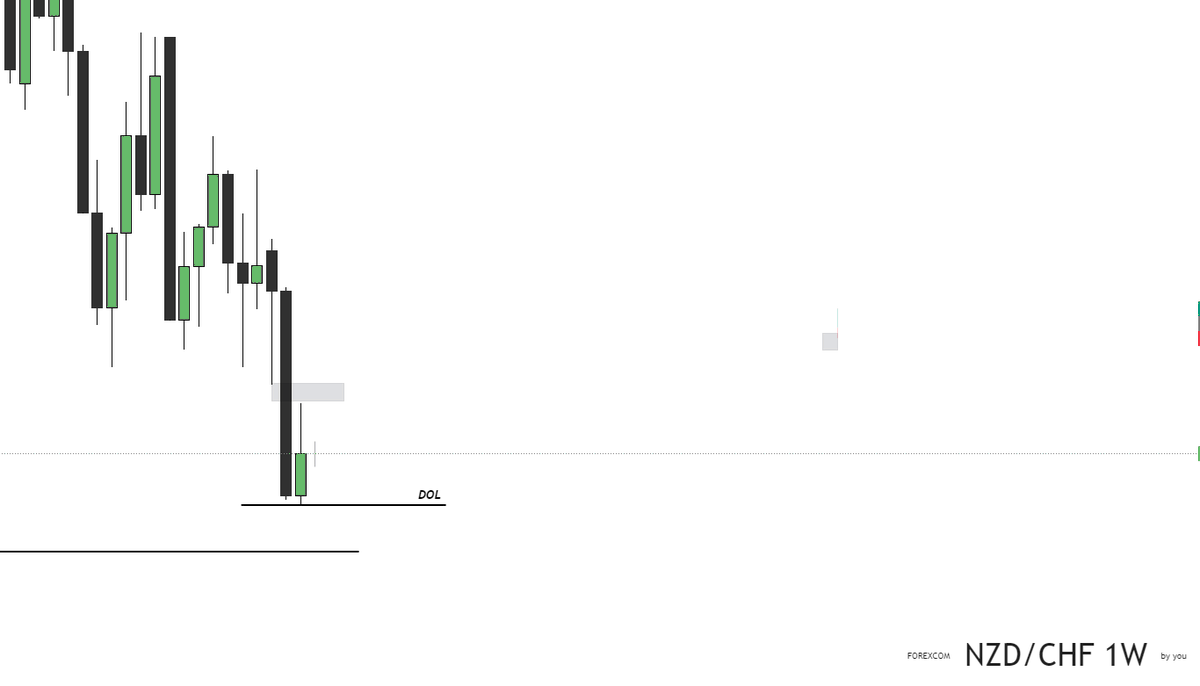
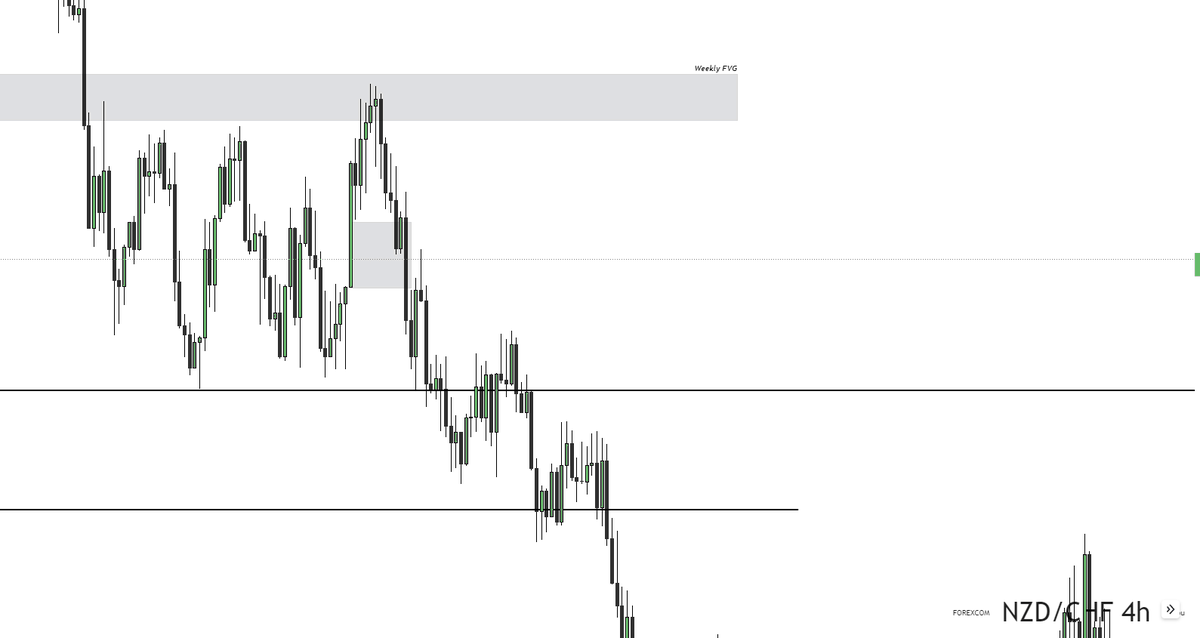
In the H4 Timeframe, there is a Bullish FVG( discount array) to hold back price.
But once when we disrespect the Bullish FVG and create a Bearish FVG very close to the DOL is the highest probability trade condition to look to enter the market.
But once when we disrespect the Bullish FVG and create a Bearish FVG very close to the DOL is the highest probability trade condition to look to enter the market.
We can now go to the Lower timeframes to find our entry pattern. Remember, THE CLOSER WE ARE TO THE DRAW ON LIQUIDITY, THE SMALLER THE RETRACEMETS ARE GOING TO BE.
Please do follow me for more such threads❤️
For more detailed knowledge watch:
youtube.com
Please do follow me for more such threads❤️
For more detailed knowledge watch:
youtube.com
Loading suggestions...