

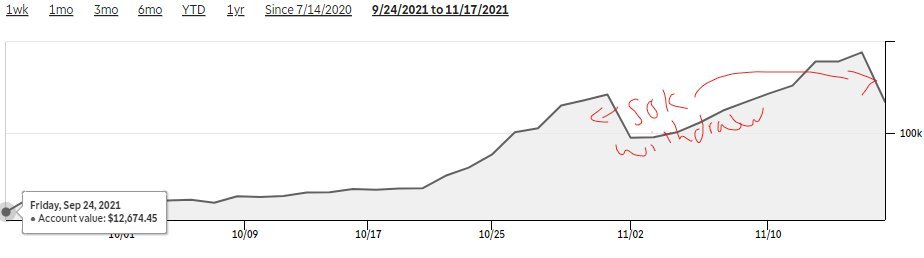
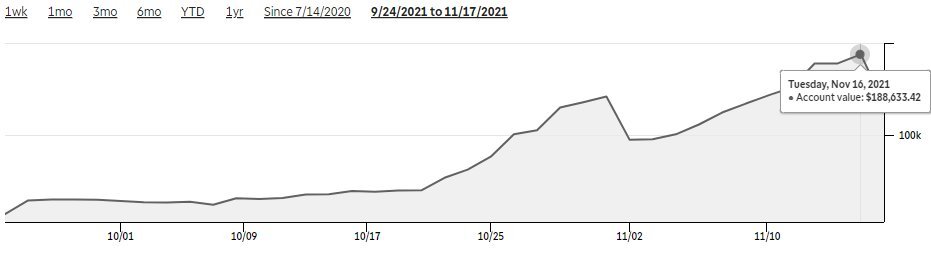
I've Turned $10k into $200k+ in under 2 months daytrading.
Information you'll find in this thread is a gold mine.
Here is everything you need to know about trading 👇
Information you'll find in this thread is a gold mine.
Here is everything you need to know about trading 👇
This thread is structured into 8 different lessons..
L1: Understanding Options
L2: Price Action Basics
L3: Patterns
L4: EMAs & VWAP
L5: Supply & Demand
L6: LVL2 & Tape Reading W/ S&D
L7: Risk/Trade Management
L8: Psychology
L1: Understanding Options
L2: Price Action Basics
L3: Patterns
L4: EMAs & VWAP
L5: Supply & Demand
L6: LVL2 & Tape Reading W/ S&D
L7: Risk/Trade Management
L8: Psychology
L1: Understanding Options 🌟
In this lesson we will be going over..
- Options Basics
- Greeks
- IV
- How To Pick Contracts
In this lesson we will be going over..
- Options Basics
- Greeks
- IV
- How To Pick Contracts
OPTIONS BASICS
Options are derivatives and there's 2 type..
Calls: Bullish Buyer - Bearish Seller
- We play this when we think the price will RISE 📈
Puts: Bearish Buyer - Bullish Seller
- We play this when we think price will FALL 📉
Options are derivatives and there's 2 type..
Calls: Bullish Buyer - Bearish Seller
- We play this when we think the price will RISE 📈
Puts: Bearish Buyer - Bullish Seller
- We play this when we think price will FALL 📉
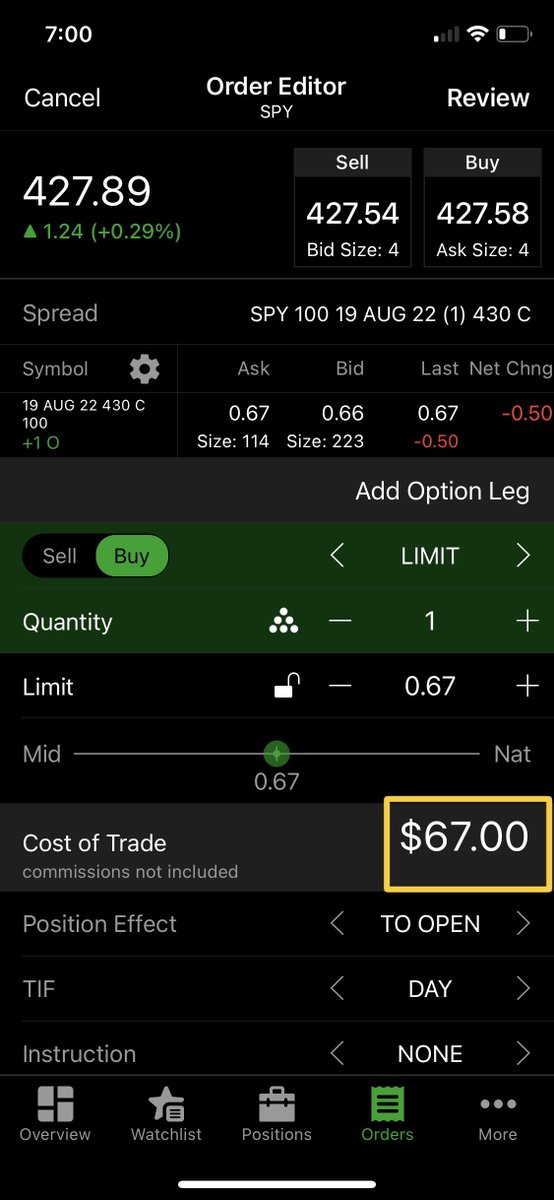
OPTIONS PREMIUM
Buyers have to pay a premium for each contract.
Option contracts represent 100 shares of the underlying security.
Therefore the actual cost is 100x more than you see.
Ex.
.15 = $15
1.50 = $150
15.00 = $1,500
Buyers have to pay a premium for each contract.
Option contracts represent 100 shares of the underlying security.
Therefore the actual cost is 100x more than you see.
Ex.
.15 = $15
1.50 = $150
15.00 = $1,500
EXPIRATION DATES
All options have an expiration date, which means they no longer exist or can be traded after they expire, unlike shares of stock which have no expiration date and can be held forever.
The further your expiration, the less volatile your contract will be.
All options have an expiration date, which means they no longer exist or can be traded after they expire, unlike shares of stock which have no expiration date and can be held forever.
The further your expiration, the less volatile your contract will be.
STRIKE PRICE
An option can be converted to buy/sell shares of stock at the options strike price.
This is called exercising contracts. We DON'T do this.
An option can be converted to buy/sell shares of stock at the options strike price.
This is called exercising contracts. We DON'T do this.
IN, AT, & OUT THE MONEY
CALLS
In: Strike price is below stock price
At: Strike price is at the stock price
Out: Strike price is above the stock price
PUTS
In: Strike price is above the stock price
At: Strike price is at the stock price
Out: Strike price is below the stock price
CALLS
In: Strike price is below stock price
At: Strike price is at the stock price
Out: Strike price is above the stock price
PUTS
In: Strike price is above the stock price
At: Strike price is at the stock price
Out: Strike price is below the stock price
THE GREEKS
Delta measures change in option price when stock price moves.
Gamma measures change in change in delta when stock price moves.
Theta measures change in option price every day as the expiration gets closer.
Theta is VERY important.
Delta measures change in option price when stock price moves.
Gamma measures change in change in delta when stock price moves.
Theta measures change in option price every day as the expiration gets closer.
Theta is VERY important.
IMPLIED VOLATILITY (IV)
IV is very confusing topic for new traders. Let's break it down.
IV can be interpreted as the market’s expected magnitude for a stock’s price changes in the future.
IV is very confusing topic for new traders. Let's break it down.
IV can be interpreted as the market’s expected magnitude for a stock’s price changes in the future.
OPTION PRICES DRIVE IV
More buying pressure than selling pressure
= Increase in options prices
= Higher IV
More selling pressure than buying pressure
= Decrease in options prices
= Lower IV
-----
More buying pressure than selling pressure
= Increase in options prices
= Higher IV
More selling pressure than buying pressure
= Decrease in options prices
= Lower IV
-----
When option buyers are willing to pay high premiums and options sellers demand high selling prices, that’s an indication that traders are expecting lots of stock price volatility in the future.
If the opposite occurs that’s an indication that they are NOT expecting volatility.
If the opposite occurs that’s an indication that they are NOT expecting volatility.
IV RANK
IV Rank simply tells us whether IV is high or LOW in the underlying based on the past year of IV data.
0% - IV is the lowest it's been over the past year
50% - IV is at the midpoint over the past year
100% - IV is at the highest over the past year
IV Rank simply tells us whether IV is high or LOW in the underlying based on the past year of IV data.
0% - IV is the lowest it's been over the past year
50% - IV is at the midpoint over the past year
100% - IV is at the highest over the past year
IV PERCENTILE
IV Percentile tells us how often the stock’s IV has been BELOW it’s current IV over the past year.
Example: An IV percentile of 85% means the stock’s IV has been below its current level of IV on 85% of days over the past year.
IV Percentile tells us how often the stock’s IV has been BELOW it’s current IV over the past year.
Example: An IV percentile of 85% means the stock’s IV has been below its current level of IV on 85% of days over the past year.
IV CRUSH & EARNINGS
IV Crush is when options premium collapse due to a sudden decrease in IV. This tends to happen most often when playing EARNINGS.
Playing earnings is VERY dangerous and IV should ALWAYS be taken into consideration.
IV Crush is when options premium collapse due to a sudden decrease in IV. This tends to happen most often when playing EARNINGS.
Playing earnings is VERY dangerous and IV should ALWAYS be taken into consideration.
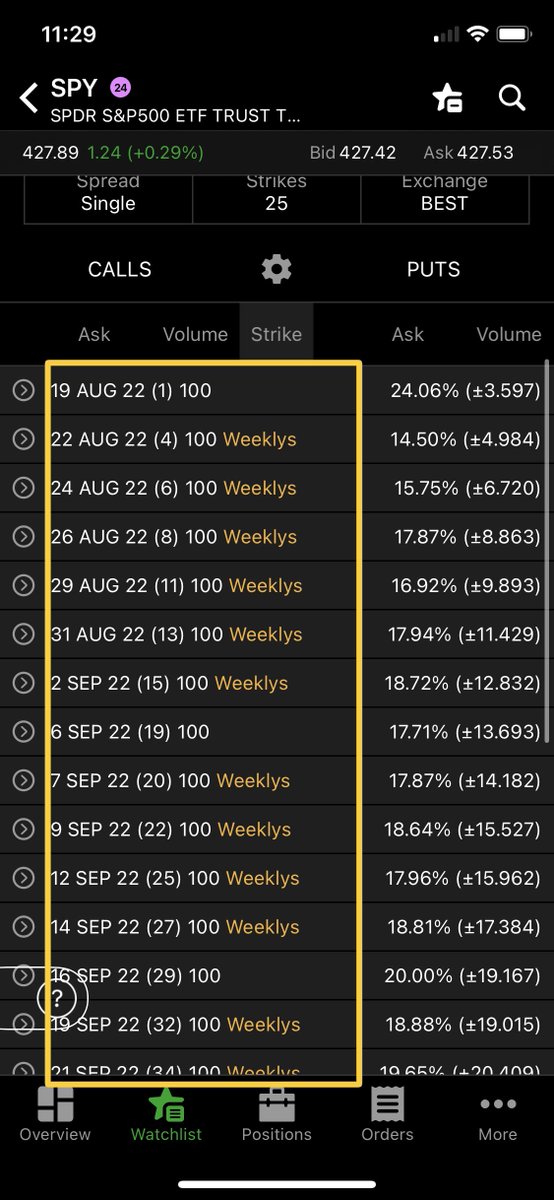
HOW TO PICK CONTRACTS - EXPIRATION DATES
If you’re day trading you typically want to pick the closest expiration (after 0dte), if you’re swinging you want to pick the time frame you think your swing will last.
If you’re a beginner don’t play 0dte’s, thank me later.
If you’re day trading you typically want to pick the closest expiration (after 0dte), if you’re swinging you want to pick the time frame you think your swing will last.
If you’re a beginner don’t play 0dte’s, thank me later.
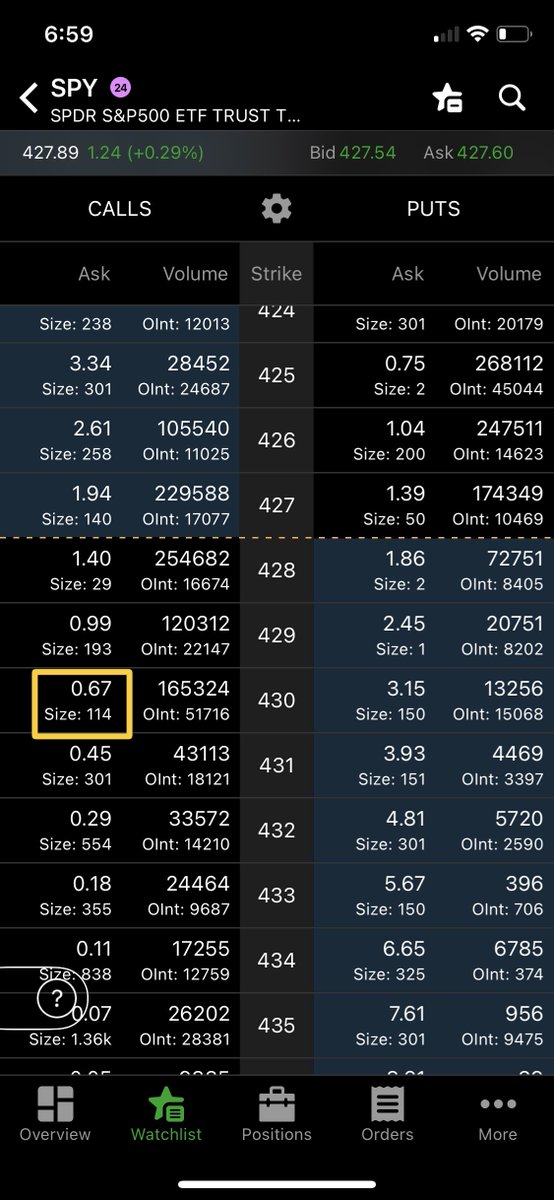
HOW TO PICK CONTRACTS - VOLUME
You NEED contracts with volume.
Volume is what makes your contracts move, if you have little volume on your contracts, they’re not gonna move nicely.
Volume is also what’s going to help you enter & exit your position as quickly as possible.
You NEED contracts with volume.
Volume is what makes your contracts move, if you have little volume on your contracts, they’re not gonna move nicely.
Volume is also what’s going to help you enter & exit your position as quickly as possible.
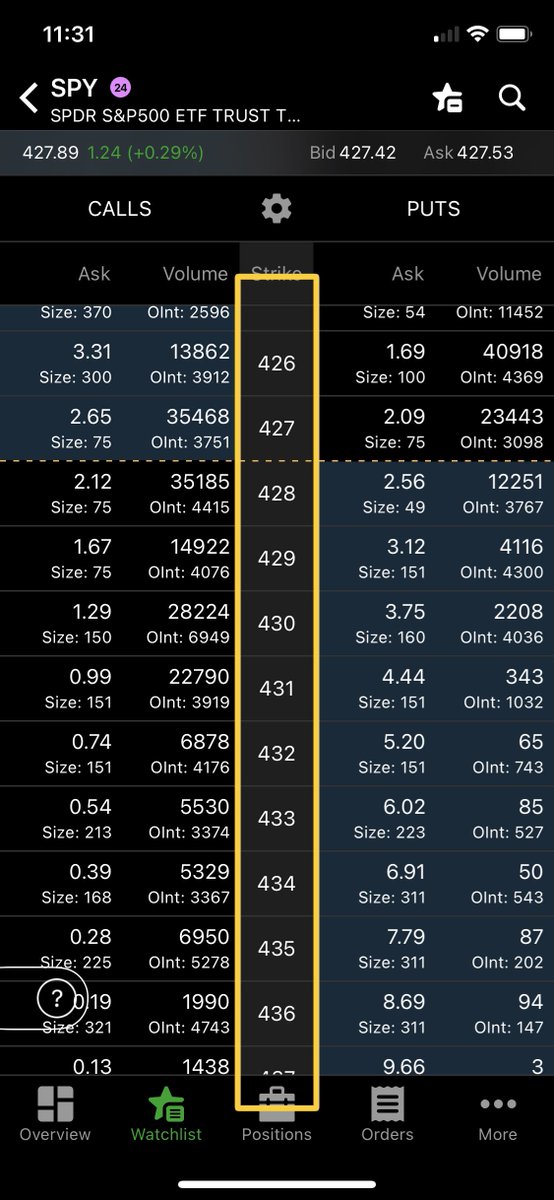
HOW TO PICK CONTRACTS - BID/ASK SPREAD
You want to look for contracts with small bid/ask spreads.
This allows you to get in and out quicker + get in at a reasonable average.
You want to look for contracts with small bid/ask spreads.
This allows you to get in and out quicker + get in at a reasonable average.
HOW TO PICK CONTRACTS - OPEN INTEREST
Open interest shows the amount of OPEN contracts being held at a certain strike price.
It shows how much INTEREST is in the certain strike.
Open interest is a key indicator when it comes to swinging.
Open interest shows the amount of OPEN contracts being held at a certain strike price.
It shows how much INTEREST is in the certain strike.
Open interest is a key indicator when it comes to swinging.
L2: Price Action Basics 🌟
In this lesson we will be going over the basics of..
- Candlestick Anatomy
- Volume
- Trends
- Support & Resistance
In this lesson we will be going over the basics of..
- Candlestick Anatomy
- Volume
- Trends
- Support & Resistance
CANDLESTICK ANATOMY
Take a look at the image below & study it. It's self explanatory but just incase you need help.
For a bullish candle, the open is at the bottom of the body, and the close is at the top. Opposite for a bearish candle.
Take a look at the image below & study it. It's self explanatory but just incase you need help.
For a bullish candle, the open is at the bottom of the body, and the close is at the top. Opposite for a bearish candle.

VOLUME
Volume simply represents the amount shares being traded in a specific time period. So if you're looking at the 1hr time frame and see 10m in volume that means there were 10 million shares bought/sold in 1hr.
Volume simply represents the amount shares being traded in a specific time period. So if you're looking at the 1hr time frame and see 10m in volume that means there were 10 million shares bought/sold in 1hr.
In this example we're looking at a strong move up in the stock justified by HIGH volume meaning buyers are in control, led by a LOW volume pullback meaning sellers are weak, leading back into a HIGH volume move up representing buyers are still present.

TRENDS
There's 3 different stages a market can be in.
1. Uptrend: Market is making higher highs and higher lows.
2. Consolidation: Market is trading sideways.
3. Downtrend: Market is putting in lower highs and lower lows.
Let's go over an example of each one.
There's 3 different stages a market can be in.
1. Uptrend: Market is making higher highs and higher lows.
2. Consolidation: Market is trading sideways.
3. Downtrend: Market is putting in lower highs and lower lows.
Let's go over an example of each one.
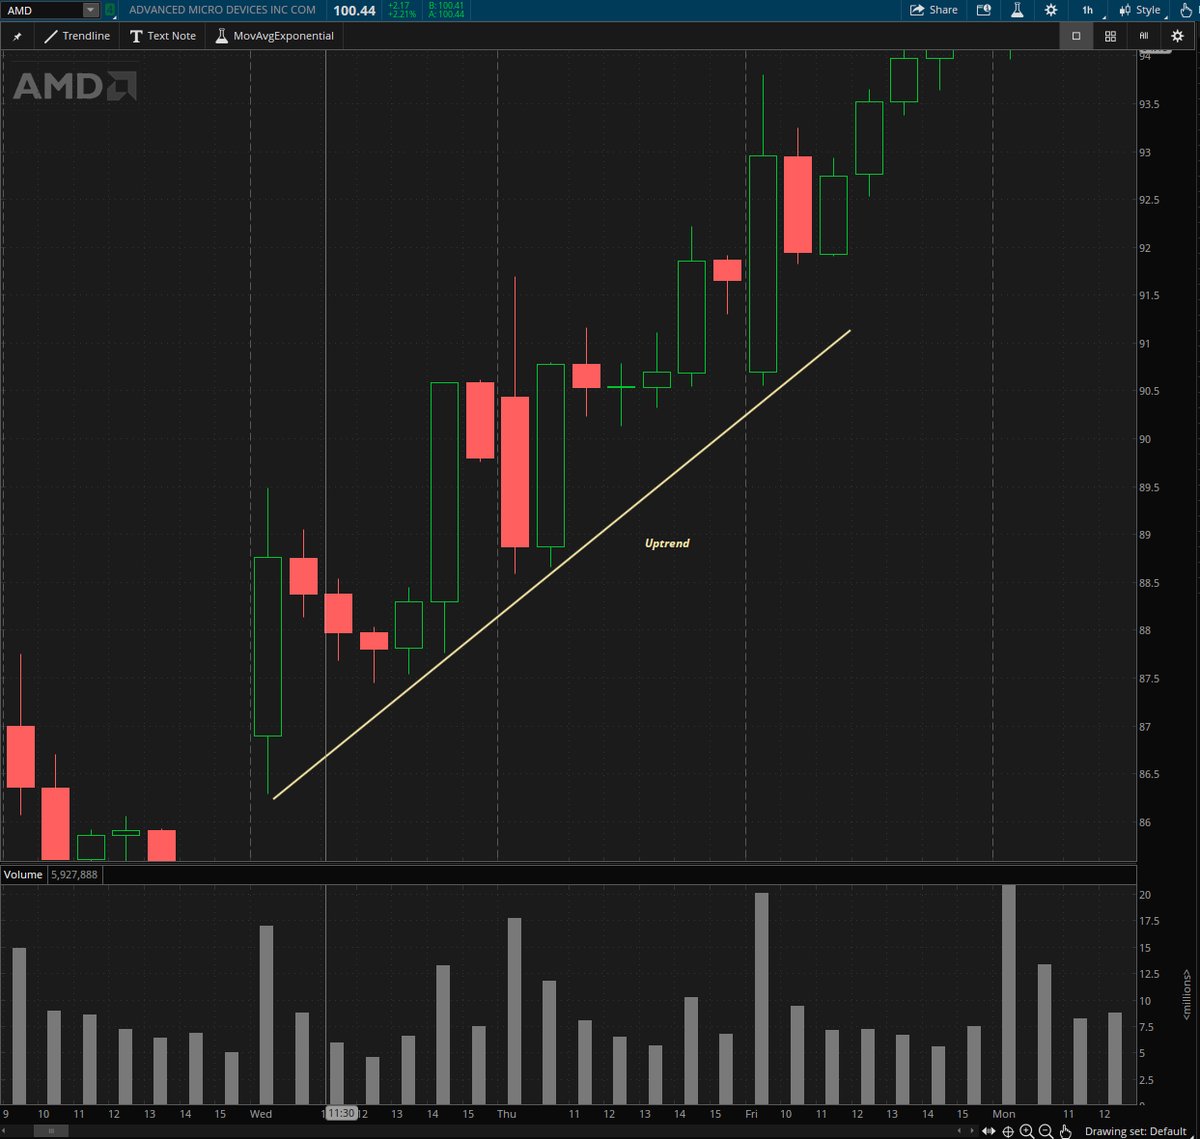
UPTREND
An uptrend is justified by higher highs and higher lows. In this example as you can see we're on the 1hr timeframe, and in this timeframe we're in an uptrend.
It's important to realize the market can be in different trends on different timeframes.
An uptrend is justified by higher highs and higher lows. In this example as you can see we're on the 1hr timeframe, and in this timeframe we're in an uptrend.
It's important to realize the market can be in different trends on different timeframes.
CONSOLIDATION
A consolidation also known as a balanced market is when both buyers and sellers are agreeing on a price, therefore price is not necessarily going up or down but instead sideways.
In this example price is trading sideways before it breaks to the upside.
A consolidation also known as a balanced market is when both buyers and sellers are agreeing on a price, therefore price is not necessarily going up or down but instead sideways.
In this example price is trading sideways before it breaks to the upside.
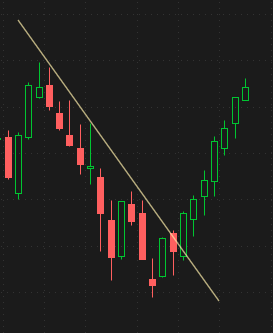
DOWNTREND
A downtrend is the opposite of an uptrend, instead of the market putting in higher highs and higher lows it's putting in lower highs and lower lows, meaning sellers are in control.
In this example we see how price was in a downtrend, broke out and started an uptrend.
A downtrend is the opposite of an uptrend, instead of the market putting in higher highs and higher lows it's putting in lower highs and lower lows, meaning sellers are in control.
In this example we see how price was in a downtrend, broke out and started an uptrend.
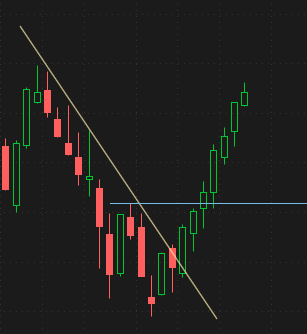
SHIFT IN STRUCTURE
Let's talk about when market shifts in structure, meaning it's breaking it's current structure and shifting into a new one.
If we use the same example as before. You want to look for your most obvious lower high or lower low. In this case it's the blue line.
Let's talk about when market shifts in structure, meaning it's breaking it's current structure and shifting into a new one.
If we use the same example as before. You want to look for your most obvious lower high or lower low. In this case it's the blue line.

So yes, price did breakout of this downtrend, but that's one of the main reasons most breakout traders fail, they simply play breakout of a line on their chart and not the actual structure shift.
WHAT ARE KEY LEVELS?
Key levels are AREAS on a chart where a pause, reversal, or breakout is expected due to the amount of supply & demand tied to them.
Key levels are referred to as a level but you should always see them as a general AREA.
Key levels are AREAS on a chart where a pause, reversal, or breakout is expected due to the amount of supply & demand tied to them.
Key levels are referred to as a level but you should always see them as a general AREA.
HOW DO WE FIND KEY LEVELS?
Key levels should be able to stand out to you, you shouldn't have to dig deep trying to find them. Every key level should also have MEANING behind it. For example is your level where a reversal happened, HOD or LOD, lots of rejection or bounces, etc.
Key levels should be able to stand out to you, you shouldn't have to dig deep trying to find them. Every key level should also have MEANING behind it. For example is your level where a reversal happened, HOD or LOD, lots of rejection or bounces, etc.
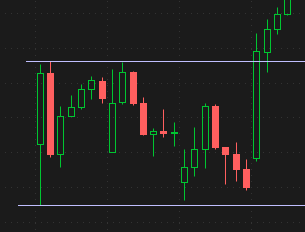
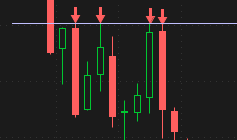
EXAMPLE OF RESISTANCE
Resistance is a level/area price tends to keep rejecting from due to sellers. In this example we see every time price came up to this level, we rejected back down.
The more touches your level gets the better.
Resistance is a level/area price tends to keep rejecting from due to sellers. In this example we see every time price came up to this level, we rejected back down.
The more touches your level gets the better.
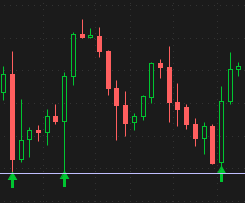
EXAMPLE OF SUPPORT
Support is the opposite of resistance. Support is a level/area price tends to keep bouncing from due to buyers stepping in. In this example we see every time price came down to this level, we came back up.
Support is the opposite of resistance. Support is a level/area price tends to keep bouncing from due to buyers stepping in. In this example we see every time price came down to this level, we came back up.
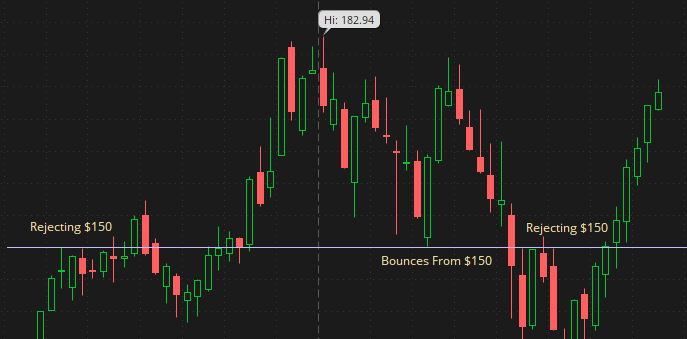
WHAT ARE PSYCHOLOGICAL LEVELS?
Psychological levels are levels such as $100, $125, $150, etc. Numbers that "sound nice", not levels such as $122.63 or $186.59. The reason why they're so important is because those are the prices where INVESTORS & INSTITUTIONS tend to enter.
Psychological levels are levels such as $100, $125, $150, etc. Numbers that "sound nice", not levels such as $122.63 or $186.59. The reason why they're so important is because those are the prices where INVESTORS & INSTITUTIONS tend to enter.
L3: Patterns 🌟
In this lesson we will be going over..
- Chart & Candlestick Patterns
- The Reality of Patterns
- How You Should Actually Use Patterns
In this lesson we will be going over..
- Chart & Candlestick Patterns
- The Reality of Patterns
- How You Should Actually Use Patterns
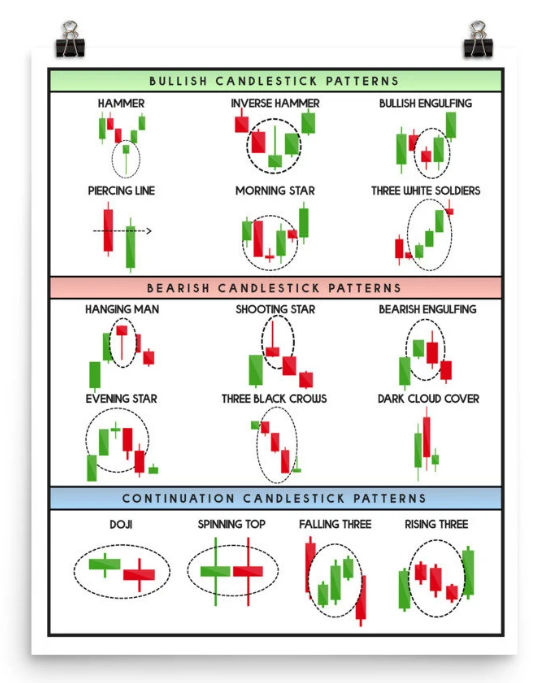
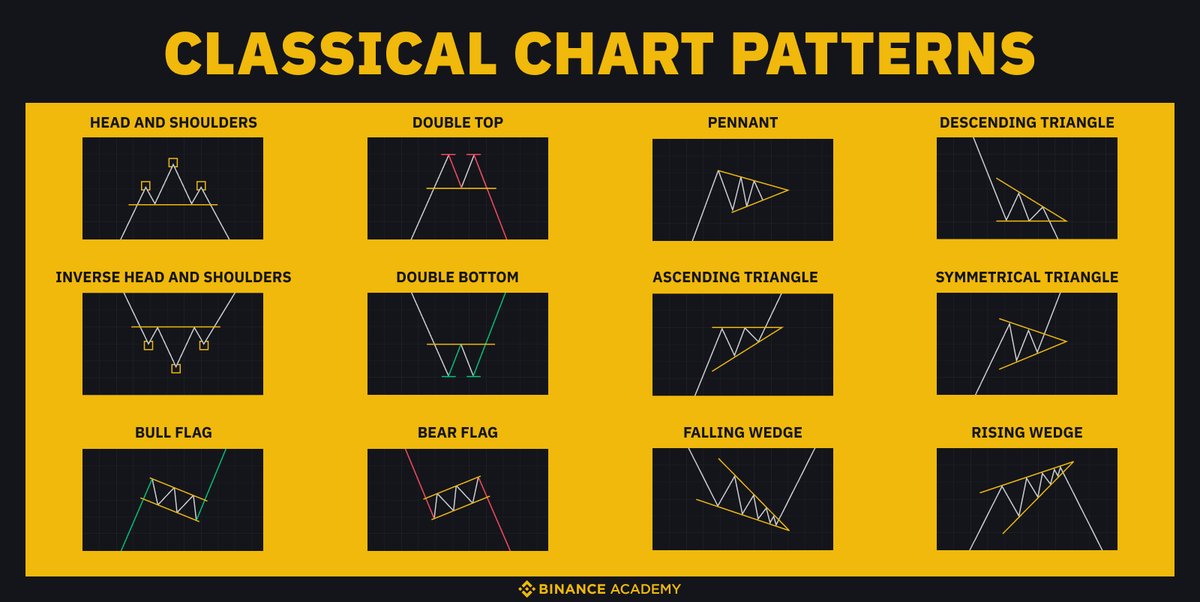
CHART & CANDLESTICK PATTERNS
There's tons of chart patterns, instead of making this thread longer than it already is and going over each one, I've shared a cheat sheet below to make things easier.
Make sure to study them!
There's tons of chart patterns, instead of making this thread longer than it already is and going over each one, I've shared a cheat sheet below to make things easier.
Make sure to study them!
THE REALITY OF PATTERNS
The truth about patterns is that you can't just learn the patterns and then proceed to play the actual pattern every time you see it, because most of the time, chances are they won't play out.
This isn't sustainable.
The truth about patterns is that you can't just learn the patterns and then proceed to play the actual pattern every time you see it, because most of the time, chances are they won't play out.
This isn't sustainable.
HOW YOU SHOULD ACTUALLY USE PATTERNS
Patterns allow you to back up or shift your thesis. This is the proper way to use them. If you're in a bullish position and you see a bullish pattern forming, this allows you to have more confidence in your trade.
Same thing the opposite way.
Patterns allow you to back up or shift your thesis. This is the proper way to use them. If you're in a bullish position and you see a bullish pattern forming, this allows you to have more confidence in your trade.
Same thing the opposite way.
L4: EMAs & VWAP 🌟
In this lesson we will be going over..
- EMAs
- VWAP
- Reality of Indicators
In this lesson we will be going over..
- EMAs
- VWAP
- Reality of Indicators
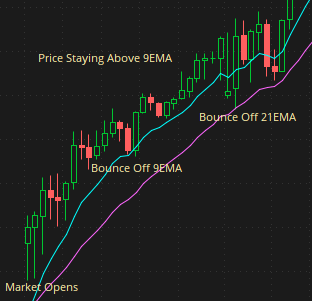
EMAs
EMAs (Exponential Moving Average) is an indicator that tracks recent price trend of a specific time period.
I use the 9 & 21 EMAs.
There's many different ways to use the EMAs, I personally use them to stay in my trade longer but also to enter/exit sometimes too!
EMAs (Exponential Moving Average) is an indicator that tracks recent price trend of a specific time period.
I use the 9 & 21 EMAs.
There's many different ways to use the EMAs, I personally use them to stay in my trade longer but also to enter/exit sometimes too!
Let's go over an example. Here we have price opening up and then proceeding to test the EMAs. You can enter at the bounce of the EMAs and have a stop below it, if you're already in a bullish position you're waiting for the EMA's to break in order to get out.
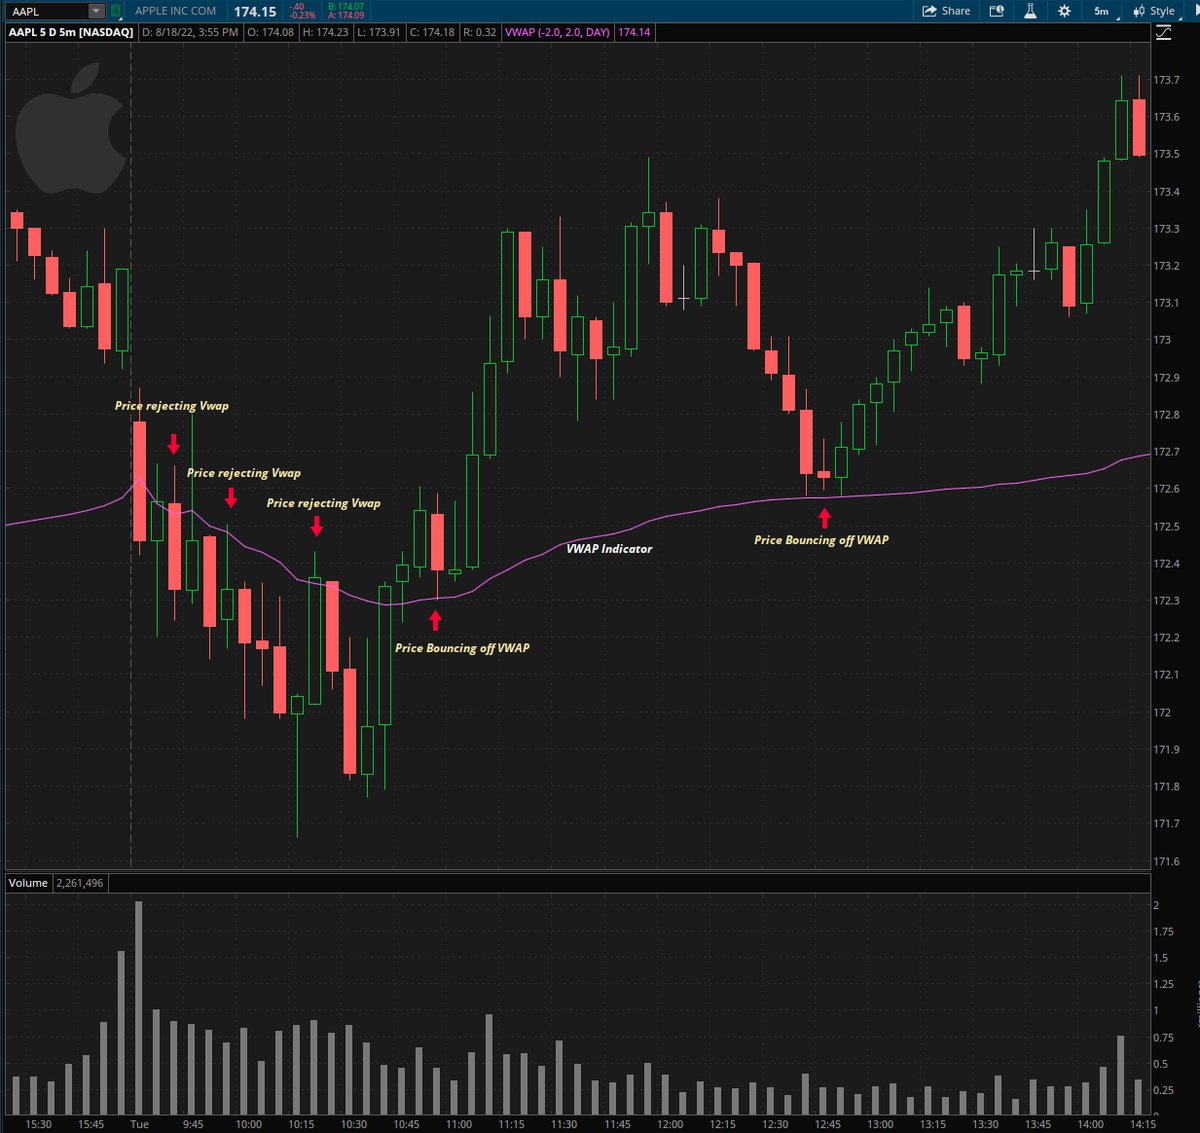
VWAP
VWAP is a very commonly used indicator and that's why it works. VWAP stands for Volume Weighted Average Price and it shows the average price the security should be at based off it's volume.
In this example we have price bouncing and rejecting from VWAP!
VWAP is a very commonly used indicator and that's why it works. VWAP stands for Volume Weighted Average Price and it shows the average price the security should be at based off it's volume.
In this example we have price bouncing and rejecting from VWAP!
REALITY OF INDICATORS
The same as patterns, indicators should not be used solely by themselves. They are here to help guide your thesis and manage your trades. Pair VWAP or EMAS with your own system and you have extra confluence!
The same as patterns, indicators should not be used solely by themselves. They are here to help guide your thesis and manage your trades. Pair VWAP or EMAS with your own system and you have extra confluence!
L5: SUPPLY & DEMAND 🌟
In this lesson we will be going over..
- How To Find Zones
- How To Execute Zones
- How To Outsmart Retail Traders
In this lesson we will be going over..
- How To Find Zones
- How To Execute Zones
- How To Outsmart Retail Traders
WHY TRADE SUPPLY & DEMAND?
When trading in the stock market, one must understand that it is heavily influenced by INSTITUTIONS and ALGORITHMS. To remain profitable in the market, one must trade like an institution.
When trading in the stock market, one must understand that it is heavily influenced by INSTITUTIONS and ALGORITHMS. To remain profitable in the market, one must trade like an institution.
WHAT IS SUPPLY?
Supply is where there is a quantity of shares yet to be sold (limits yet to be filled) at a certain area. This tends to lie in areas where the stock had previously sharply sold off due to sell orders being filled.
Supply is where there is a quantity of shares yet to be sold (limits yet to be filled) at a certain area. This tends to lie in areas where the stock had previously sharply sold off due to sell orders being filled.
WHAT IS DEMAND?
Demand is where there is a quantity of shares yet to be bought (limits yet to be filled) at a certain area. This tends to lie in areas where the stock previously rallied aggressively due to buy orders being filled.
Demand is where there is a quantity of shares yet to be bought (limits yet to be filled) at a certain area. This tends to lie in areas where the stock previously rallied aggressively due to buy orders being filled.
WHAT ARE LIMIT ORDERS?
Limit orders are orders that HAVE NOT been filled yet. This is how institutions trade, they set their limit orders at supply where they have sell orders, and limit orders at demand where they have buy orders.
Limit orders are orders that HAVE NOT been filled yet. This is how institutions trade, they set their limit orders at supply where they have sell orders, and limit orders at demand where they have buy orders.
WHY DO S/D ZONES WORK?
Institutions have previous limit orders set from before. Once you identify where you think they have their orders, once it reaches the zone, the orders fill, and go through with your thesis.
Institutions have previous limit orders set from before. Once you identify where you think they have their orders, once it reaches the zone, the orders fill, and go through with your thesis.
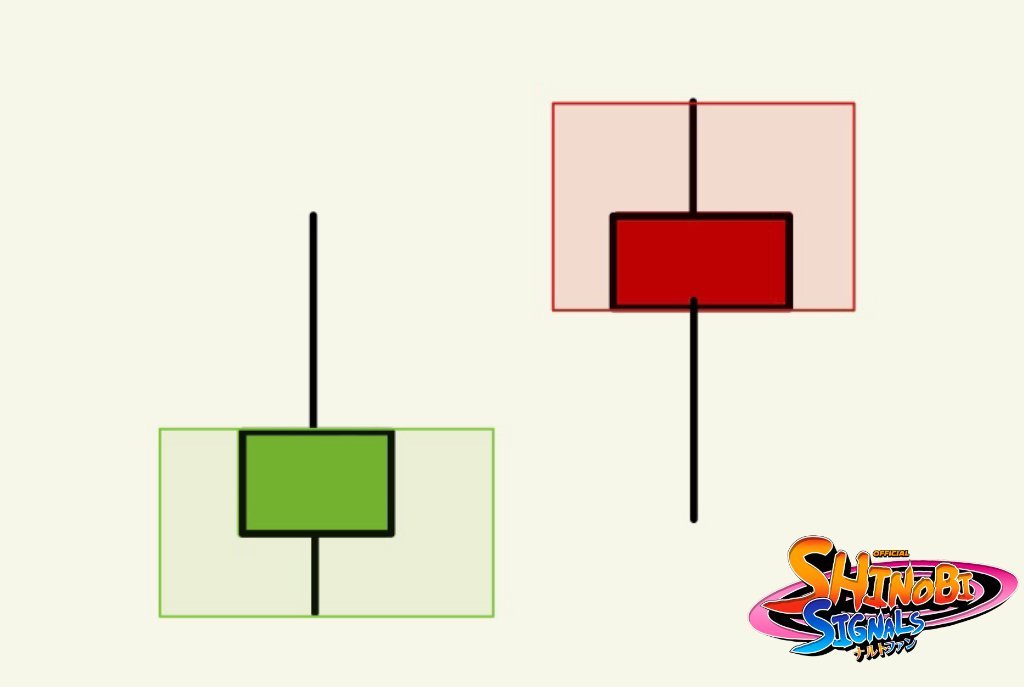
HOW TO DRAW S/D ZONES
I draw my zones on the 15m, 30m, & 1h timeframes but anything above the 5m works.
When drawing your zones you want to have your box cover the wick to the body.
Supply = Top wick -> bottom body
Demand = Bottom wick -> top body
See image for reference.
I draw my zones on the 15m, 30m, & 1h timeframes but anything above the 5m works.
When drawing your zones you want to have your box cover the wick to the body.
Supply = Top wick -> bottom body
Demand = Bottom wick -> top body
See image for reference.
If you're having trouble finding these areas, understand this. The market is always in either 2 stages, balanced or imbalanced market.
Balanced market is when b/s are agreeing on price. Imbalanced market is when one side has taken control.
The transition is your zone.
Balanced market is when b/s are agreeing on price. Imbalanced market is when one side has taken control.
The transition is your zone.
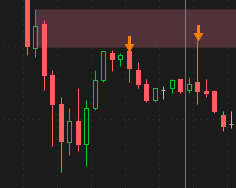
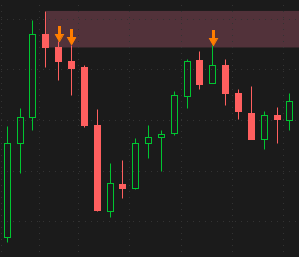
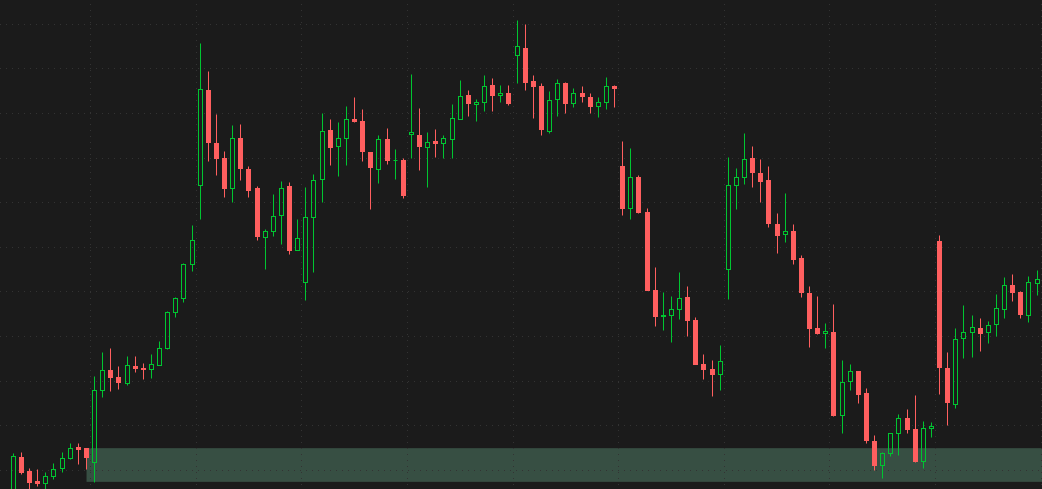
SUPPLY EXAMPLES
Below are 2 real life examples of supply zones. Both drawn from the top of the wick to the bottom of the body. Price comes back to our zone, sell orders get filled, rejection happens, and price moves down.
Below are 2 real life examples of supply zones. Both drawn from the top of the wick to the bottom of the body. Price comes back to our zone, sell orders get filled, rejection happens, and price moves down.
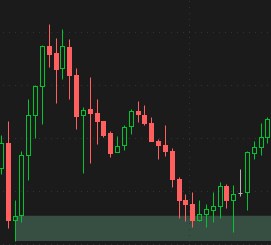
DEMAND EXAMPLES
Below are 2 real life examples of demand zones. Both drawn from the bottom of the wick to the top of the body. Prices comes down to our demand, buy orders get filled, bounce happens, and price moves up.
Below are 2 real life examples of demand zones. Both drawn from the bottom of the wick to the top of the body. Prices comes down to our demand, buy orders get filled, bounce happens, and price moves up.
ZONES GET WEAKER
Our zones represent limit buy/sell orders. As price touches our zone MORE, our zone gets weaker because there are LESS orders because they're being filled.
This is very important when playing S/D because if a zone is weak, it will lead to a S/D flip.
Our zones represent limit buy/sell orders. As price touches our zone MORE, our zone gets weaker because there are LESS orders because they're being filled.
This is very important when playing S/D because if a zone is weak, it will lead to a S/D flip.
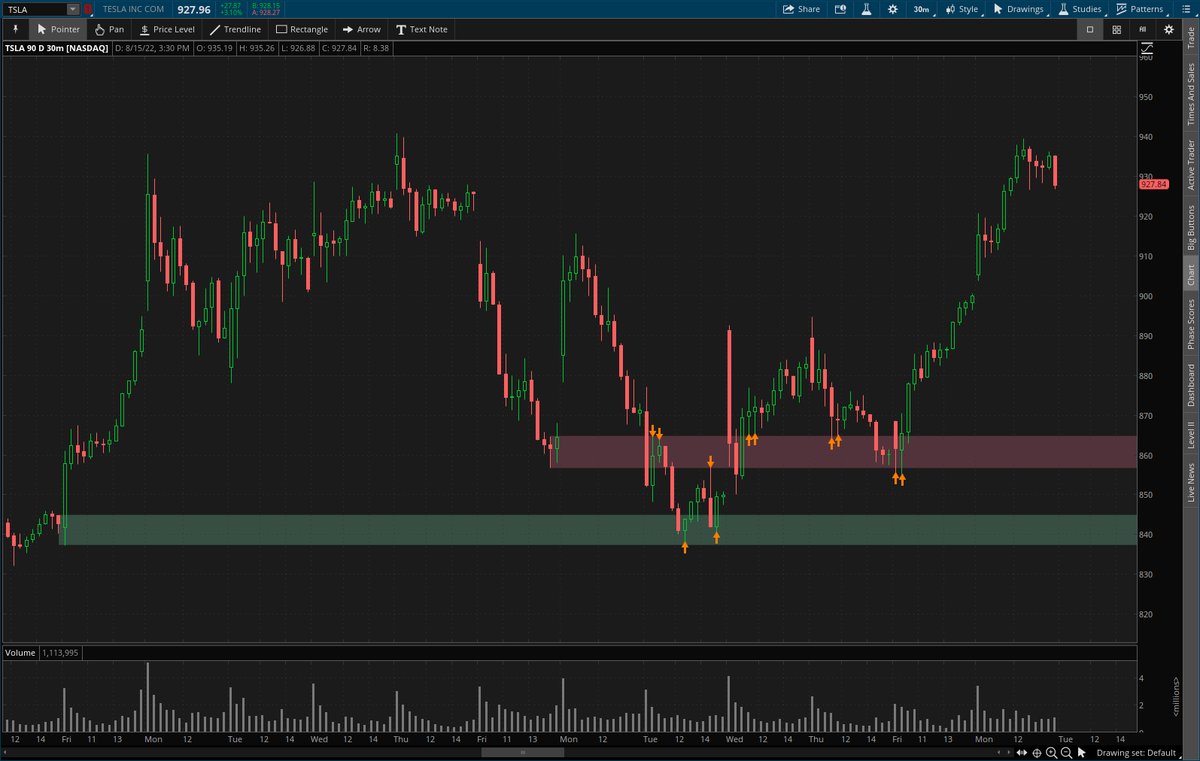
S/D FLIPS
As mentioned once a zone is weak and our zone is broken, demand turns into supply and supply turns into demand. This TSLA chart is the perfect example.
Our red zone which was demand (now supply) was broken, we reject and move down to our demand zone, bounce, move...
As mentioned once a zone is weak and our zone is broken, demand turns into supply and supply turns into demand. This TSLA chart is the perfect example.
Our red zone which was demand (now supply) was broken, we reject and move down to our demand zone, bounce, move...

...back up to our supply zone and reject. The next day we gap up, come down to what should be treated as demand and bounce multiple times!
When trading S/D flips it's important to wait for confirmation that the opposing side is present to defend the move.
When trading S/D flips it's important to wait for confirmation that the opposing side is present to defend the move.
HELPFUL TIPS
1. Watch LVL2/T&S as confluence in the zone. This allows you to know if buyers/sellers are present.
2. Scale into your zone.
3. Look at the lower time frames to spot a reversal.
1. Watch LVL2/T&S as confluence in the zone. This allows you to know if buyers/sellers are present.
2. Scale into your zone.
3. Look at the lower time frames to spot a reversal.
L6: LVL2 & TAPE W/ S&D 🌟
In this lesson we will be going over..
- How To Use LVL2/T&S
- How To Use LVL2/T&S W/ S&D
In this lesson we will be going over..
- How To Use LVL2/T&S
- How To Use LVL2/T&S W/ S&D
WHY YOU SHOULD USE LVL2/T&S
People use indicators like VWAP, EMAs, etc. The reality is that most indicators are LAGGING indicators. There is only 1 leading indicator and that is LVL2/T&S. This is what is creating the candles in front of you. This gives us an EDGE.
People use indicators like VWAP, EMAs, etc. The reality is that most indicators are LAGGING indicators. There is only 1 leading indicator and that is LVL2/T&S. This is what is creating the candles in front of you. This gives us an EDGE.
When tied with supply & demand, it allows us to see if buyers are sitting at our demand, and sellers are sitting at our supply.
WHAT IS LVL2?
LVL2 data provides us with real time supply and demand info of a stock through the amount of open buy and sell LIMIT orders.
Limit orders are orders that have NOT been filled yet.
LVL2 data provides us with real time supply and demand info of a stock through the amount of open buy and sell LIMIT orders.
Limit orders are orders that have NOT been filled yet.
HOW TO READ LVL2
LVL 2 is split into 2 sections, left side is the BID, right side is the ASK.
Each section has 3 columns.
1. Ex = Exchange of the orders
2. Bid/Ask = Price order is placed at
3. BS/AS = Size of the order
Image below for reference.
LVL 2 is split into 2 sections, left side is the BID, right side is the ASK.
Each section has 3 columns.
1. Ex = Exchange of the orders
2. Bid/Ask = Price order is placed at
3. BS/AS = Size of the order
Image below for reference.
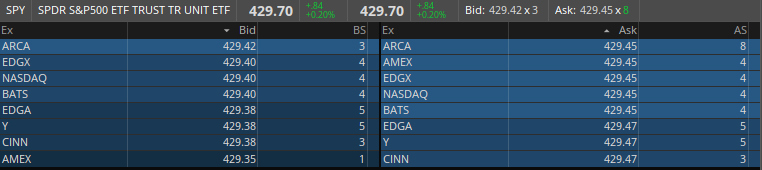
On TOS you have to multiply the BS/AS numbers by 100. On other brokers/platforms it may not be the same case.
For example..
3 on the bid = 300 shares @ 429.42
8 on the ask = 800 shares @ 429.45
For example..
3 on the bid = 300 shares @ 429.42
8 on the ask = 800 shares @ 429.45
WHAT IS T&S? (TIME & SALES)
T&S also known as the "tape" shows all orders that are FILLED. LVL2 shows unfilled orders, the tape shows filled orders.
So the limit orders you see on LVL2, will potentially be filled and shown on the tape.
T&S also known as the "tape" shows all orders that are FILLED. LVL2 shows unfilled orders, the tape shows filled orders.
So the limit orders you see on LVL2, will potentially be filled and shown on the tape.
HOW TO READ THE TAPE
The tape is also divided into 3 columns.
1- Time: The time the transaction took place.
2- Price: The price the transaction took place.
3- Size: How many shares were bought/sold.
You want to pay attention to the price and size of each order.
The tape is also divided into 3 columns.
1- Time: The time the transaction took place.
2- Price: The price the transaction took place.
3- Size: How many shares were bought/sold.
You want to pay attention to the price and size of each order.
Let's breakdown why the price the order went through at is important.
Below Bid: Aggressive selling pressure.
Bid: Strong selling pressure.
Between B/A: Neutral.
Ask: Strong buying pressure.
Above Ask: Aggressive buying pressure.
Below Bid: Aggressive selling pressure.
Bid: Strong selling pressure.
Between B/A: Neutral.
Ask: Strong buying pressure.
Above Ask: Aggressive buying pressure.
LVL 2 allows us to identify where buyers are sitting at providing us a "floor" (support) and where sellers are sitting at providing us a "wall" (resistance).
Using LVL2 and the tape with the supply and demand strategy allows us to have confluence in our S&D zones.
Using LVL2 and the tape with the supply and demand strategy allows us to have confluence in our S&D zones.
When we see BIDS stacking up at our demand zone with little to no sellers on the ASK side, this allows to be confident that buyers are present.
When we see ASK stack up at our supply zone with little to no buyers on the BID side, this allows to be confident sellers are present.
When we see ASK stack up at our supply zone with little to no buyers on the BID side, this allows to be confident sellers are present.
When watching the tape it is important to see the orders on the LVL2 get FILLED. If you see the orders on the LVL keep disappearing this could mean it's not true order and instead a flashing order.
Let's go over two important LVL2/T&S tips..
Let's go over two important LVL2/T&S tips..
FLASHING ORDER
A flashing order is when there is a big buyer/seller on the LVL2 and before their price gets tested, they remove their order.
They do this because they want to scare traders like you, if someone sees a big order on the opposing side they will panic and sell.
A flashing order is when there is a big buyer/seller on the LVL2 and before their price gets tested, they remove their order.
They do this because they want to scare traders like you, if someone sees a big order on the opposing side they will panic and sell.
HIDDEN BUYERS/SELLERS
Ever wonder why a stock can't get past a certain level but there's no sign of sellers on the LVL2/T&S? This is because there's a hidden seller accumulating orders before the move.
Same thing for the opposing side.
Ever wonder why a stock can't get past a certain level but there's no sign of sellers on the LVL2/T&S? This is because there's a hidden seller accumulating orders before the move.
Same thing for the opposing side.
Now that you understand LVL2/T&S and also some key tips.
Let's see this in action. I will be showing an example of $TSLA from last week bouncing off demand and buyers showing up on the LVL2 and filling on the T&S.
Let's see this in action. I will be showing an example of $TSLA from last week bouncing off demand and buyers showing up on the LVL2 and filling on the T&S.
Since you should know how to properly draw zones, and how zones flip when broken.
In this case we have a TSLA zone from $837.3-$844.85. We also had a previous demand, now supply because it broke, from $856.63-$864.69.
In this case we have a TSLA zone from $837.3-$844.85. We also had a previous demand, now supply because it broke, from $856.63-$864.69.
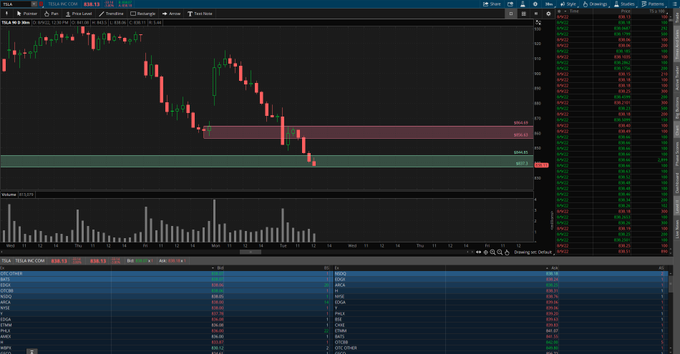
We open, break through our demand (flips to supply), reject EXACTLY from it, and move down towards our demand at $837.3.
If you take a look at the LVL2, buyers are present on the BID, 2000 orders at 838.06, 1400 orders at 838, & 2200 orders at 836.
The ask has nothing.
If you take a look at the LVL2, buyers are present on the BID, 2000 orders at 838.06, 1400 orders at 838, & 2200 orders at 836.
The ask has nothing.
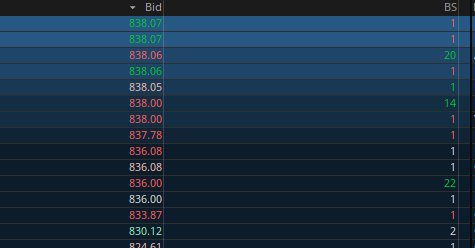
On the tape you're also seeing some orders come in at the ASK. Which as mentioned shows strong buying pressure.
Orders fill, we bounce exactly from our demand zone and move back to test our supply zone.
Now the scenario flips....
Orders fill, we bounce exactly from our demand zone and move back to test our supply zone.
Now the scenario flips....

Now that we're at supply, buyers are no longer present defending their move up, and sellers show up on the LVL2. Look at the difference between the BID and the ASK on the LVL2.
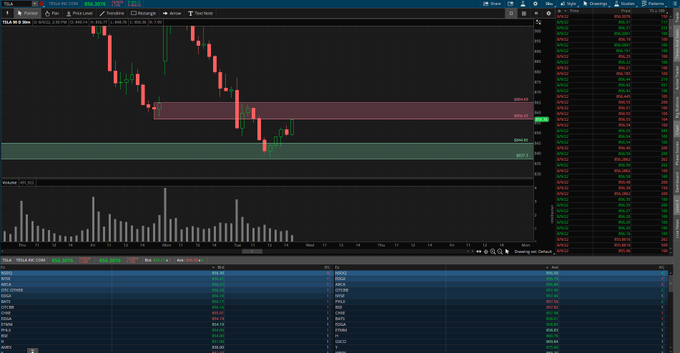
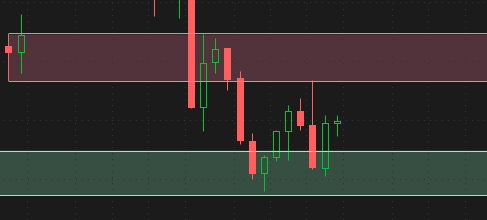
You already know what happens next, we were at supply, sellers took control and brought it back down to our demand (look at the wick), buyers took control, orders got filled, brought the price back up.
Reading the tape will not be easy at first, it moves fast and you will have to train your eyes to catch the big orders, but just like everything, it takes time and once you have it down you will become a beast. Put LVL2 and S&D together and you have yourself an amazing system!
L7: RISK/TRADE MANAGEMENT 🌟
In this lesson we will be going over..
- Truth About Stop Losses
- Position Sizing
- Trimming Profits At 10%
- Having A Set Of Rules
In this lesson we will be going over..
- Truth About Stop Losses
- Position Sizing
- Trimming Profits At 10%
- Having A Set Of Rules
THE TRUTH ABOUT STOP LOSSES
Most people tend to have a hard stop loss on their option contract, get stopped out, and then get mad when the position goes their way.
Your stop loss should be based off the CHART not the contract. This allows you get stopped out when the setup...
Most people tend to have a hard stop loss on their option contract, get stopped out, and then get mad when the position goes their way.
Your stop loss should be based off the CHART not the contract. This allows you get stopped out when the setup...
invalidates and not when you turn red on your position.
Something very important correlates with this and that is your POSITION SIZING. You should be properly sized to see your position see your stop loss on the chart and not your contract.
Tip: Size for 0.
Something very important correlates with this and that is your POSITION SIZING. You should be properly sized to see your position see your stop loss on the chart and not your contract.
Tip: Size for 0.
TRIM PROFITS AT 10%
A lot of traders let their position green positions turn red because they hold for too long. Get in the habit of taking a trim at 10% and having your slightly above or at break even.
This will help you manage risk but also secure some money.
A lot of traders let their position green positions turn red because they hold for too long. Get in the habit of taking a trim at 10% and having your slightly above or at break even.
This will help you manage risk but also secure some money.
HAVE A SET OF RULES
So often I see people trade without a set of rules, and when they do have a set of rules they don't follow them. Why have a set of rules just to break them? Have them written in front of you to remind yourself of them.
Here are some key reminders..
So often I see people trade without a set of rules, and when they do have a set of rules they don't follow them. Why have a set of rules just to break them? Have them written in front of you to remind yourself of them.
Here are some key reminders..
1. Take profit + stop loss + exit is all you need to know and stay focused on. Everything else is NOISE.
2. No setup, no trade. Take trades that follow your system ONLY.
3. Have confidence in your trades. Even if you're a beginner, you will never learn if you don't make mistakes.
2. No setup, no trade. Take trades that follow your system ONLY.
3. Have confidence in your trades. Even if you're a beginner, you will never learn if you don't make mistakes.
L8: PSYCHOLOGY 🌟
To end of this master thread... In this lesson we will be going over..
- Psychology Mistakes You Should Avoid
- Tips To Stop These Emotions In Trading
- How To Control Your Emotions
To end of this master thread... In this lesson we will be going over..
- Psychology Mistakes You Should Avoid
- Tips To Stop These Emotions In Trading
- How To Control Your Emotions
PSYCHOLOGY MISTAKES YOU SHOULD AVOID
1. Moving your PT out of greed
2. Chasing market moves out of FOMO
3. Overtrading out of emotions/anger to make up for losses or mistakes
4. Thinking you can outsmart the market because of 1-2 good plays
5. Focusing energy on the wrong things
1. Moving your PT out of greed
2. Chasing market moves out of FOMO
3. Overtrading out of emotions/anger to make up for losses or mistakes
4. Thinking you can outsmart the market because of 1-2 good plays
5. Focusing energy on the wrong things
TIPS TO STOP THESE EMOTIONS IN TRADING
1. Move stop to break even once you are at or above 10% profit to ensure a green trade.
2. Take a break. One day, 0 trades, will give you a clear conscious.
3. Put your rules in front of you to keep them in your sights while you trade.
1. Move stop to break even once you are at or above 10% profit to ensure a green trade.
2. Take a break. One day, 0 trades, will give you a clear conscious.
3. Put your rules in front of you to keep them in your sights while you trade.
HOW TO CONTROL YOUR EMOTIONS
1. Identify roots of the problem. Uncover the hidden flaws.
2. Map The Pattern. Identify your overall view of emotional activity.
3. Correct the problem. This is where you tackle the problem.
4. Repeat.
1. Identify roots of the problem. Uncover the hidden flaws.
2. Map The Pattern. Identify your overall view of emotional activity.
3. Correct the problem. This is where you tackle the problem.
4. Repeat.
That is it for this MASTER thread. If you found value in this in any way, please make sure to ❤ & ♻ to show love and help others that could use this thread find it.
I love you all. #ConsistentCrusaders ❤
I love you all. #ConsistentCrusaders ❤
Loading suggestions...