

Mechanical traders make most of the money in the market.
A trader turned 3 lakh to 1.5 crore in 3 years buying options by doing mechanical trading
Here is 7 trading free indicators to help you do mechanical trading ( including his )
A 🧵
#StockMarket #trading #nifty50
A trader turned 3 lakh to 1.5 crore in 3 years buying options by doing mechanical trading
Here is 7 trading free indicators to help you do mechanical trading ( including his )
A 🧵
#StockMarket #trading #nifty50
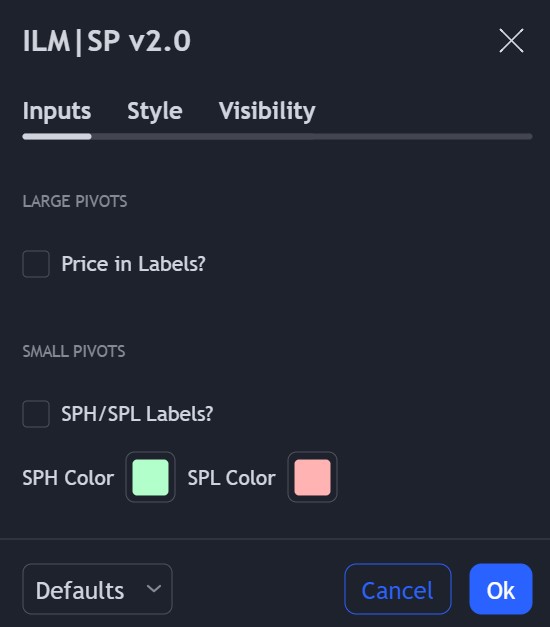
1/7 Structural Pivot indicator
This indicators helps you plot structural pivot as taught by @madan_kumar .
Here is the screenshot
This indicators helps you plot structural pivot as taught by @madan_kumar .
Here is the screenshot
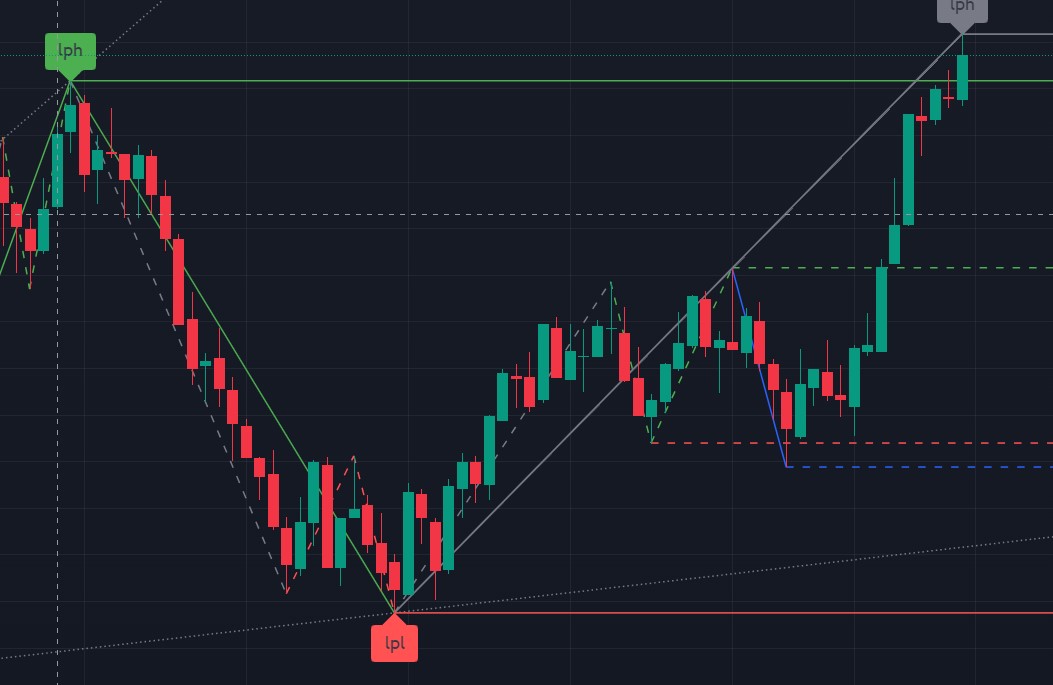
1/7 How to use this indicator
If you know a little about this indicator, this helps you plot Major Pivot Low/High
Only take a trade when MPL/MPH gets broken.
MPL and MPH are marked as lpl and lph in the indicator
If you know a little about this indicator, this helps you plot Major Pivot Low/High
Only take a trade when MPL/MPH gets broken.
MPL and MPH are marked as lpl and lph in the indicator
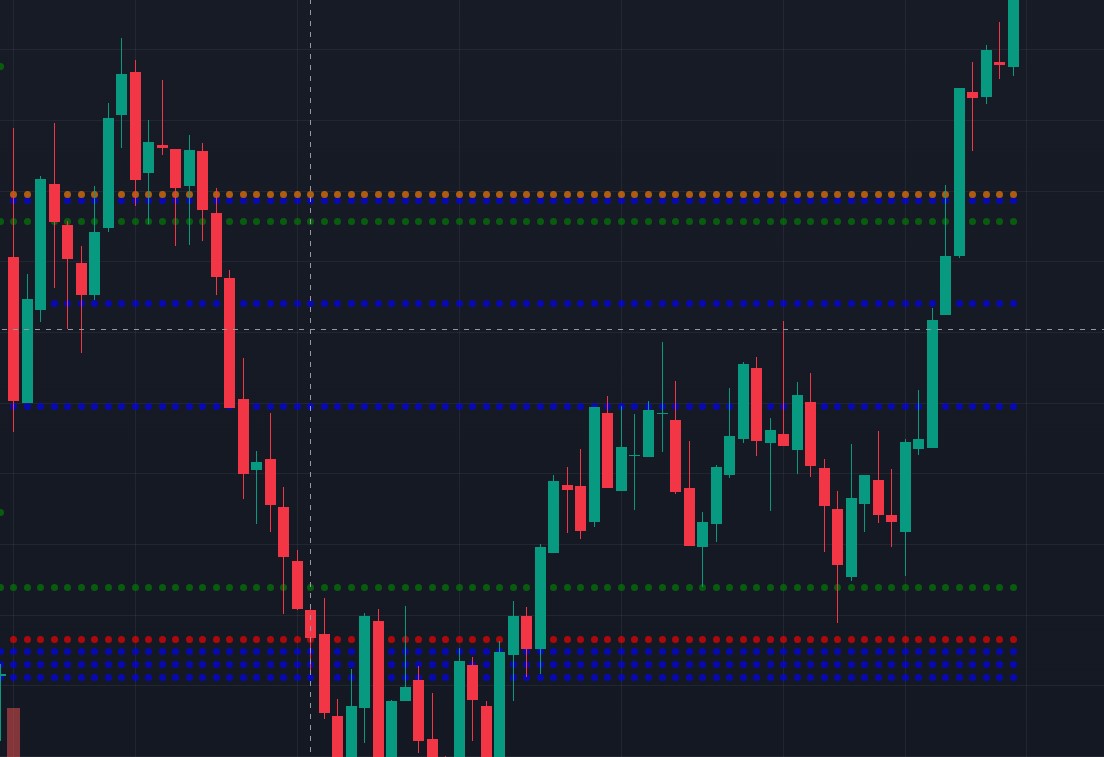
2/7 CPR by KGS indicator
If you are somebody who loves pivot point , then you will love this indicator.
Here is the screenshot
If you are somebody who loves pivot point , then you will love this indicator.
Here is the screenshot
2/7 How to use
This indicator is used to trade breakout and failed breakout of pivots.
Here is how it looks on the chart
This indicator is used to trade breakout and failed breakout of pivots.
Here is how it looks on the chart
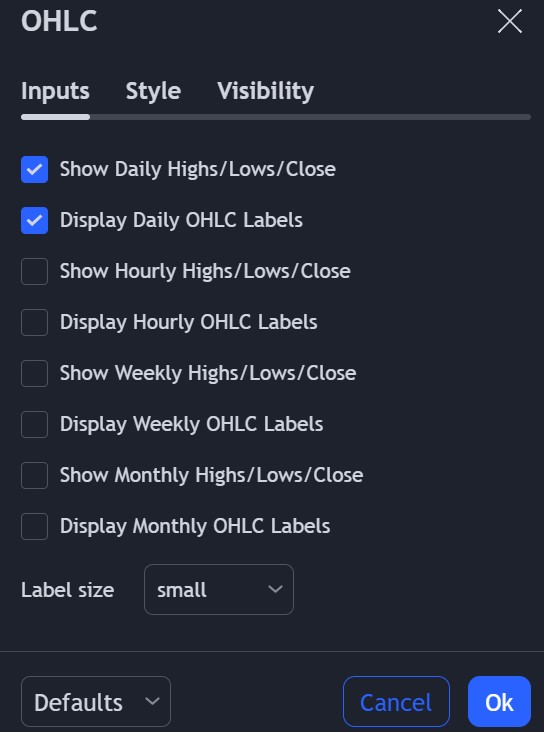
3/7 Daily OHLC indicator
PDH, PDL, day open, previous day close - these are very powerful support and resistance.
If you struggle to mark these indicators manually, you will love it.
PDH, PDL, day open, previous day close - these are very powerful support and resistance.
If you struggle to mark these indicators manually, you will love it.
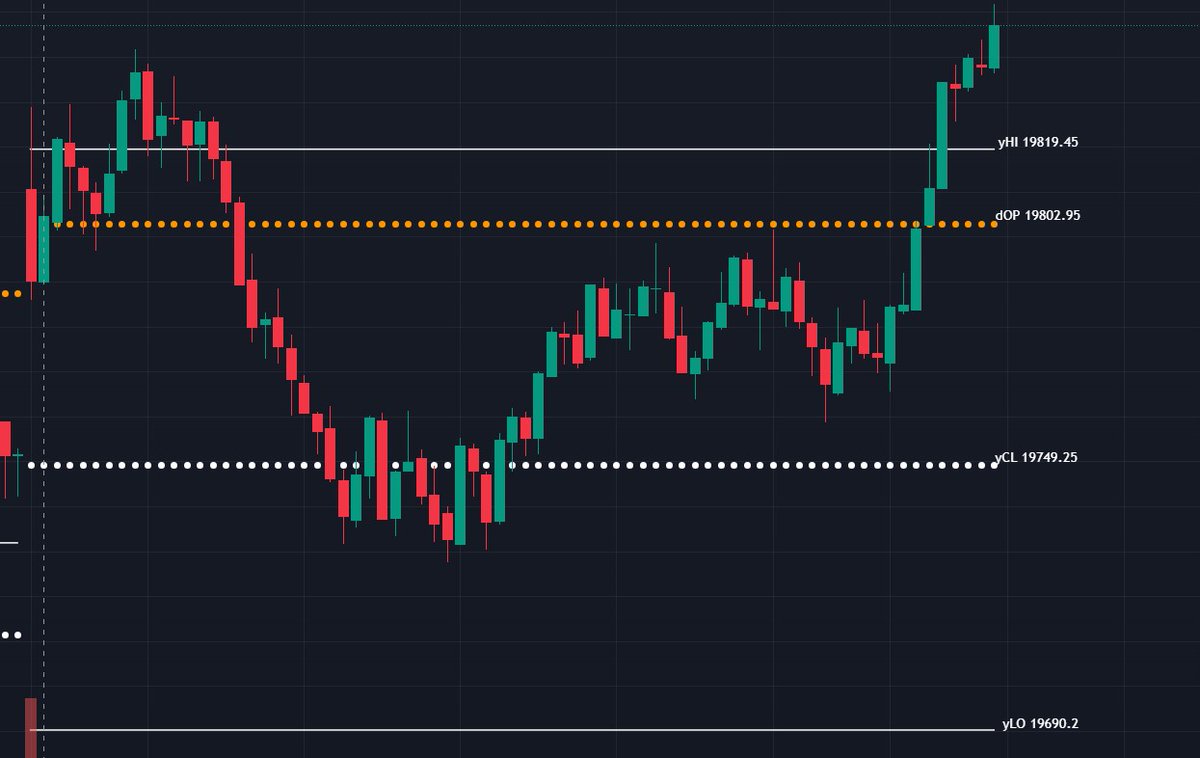
3/7 How to use it
Again these levels can be used to trade breakout and breakout failure.
Here is how it looks on the chart
Again these levels can be used to trade breakout and breakout failure.
Here is how it looks on the chart

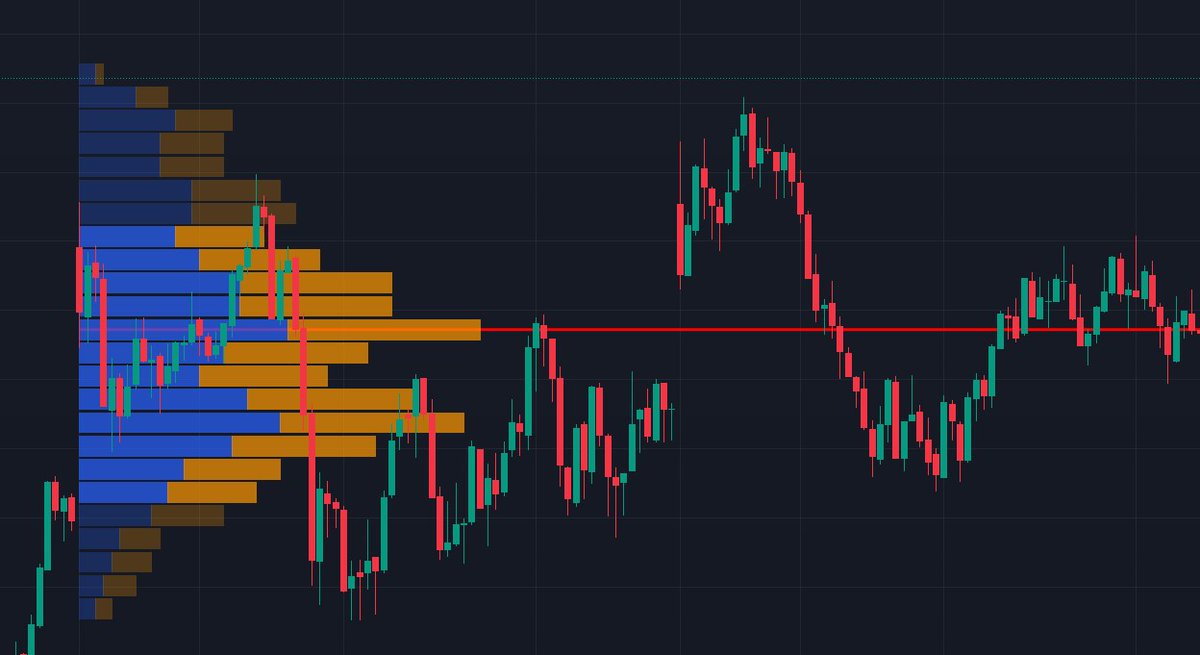
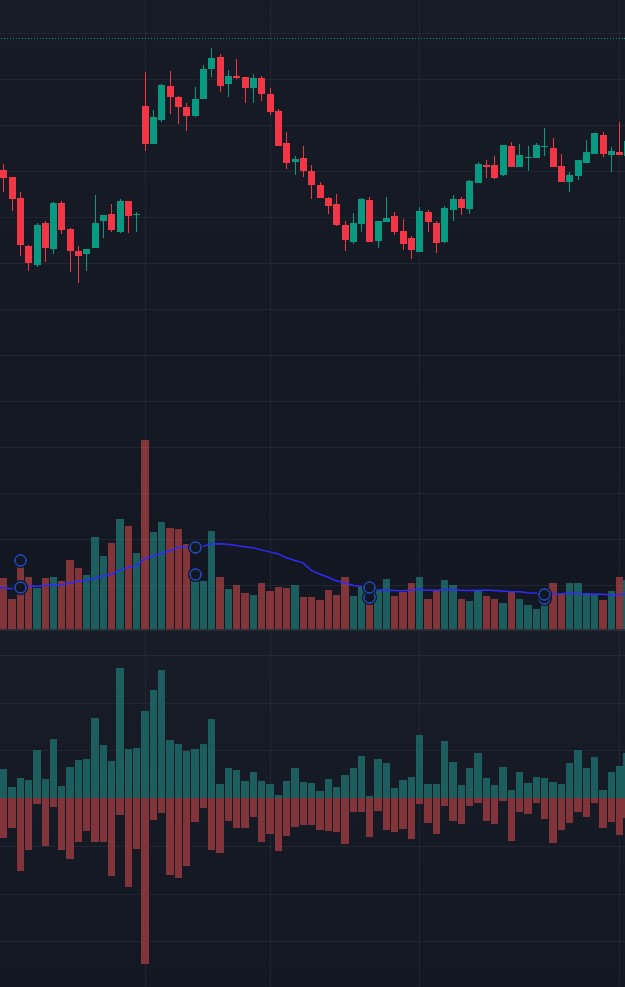
4/7 Volume Profile Indicators
This indicator plot volume profile for free which is a paid indicator in trading view.
Here is how it looks
This indicator plot volume profile for free which is a paid indicator in trading view.
Here is how it looks
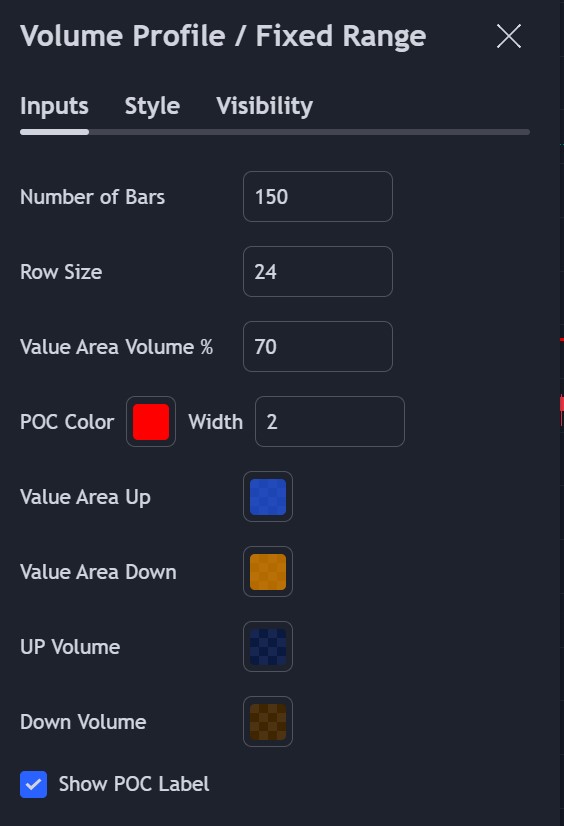
4/7 How to use it
Volume profile is in itself a whole subject, focus on areas where there is very least profile and the most profile.
POC acts as area which has equilibrium,
Always trade when market is away from POC
Volume profile is in itself a whole subject, focus on areas where there is very least profile and the most profile.
POC acts as area which has equilibrium,
Always trade when market is away from POC
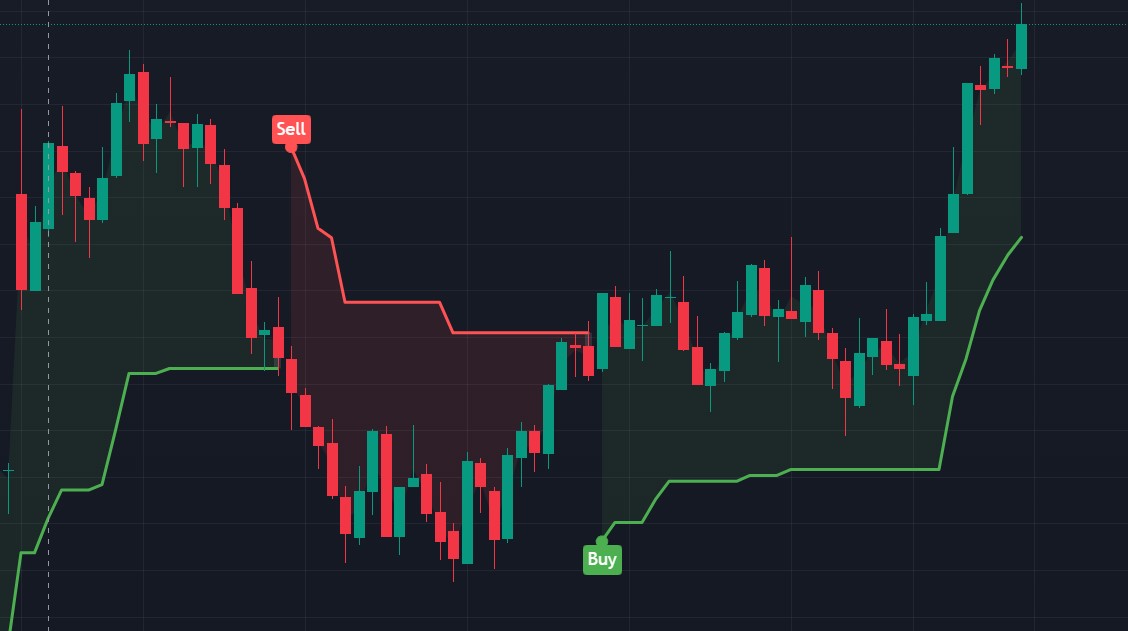
5/7 Supertrend Indicator
Many traders use supertrend indicator as it is mostly free on most of the platform.
But this indicator is something different.
Tell us why?
Many traders use supertrend indicator as it is mostly free on most of the platform.
But this indicator is something different.
Tell us why?
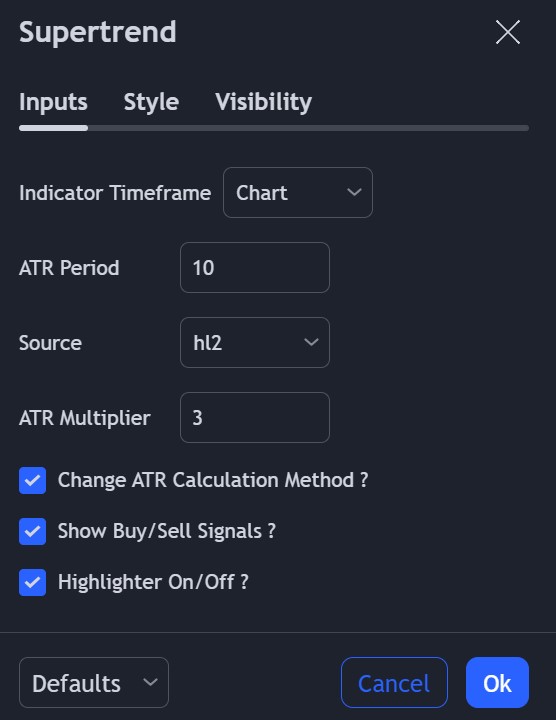
5/7 How to use
This indicator should be used for options selling only.
But many use it for buying only.
For selling, use the marked line as support and resistance and sell the strike price above and below that area
This indicator should be used for options selling only.
But many use it for buying only.
For selling, use the marked line as support and resistance and sell the strike price above and below that area
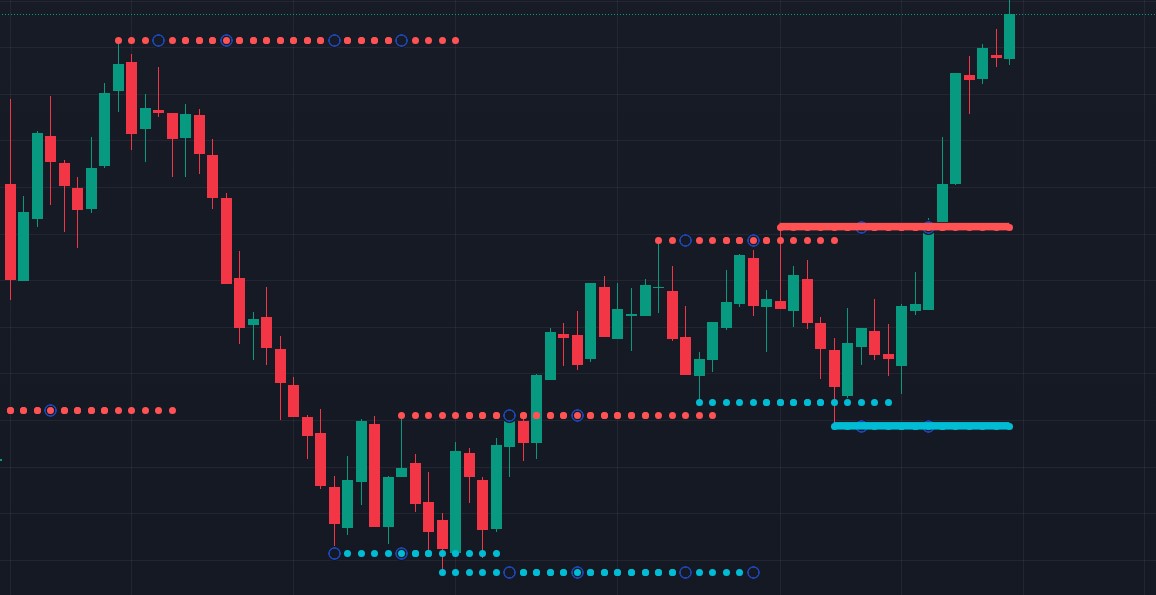
6/7 The swing indicator
This indicator plots swing high and low
This indicator plots swing high and low
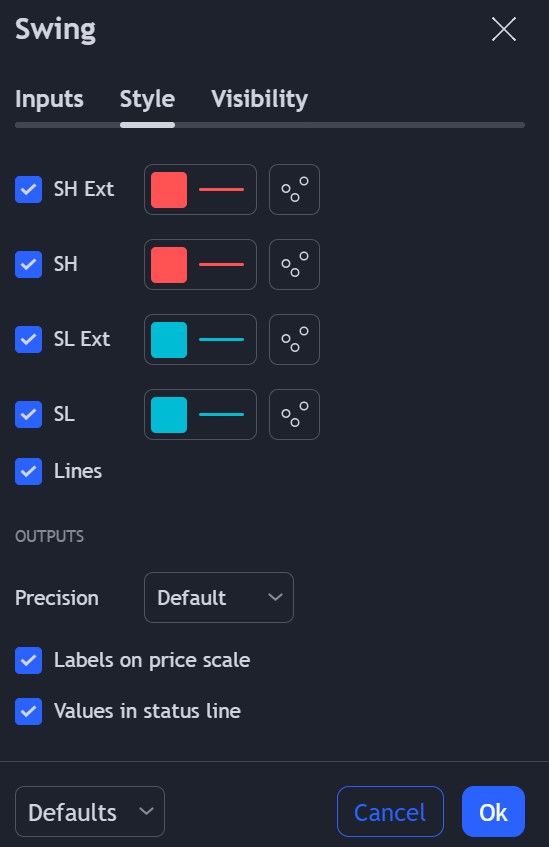
6/7 How to use
You can use it trade breakouts and fakeouts.
Most important indicator above all, as most trader use it
You can use it trade breakouts and fakeouts.
Most important indicator above all, as most trader use it
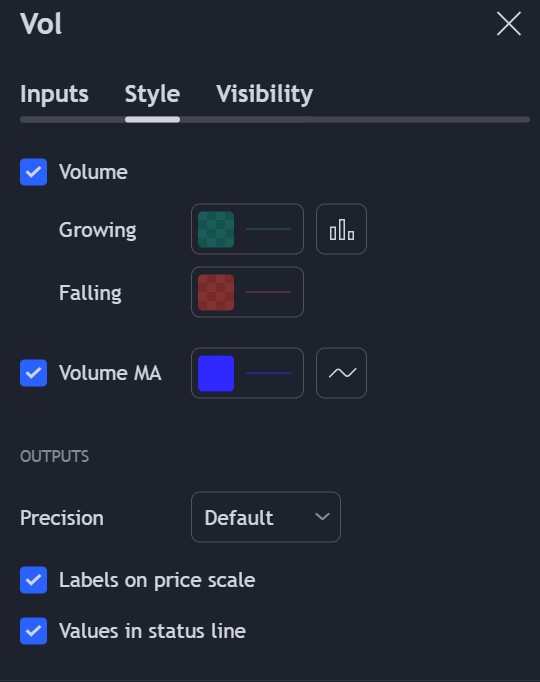
7/7 Up and down volume indicator
This indicator is very powerful
It tells the story inside a volume bar. Basically it separates +vol and -vol inside the vol bar.
This indicator is very powerful
It tells the story inside a volume bar. Basically it separates +vol and -vol inside the vol bar.
7/7 How to use
It can be used to find out divergences.
Can help you to find exhaustion move in a trending market.
Comment below if you want to know how
It can be used to find out divergences.
Can help you to find exhaustion move in a trending market.
Comment below if you want to know how
We keep posting such content for the Stock Market.
If you liked the thread Please follow @RupeezyOfficial
Like and retweet the first tweet for max reach.
If you liked the thread Please follow @RupeezyOfficial
Like and retweet the first tweet for max reach.

Loading suggestions...