

Positional analysis on Nifty. These are just pointers from charts and indicators which should be kept in mind for the rest of this March expiry
Negative divergence on RSI and MFI
Volatility divergence on Bollinger Bands
MACD is sell signal, raw MACD line sloping down
Volatility divergence on Bollinger Bands
MACD is sell signal, raw MACD line sloping down
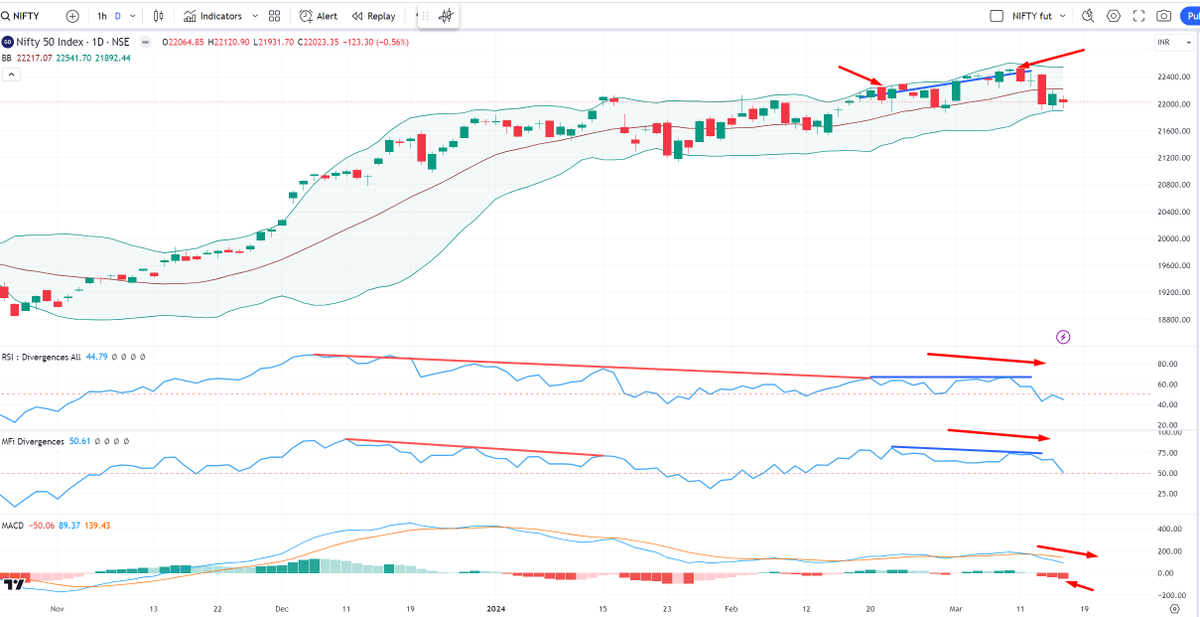
Breakdown of trendlines on price supported by breakdown on trendlines of RSI and MFI.

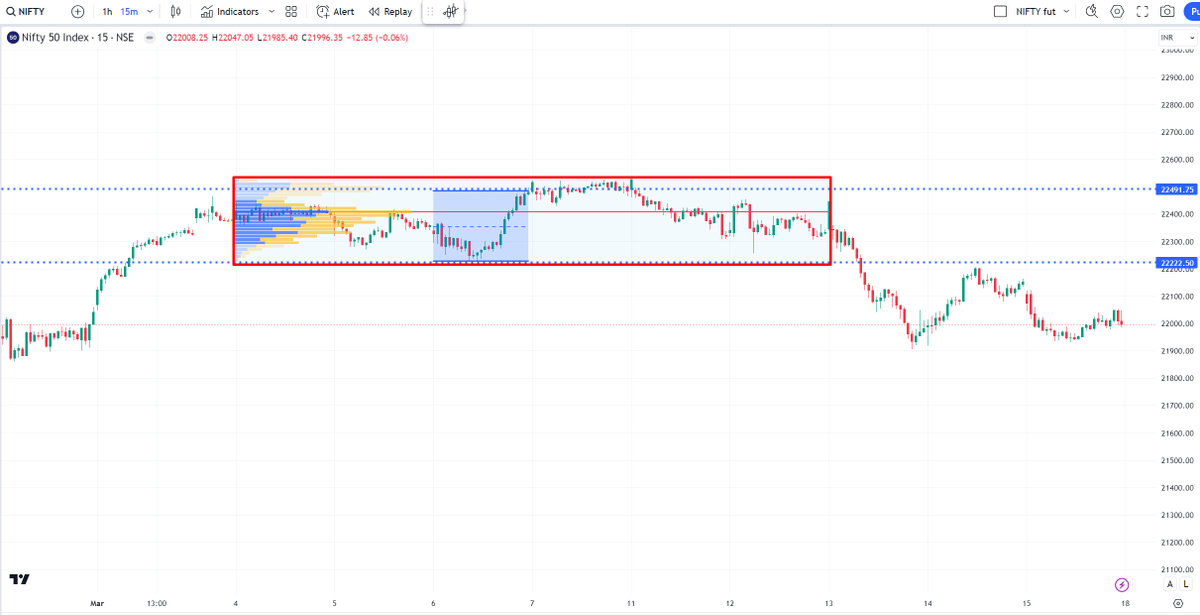
On lower timeframe data ( 15mins) 22200-22500 seems to be the distribution zone. Smartest selling on 6th March 2024.
20200-20300 levels now strong resistance zone.
Any bullish view only after Nifty can close above 22500 for two consecutive days
20200-20300 levels now strong resistance zone.
Any bullish view only after Nifty can close above 22500 for two consecutive days
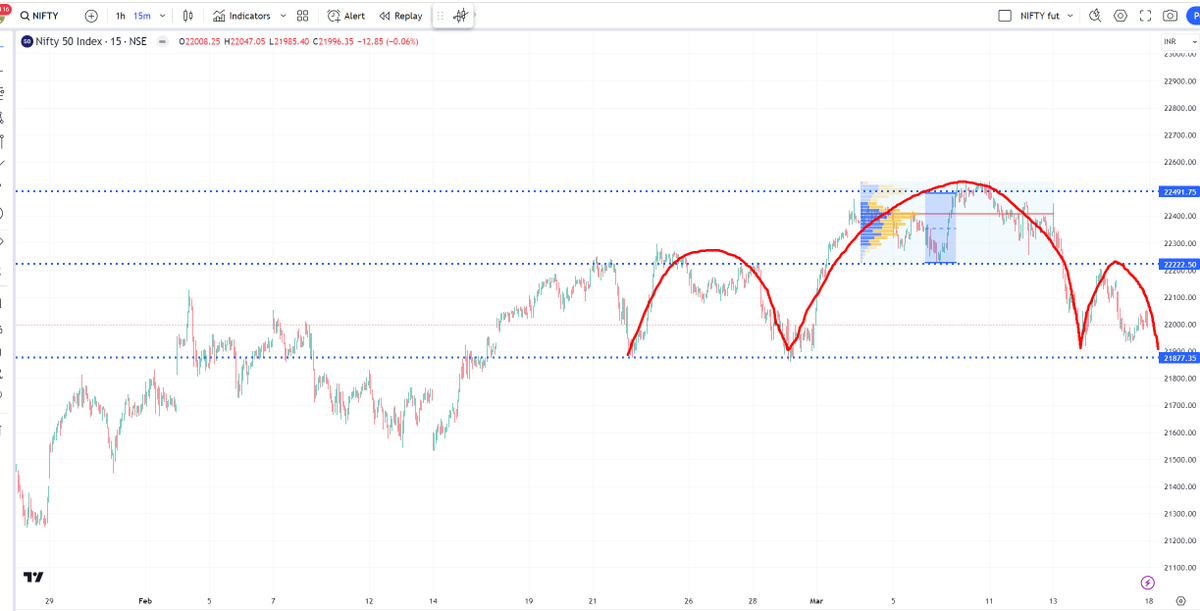
Also shows a head and shoulders on 15min data supporting the EOD bearish view.
Standard breakdown and targeting as per H&S pattern apply.
What you do with this data is your choice, I just posted what I as seeing.
Standard breakdown and targeting as per H&S pattern apply.
What you do with this data is your choice, I just posted what I as seeing.
Typo. Read 22200-22300 as resistance
On Nifty monthly chain. 22000-22300 strikes saw OI buildup where calls sold outnumbers puts sold on this strike by a large margin, so strong bearish pressure from this zone.
22000pe now has the highest OI on the PE side on monthly strikes.
What strikes is the liquidation of the 21700pe, that's the unusual action
22000pe now has the highest OI on the PE side on monthly strikes.
What strikes is the liquidation of the 21700pe, that's the unusual action
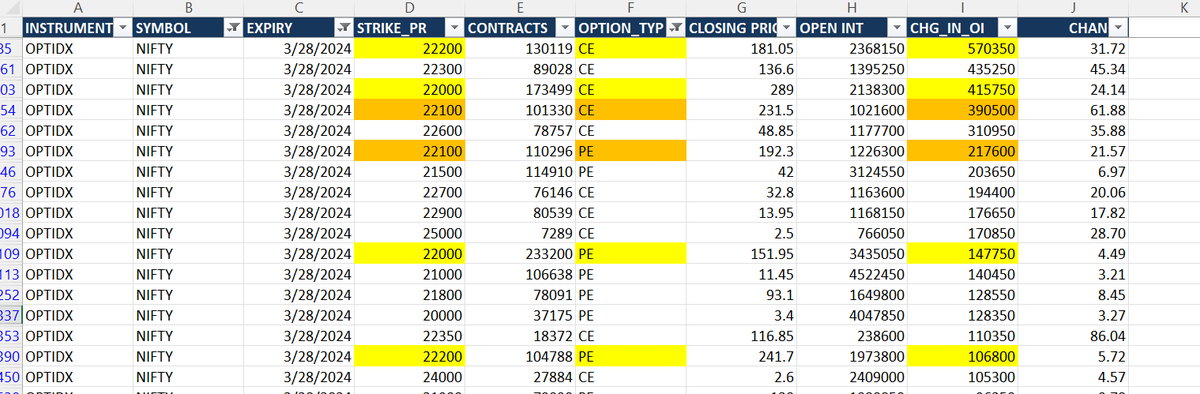
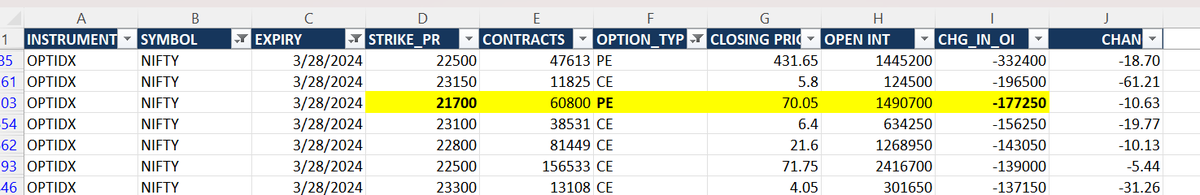
So we will now watch these two strikes.
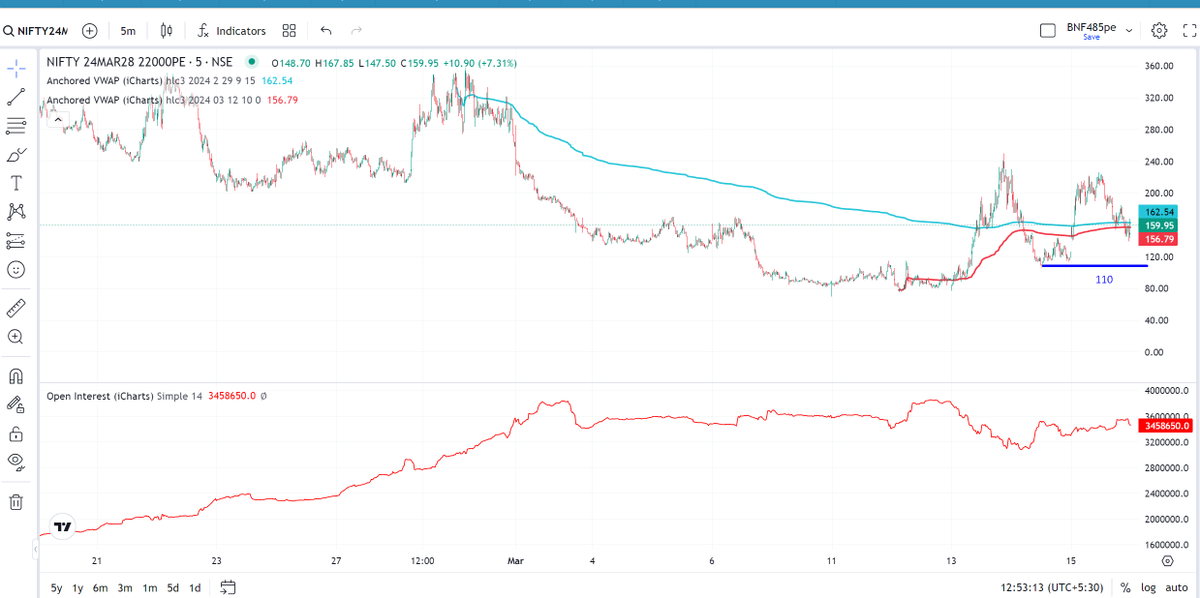
Nifty to be under bearish pressure till 22k PE trades above 110.
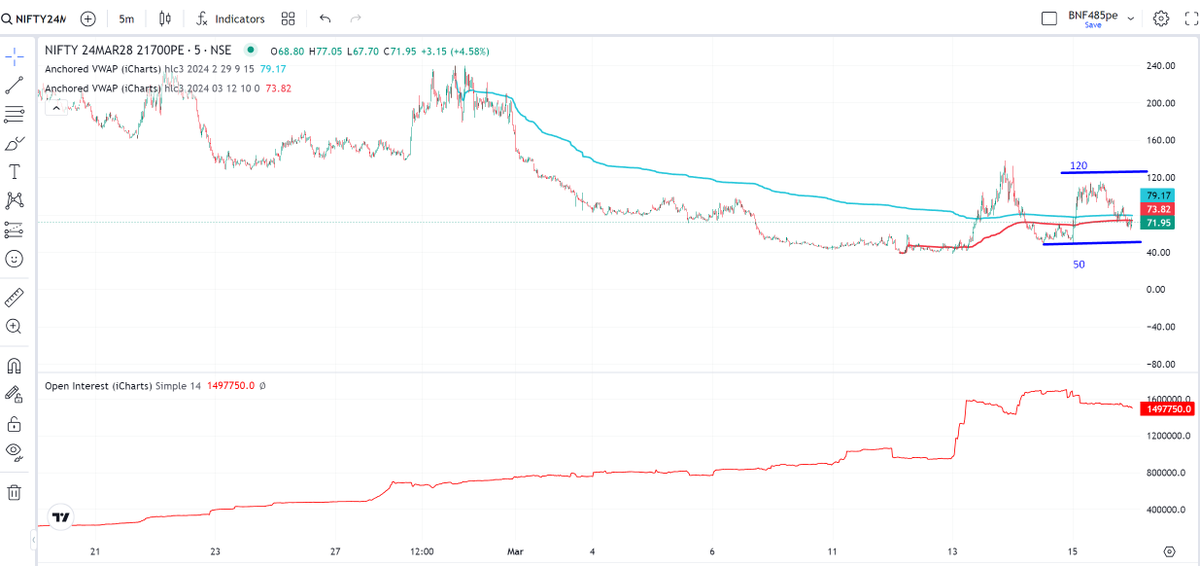
Strong bearish move to resume if 21700pe trades above 120.
If 21700pe breaks 50 and 22000pe breaks 110, expect small bounce
Nifty to be under bearish pressure till 22k PE trades above 110.
Strong bearish move to resume if 21700pe trades above 120.
If 21700pe breaks 50 and 22000pe breaks 110, expect small bounce
Loading suggestions...