

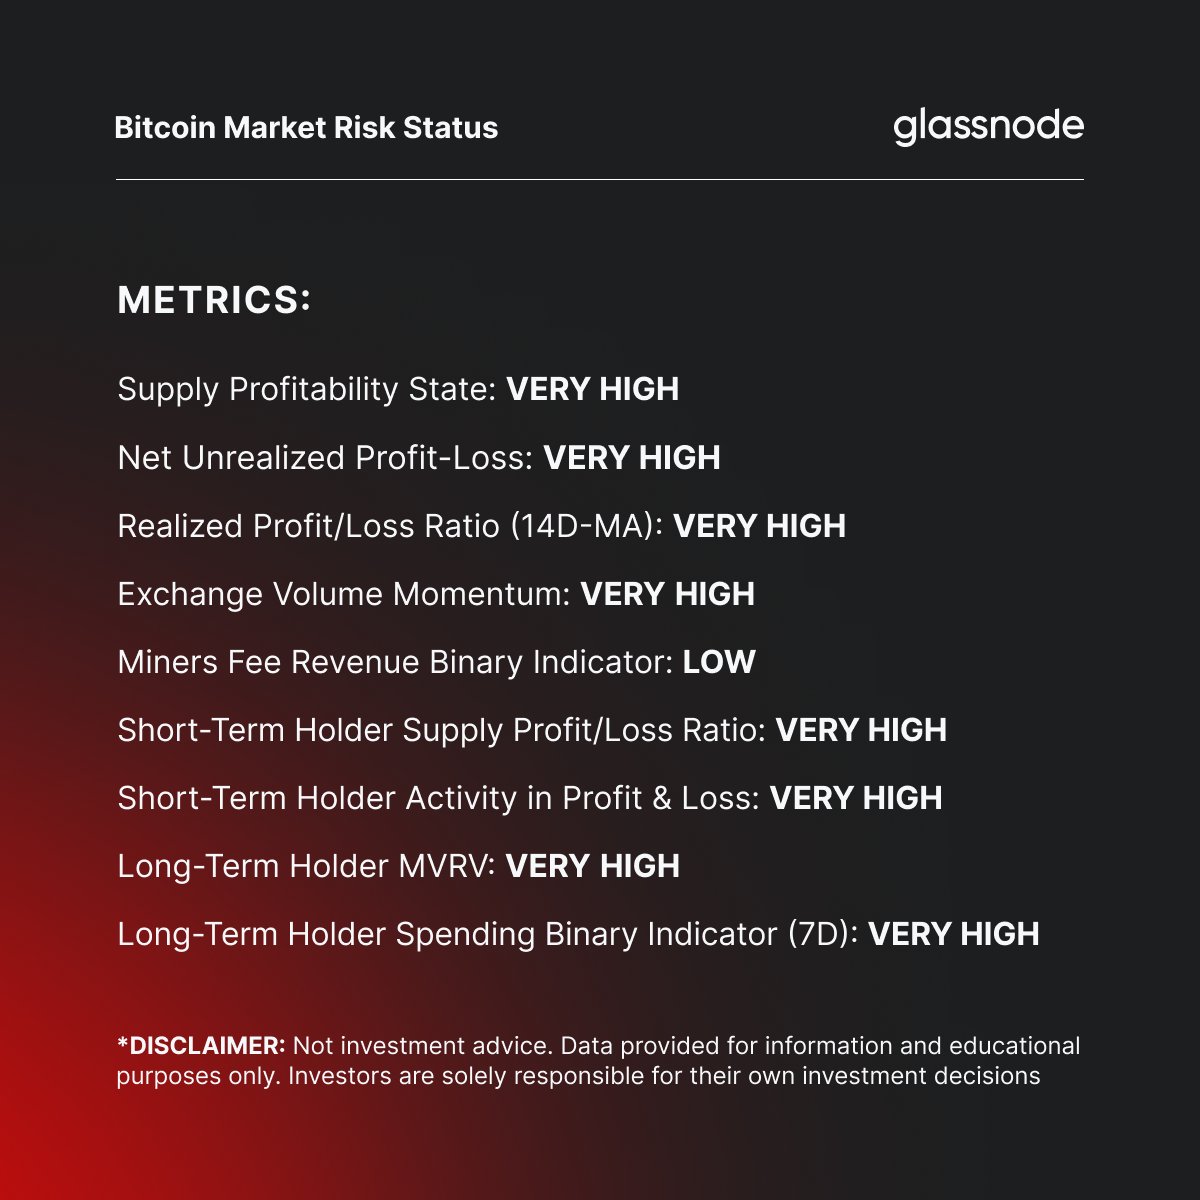
In this thread, we're offering a status update on our #Bitcoin Risk Assessment Framework, a tool for discretionary traders to gauge market sentiment and underlying risk. 🧵👇

MVRV and Mayer Multiple Pricing Models:
This indicator monitors the deviation of price from two long-term mean reversion baselines:
MVRV Model🟠: This model measures the ratio between the spot price and the overall cost-basis of the market (Realized Price).
Mayer Multiple🔵: Leveraging the 200D-SMA as a technical cyclical mid-line, measuring the premium or discount relative to this baseline.
For the past 12 days, the indicator signalled Very High Risk 🟥, where the price is above both models (MVRV > 1 and MM >1), and the Mayer Multiple is trading two standard deviations higher than its cumulative mean (MM > +2 STD).

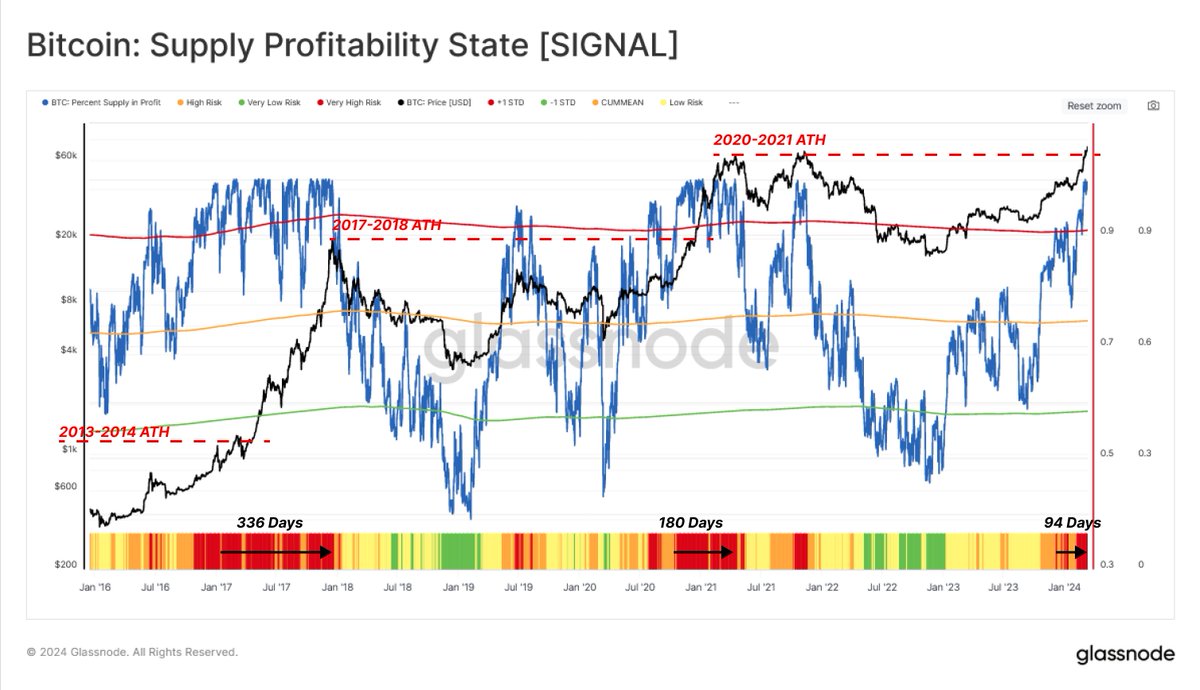
Supply Profitability State:
The Percent of Supply in Profit (PSIP)🔵metric measures the proportion of coins with a cost-basis lower than the current spot price. This indicator can help identify the potential risk of increased selling pressure as investors see a growing incentive to take profits.
Currently trading at 99.3%, this metric is in the Very High Risk 🟥 phase. This structure first appeared 94 days ago in this cycle.
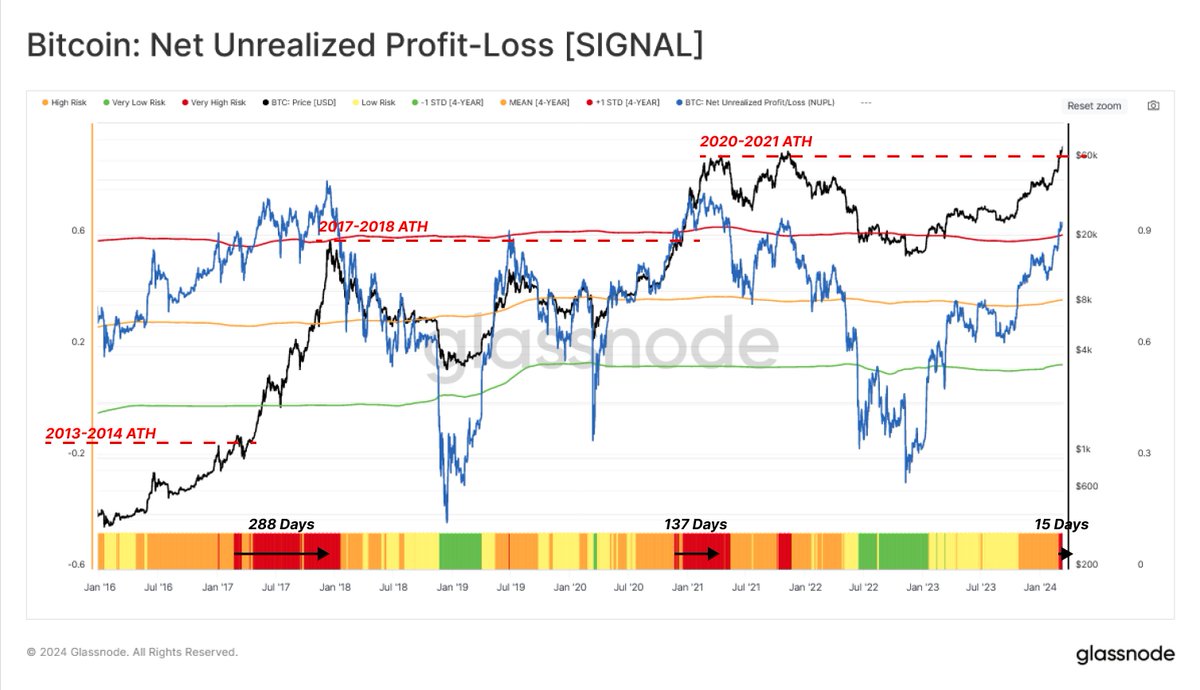
Net Unrealized Profit/Loss (NUPL):
NUPL indicates whether market sentiment leans towards Fear or Greed. With a current value of 0.64, this indicator is above the +1 STD (~0.59) band, showing a Very High Risk 🟥 phase of the market known as Euphoria.
With 15 days since the first day of stepping into this phase, the ongoing Very High Risk is relatively shorter than prior rallies to a new ATH.
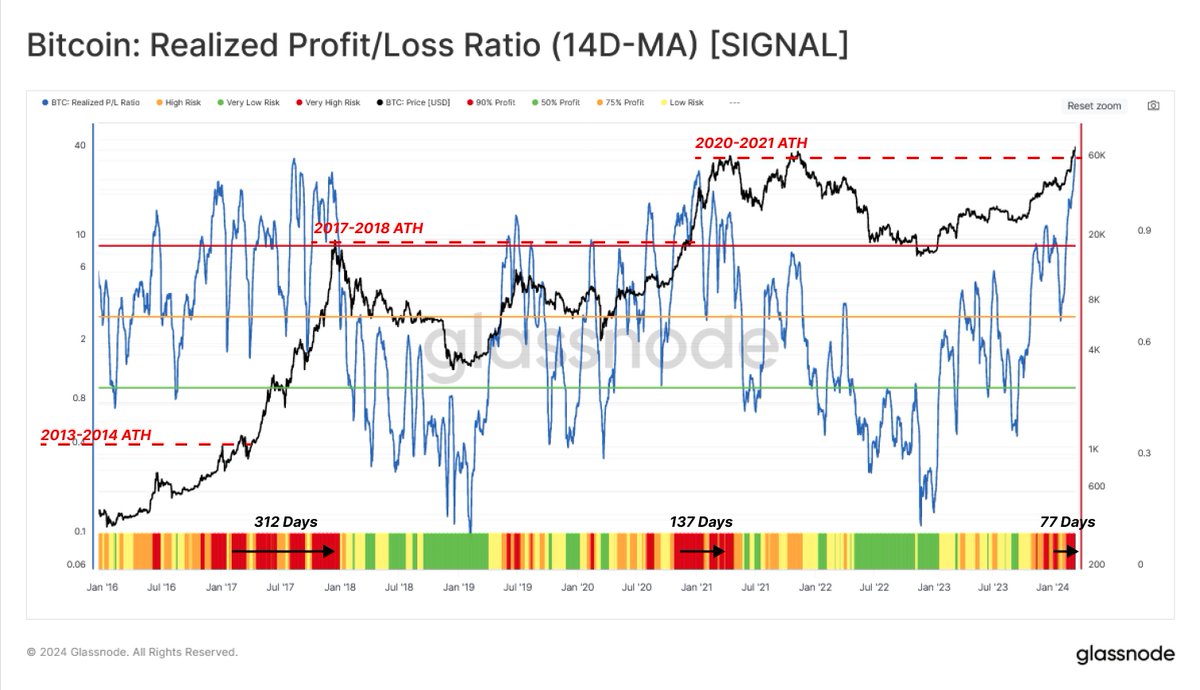
Realized Profit/Loss (RPLR):
RPLR at 41.7, significantly above the very high-risk level of 9, suggests over 97% of BTC moved in profit, pointing to potential market demand exhaustion. Usually, a significant spike into the Very High Risk 🟥 range hints at an increased risk of local tops.
Such structure in former cycles sustained for 137-312 days after breaking above the last ATH. The present equivalent phase has began 77 days ago.
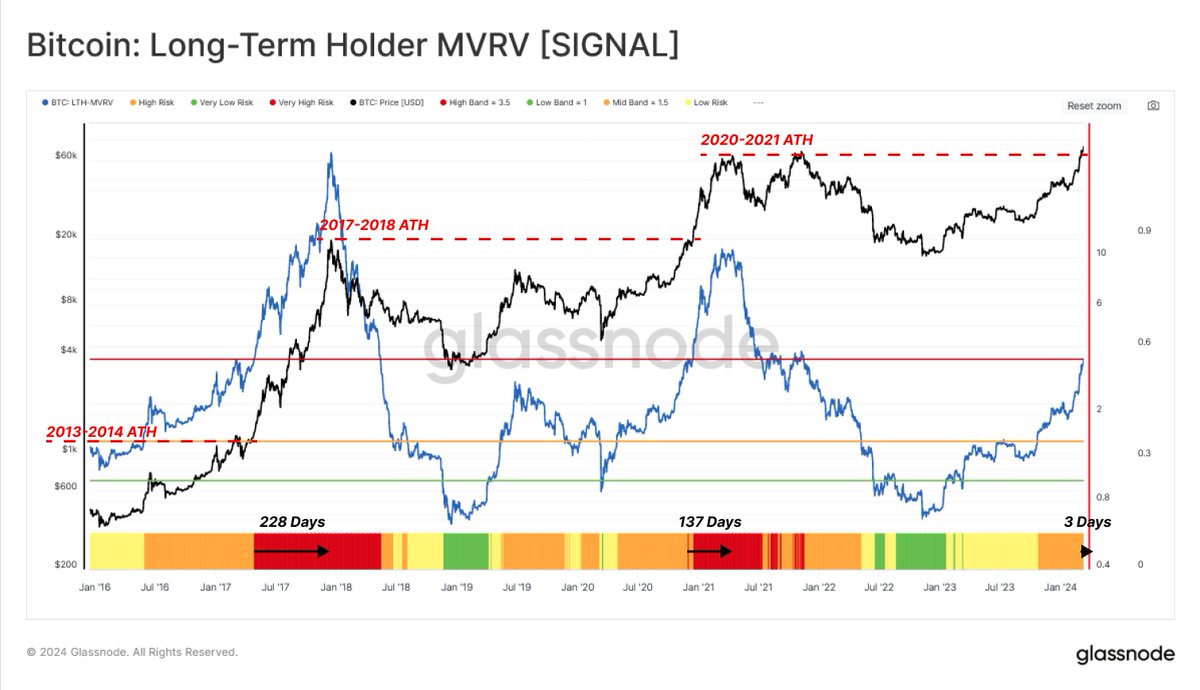
Long-Term Holder MVRV (LTH-MVRV):
LTH-MVRV, or the ratio between price and long-term holders’ cost basis, has recently surged to 3.55, signalling long-term holders stepping into Very High Risk 🟥(LTH-MVRV > 3.5). The recent sharp price expansion has led to a considerable tide of unrealized profit toward diamond hands’ pocket.
LTH-MVRV, or the ratio between price and long-term holders’ cost basis, has recently surged to 3.55, signalling long-term holders stepping into Very High Risk 🟥(LTH-MVRV > 3.5). The recent sharp price expansion has led to a considerable tide of unrealized profit toward diamond hands’ pocket.
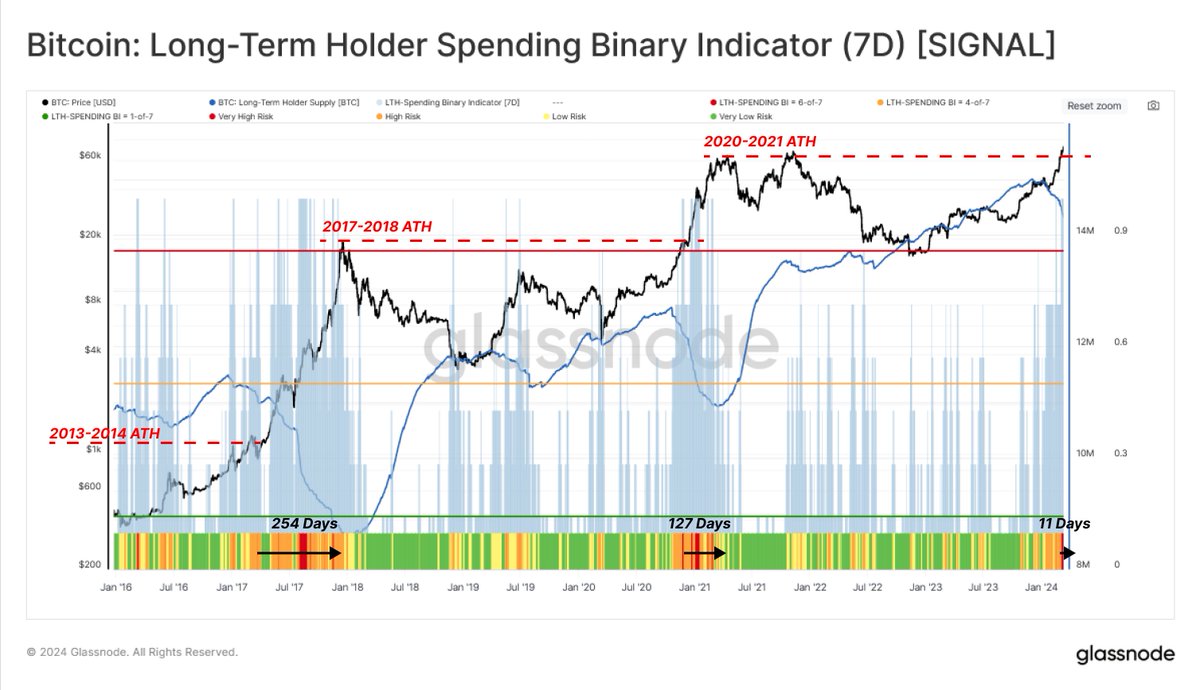
Long-Term Holder Spending Binary Indicator (7D)
In this chart, we built a binary indicator to assess when LTH spending is increasing sustainably. The Long-Term Holder Sending Binary Indicator (LTH-SBI) tracks periods when LTH spending is sufficient to decrease the total LTH Supply over a sustained 7-day period.
The period of Very High Risk 🟥, where the LTH spending rate is heated with the price reaching the last ATH, started 11 days ago.
Explore all the metrics in our Bitcoin Risk Assessment Dashboard. Don't miss out on key insights that could define your next move. Click here for more glassno.de
Loading suggestions...