

Inspired by T's video on daily bias, this indicator aims to develop a higher timeframe bias and collect data on its success rate, specifically focusing on the method that utilizes previous highs and lows
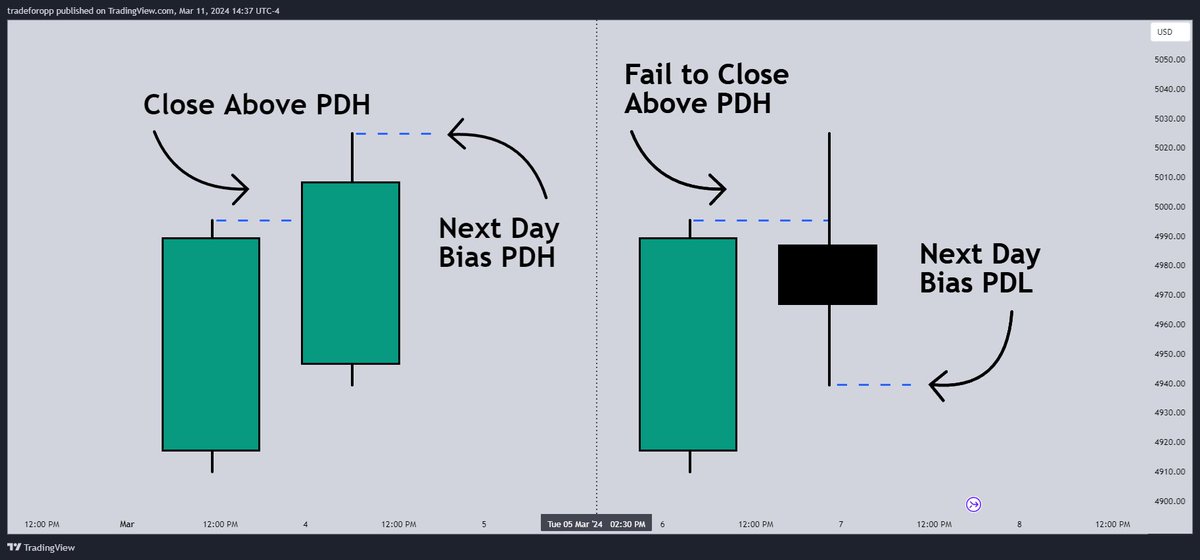
Let's start by outlining our possible scenarios: if price closes above its previous day high (PDH), the following day's bias will target PDH; if price trades above its PDH but closes back below it, the following day's bias will target its previous day low (PDL)
Let's start by outlining our possible scenarios: if price closes above its previous day high (PDH), the following day's bias will target PDH; if price trades above its PDH but closes back below it, the following day's bias will target its previous day low (PDL)
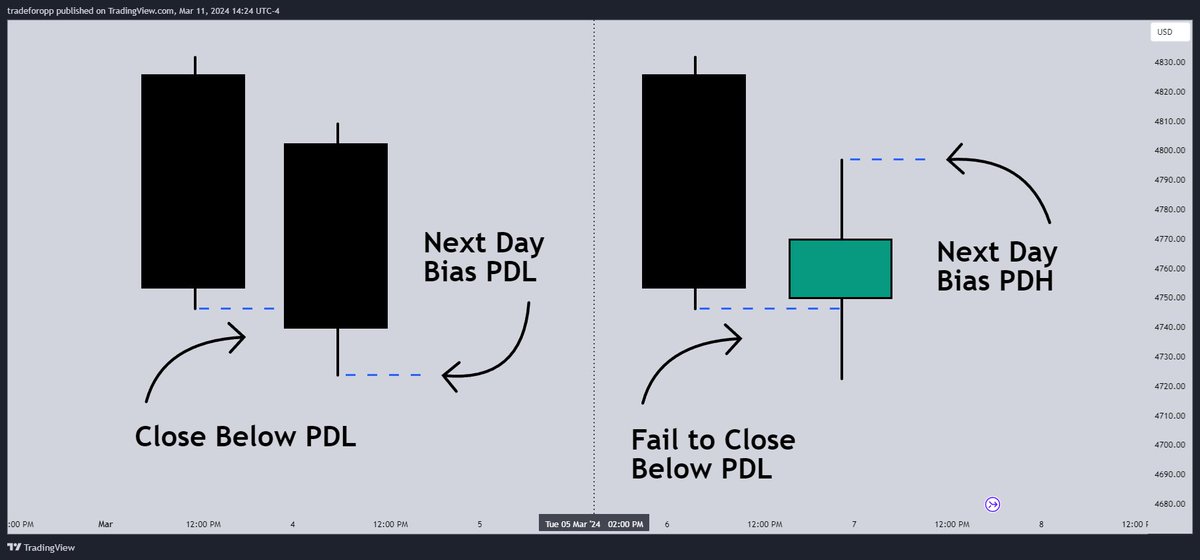
Similarly, if price closes below its PDL, the following day's bias will target PDL
If price trades below its PDL but closes back above it, the following day's bias will target PDH
If price trades below its PDL but closes back above it, the following day's bias will target PDH
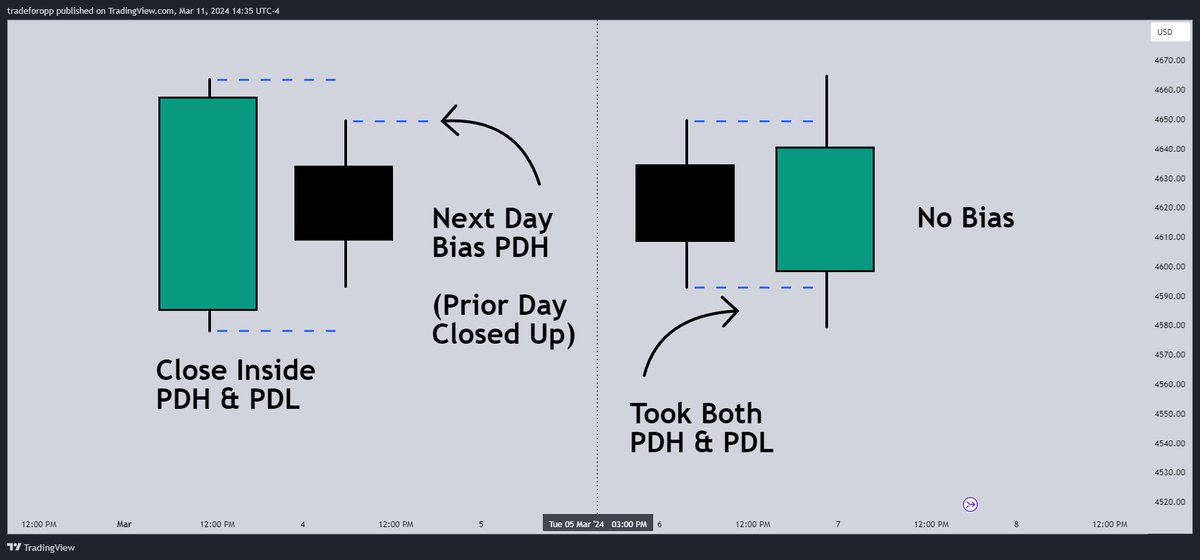
If price trades as an inside bar that doesn't take either PDH or PDL, it will refer to the previous candle for bias. If the previous day closed above its open, it will target PDH and vice versa
If price trades as an outside bar that takes both PDH and PDL, but closes inside that range, no bias is assigned
If price trades as an outside bar that takes both PDH and PDL, but closes inside that range, no bias is assigned
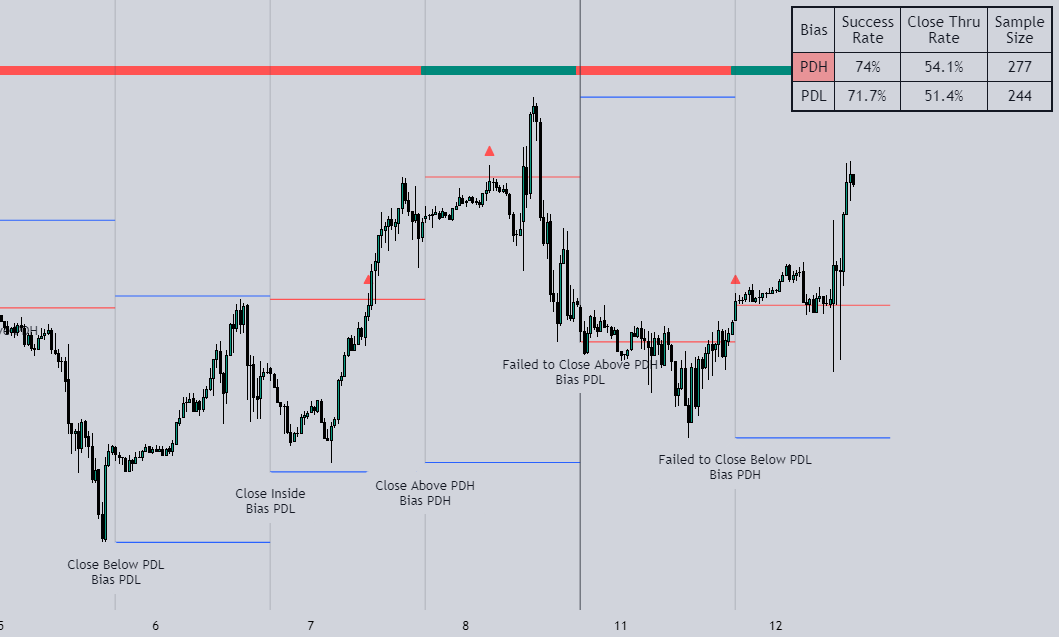
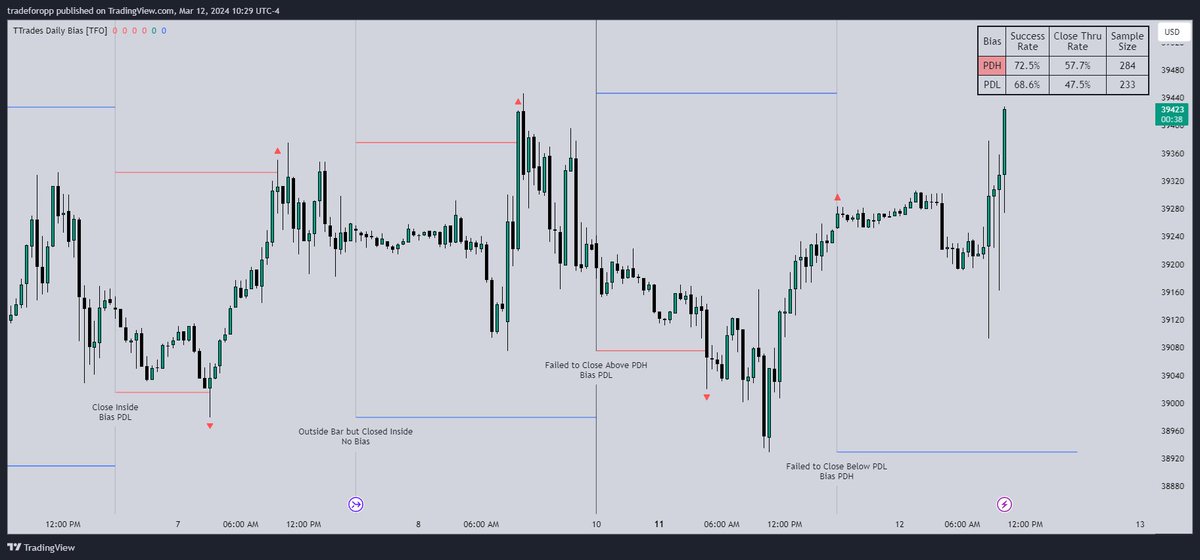
With a rigid framework in place, we can apply it to the charts and observe the results
Each new day starts by drawing out the PDH and PDL levels. They start out as blue and turn red once traded through. This color scheme is also applied to the table in the top right; once a bias is determined, that cell's color starts out as blue and turns red once the level is traded through
Each new day starts by drawing out the PDH and PDL levels. They start out as blue and turn red once traded through. This color scheme is also applied to the table in the top right; once a bias is determined, that cell's color starts out as blue and turns red once the level is traded through
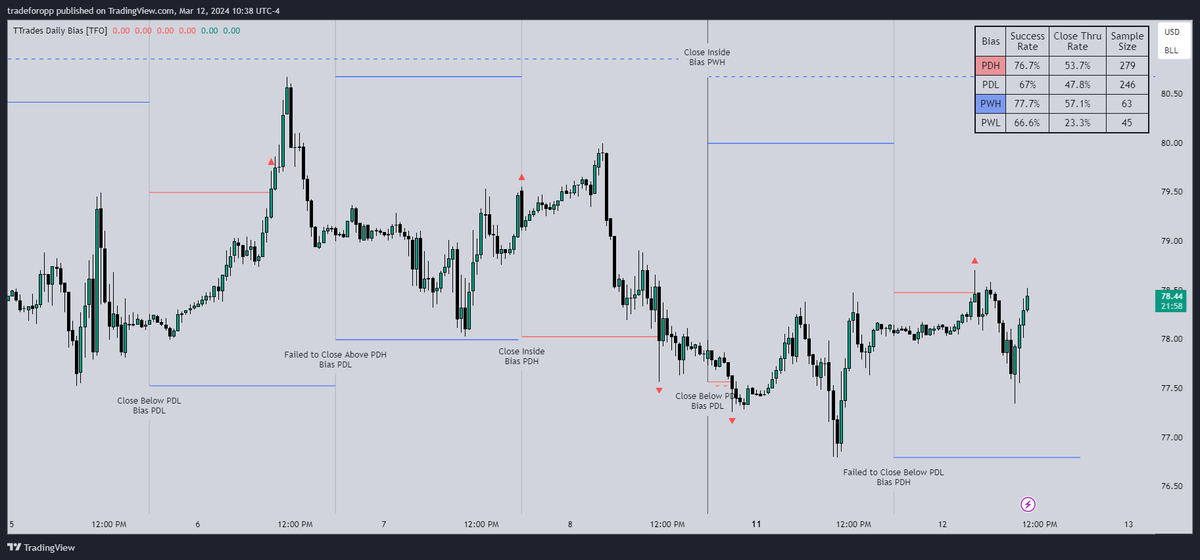
In this CL1! 30m chart, we can glean a lot of information from the table in the top right. First we may note that the "PDH" cell is red, which indicates that the current day's bias was targeting PDH and it has already traded through that level. We might also note that the "PWH" cell is blue, which indicates that the weekly bias is targeting the previous week high (PWH) but price has yet to reach that level
Looking at the "PDH" row of the table, we can see that the sample size indicates that there were 279 instances where the daily bias was assigned as PDH. From this sample size, 76.7% of instances did go on to hit PDH, and only 53.7% of those instances actually went on to close through PDH after hitting that level
Looking at the "PDH" row of the table, we can see that the sample size indicates that there were 279 instances where the daily bias was assigned as PDH. From this sample size, 76.7% of instances did go on to hit PDH, and only 53.7% of those instances actually went on to close through PDH after hitting that level
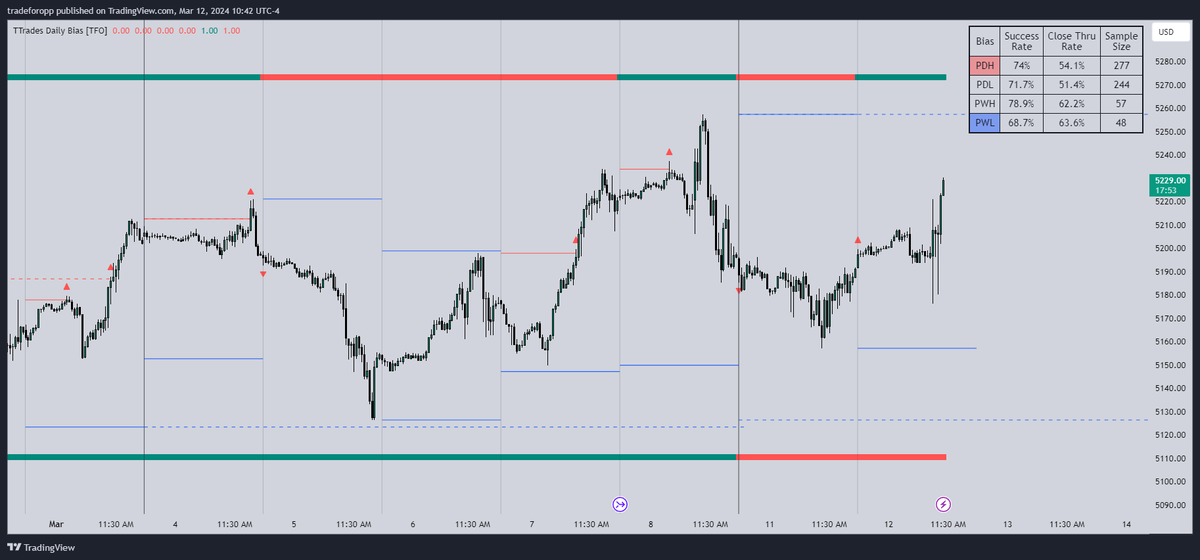
We can also get a quick visual of what the daily and weekly biases currently are by plotting them along the top and bottom of the chart
Here the daily bias is on top and weekly bias is on the bottom, where the default colors of green and red indicate that the bias logic is expecting price to draw towards the given timeframe's previous high or low, respectively
Here the daily bias is on top and weekly bias is on the bottom, where the default colors of green and red indicate that the bias logic is expecting price to draw towards the given timeframe's previous high or low, respectively
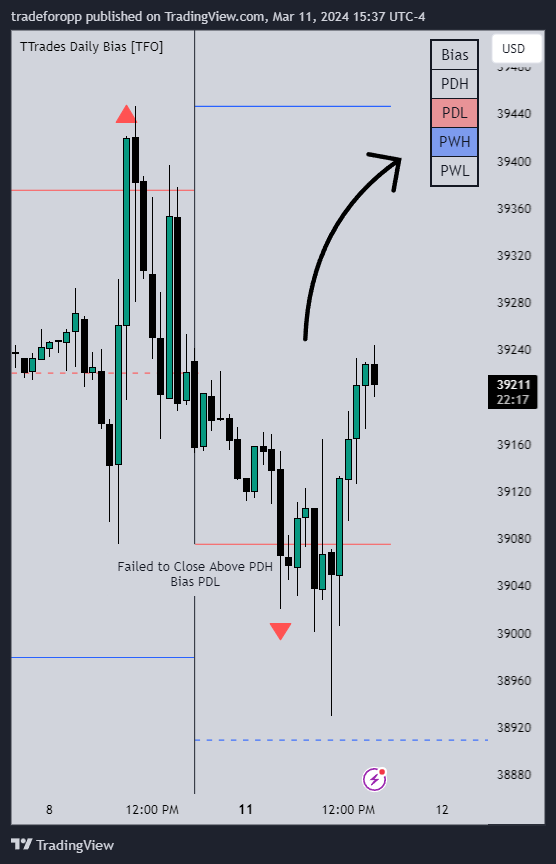
For a compact table view that doesn't take up much chart space, simply deselect the "Show Statistics" option
This will only show the color-coded bias column for a quick view of what levels are being anticipated (more user-friendly for mobile and other smaller screens)
This will only show the color-coded bias column for a quick view of what levels are being anticipated (more user-friendly for mobile and other smaller screens)
Hope you like it!
More details & access here: tradingview.com
More details & access here: tradingview.com
Loading suggestions...