

Paid Rs 20,000 to learn this powerful strategy. Learning new strategies is key to success in trading. Excited to implement this paid strategy with clear entry and exit rules
Hope you are excited to learn.
[BOOKMARK IT]
Name of Strategy : DOUBLE DOJI
#nifty #NiftyBank #StockToWatch #StocksInFocus #intradaytrading
Hope you are excited to learn.
[BOOKMARK IT]
Name of Strategy : DOUBLE DOJI
#nifty #NiftyBank #StockToWatch #StocksInFocus #intradaytrading
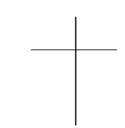
DOJI simply means Market is in a state of balance. Both Buyer & Seller Strength is over. Simply “TOOFAN SE PEHLE IS SHANTI HAIN” Calmness before a Major move.
So this is how DOJI looks like. It simply means market opened bulls tried to take price up and bears tried to take price down and at last price settled almost where is opened.
So this is how DOJI looks like. It simply means market opened bulls tried to take price up and bears tried to take price down and at last price settled almost where is opened.
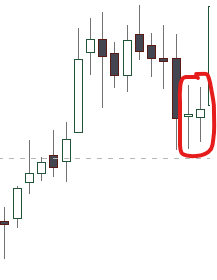
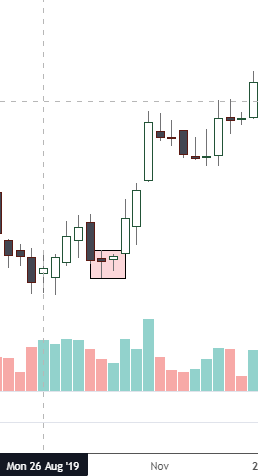
RULE NO 1: Double DOJI should form after a Strong Down Trend or Strong up trend.
Example: Right Extreme Candle are Double Doji.
Example: Right Extreme Candle are Double Doji.
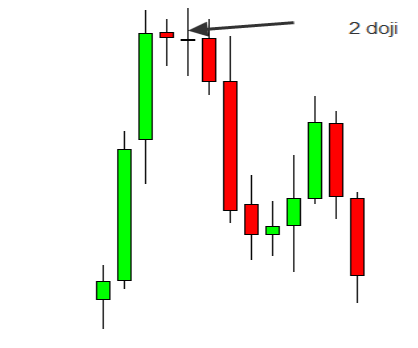
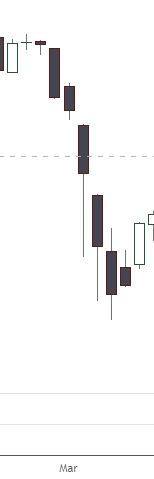
Example 2: Double Dojis after an up move.
RULE NO 2: Now Mark HIGHEST HIGH OF DOJI AND LOWEST LOW OF DOJIS.
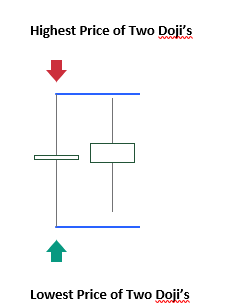
RULE NO 3:
ENTRY RULES- Enter the Trade Once High or Low is breached.
RULE NO 4 :
STOP LOSS- For Long Trade : Stop Loss will be 5-10 points below the Low of Two Dojis
For Short Trade: Stop Loss will be 5-10 points above the High of Two Dojis
ENTRY RULES- Enter the Trade Once High or Low is breached.
RULE NO 4 :
STOP LOSS- For Long Trade : Stop Loss will be 5-10 points below the Low of Two Dojis
For Short Trade: Stop Loss will be 5-10 points above the High of Two Dojis
RULE NO 5: EXIT
1. One Strategy is two exit when Risk Reward hits 1:1 i.e. Stop loss after trade is 40points so one should exit when in profit of 40 points.
2.Second Strategy is to exit when your risk reward hits 1:2 i.e. Stop loss is 40points then one should exit when in profit of 80points and better trail your profits.
Let’s Look have some examples:-
EXAMPLE NO. 1
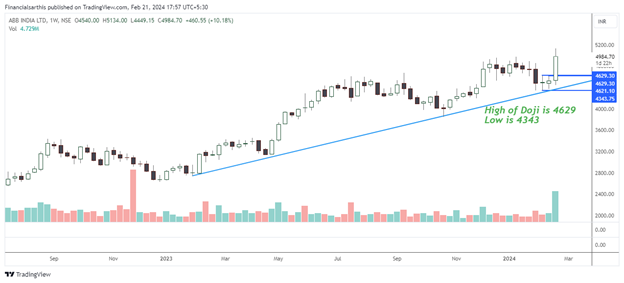
Recent Example is of #ABB. Weekly Chart has Double Doji.
High is 4629 & Low 4343. So once any level is breached then Buy or Sell starts.
Buy trade started on crossing high of 4629. So difference of both candle is 286 points.
So my target is (4629+286=4915) with sl of 4338.
So today high made 5134 and target achieved in 3 days. One can trail and wait for second target i.e. 5201.
EXAMPLE NO. 1
Recent Example is of #ABB. Weekly Chart has Double Doji.
High is 4629 & Low 4343. So once any level is breached then Buy or Sell starts.
Buy trade started on crossing high of 4629. So difference of both candle is 286 points.
So my target is (4629+286=4915) with sl of 4338.
So today high made 5134 and target achieved in 3 days. One can trail and wait for second target i.e. 5201.
EXAMPLE NO. 2
#TATAMOTOR :Weekly Chart has double doji.
High is 123.40 & Low 112.30. So once any level is breached then Buy or Sell starts.
Buy trade started on crossing high of 123.40. So difference of both candle is 11.1 points.
So my target is (123.4+11.1=134.50) with sl of 110. So 1st target achieved in next week only and second target in following week.
EXAMPLE NO. 3
Does this work on Index let’s c #NIFTY weekly chart has double doji.
High is 12246.70 & Low 11908.05. So once any level is breached then Buy or Sell starts.
Sell trade started on crossing low of 11908.05. So difference of both candle is 338.65 points. So my target is (11908.05-338.65=11569.40) with sl of 12256.
So 1st & 2nd target both achieved in next week only. Remember since at top Double Doji has tremendous significance.
oh!
That's a WRAP
HOPE you Like the strategy.
NOTE: #BROTIP This concept works like anything on Weekly Chart. You can use the same on other time frame too.
If you like our work then please follow us on X @financialsarthi & Join our telegram channel
t.me.
There are many example which i keep discussing in my telegram channel.
Recent posted on Metropolis
x.com
Also Repost & Like the tweet.
IF I GET 200 REPOST THEN WILL SHARE SCANNER FOR FREE FOR ALL
Loading suggestions...