

Microsoft Excel is used by 99% of the World’s businesses but most people don't know how to use it.
Here are 10 must-have Excel skills everyone should know:
Here are 10 must-have Excel skills everyone should know:
1. Using VLOOKUP:
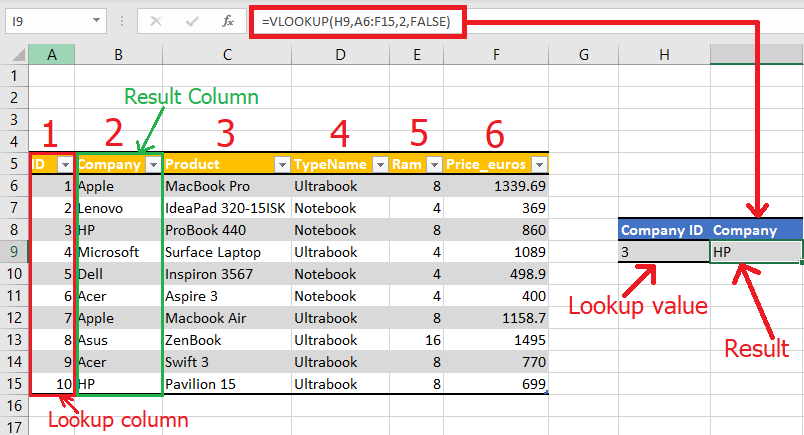
This function lets you search for a value in a table and return a value from another column in the same row.
For example, you can use it to find a person's phone number based on their name.
Just type "=VLOOKUP(lookup_value, table_array, col_index_num, [range_lookup])" and replace the parts in brackets with your data.
2. Using IF statements:
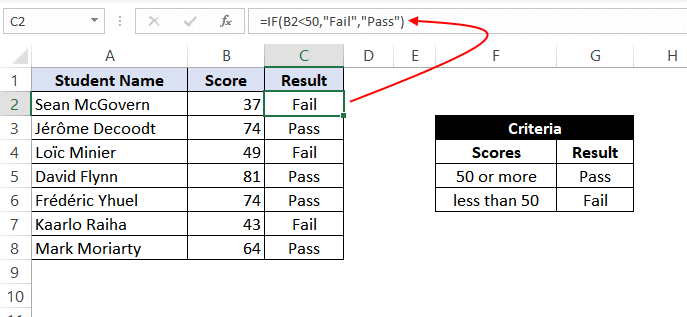
These let you make decisions in your formulas.
For example, you can make a cell display "Yes" if a number is greater than 100, and "No" if it's not.
Just type "=IF(condition, value_if_true, value_if_false)" and replace the parts in brackets with your data.
These let you make decisions in your formulas.
For example, you can make a cell display "Yes" if a number is greater than 100, and "No" if it's not.
Just type "=IF(condition, value_if_true, value_if_false)" and replace the parts in brackets with your data.
3. Using the Quick Analysis tool:
This makes it easy to create charts, tables, and other visualizations from your data.
Just select the data you want to analyze, and click the Quick Analysis button that appears in the bottom-right corner.
This makes it easy to create charts, tables, and other visualizations from your data.
Just select the data you want to analyze, and click the Quick Analysis button that appears in the bottom-right corner.

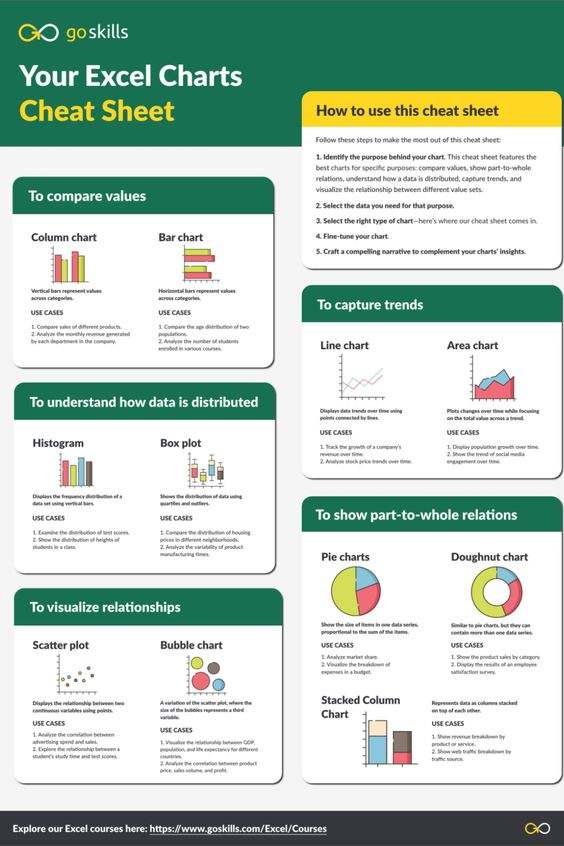
4. Creating Charts and Graphs:
You can turn your data into a picture, like a pie chart or a bar graph.
Just click on the data you want to show, go to the "Insert" tab, and choose the chart or graph you want.
You can turn your data into a picture, like a pie chart or a bar graph.
Just click on the data you want to show, go to the "Insert" tab, and choose the chart or graph you want.
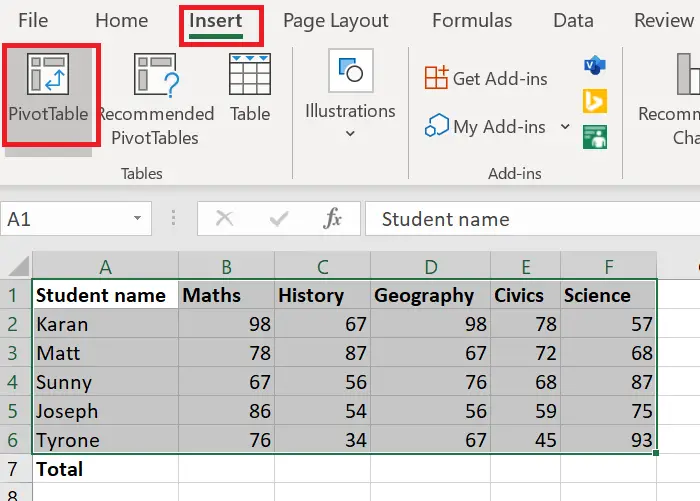
5. Using Pivot Tables:
These are great for summarizing large amounts of data.
You can quickly see the total, average, or count of numbers in a table.
Just click on your data, go to the "Insert" tab, and choose "Pivot Table."
These are great for summarizing large amounts of data.
You can quickly see the total, average, or count of numbers in a table.
Just click on your data, go to the "Insert" tab, and choose "Pivot Table."
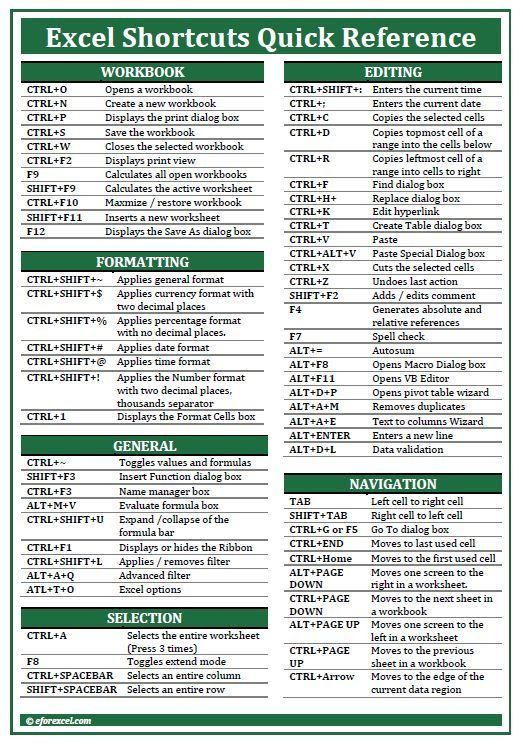
6. Using keyboard shortcuts:
These can save you a lot of time.
For example, you can press "Ctrl+C" to copy, "Ctrl+V" to paste, and "Ctrl+Z" to undo.
There are many more, so check out the Excel help menu for a full list.
These can save you a lot of time.
For example, you can press "Ctrl+C" to copy, "Ctrl+V" to paste, and "Ctrl+Z" to undo.
There are many more, so check out the Excel help menu for a full list.
7. Using basic functions:
Excel has a bunch of built-in functions that make life easier.
For example, SUM, AVERAGE, and COUNT can help you add, find the average, and count numbers in a range of cells.
Just type the function name, like "=SUM(A1:A10)" to add numbers in cells A1 to A10.
Excel has a bunch of built-in functions that make life easier.
For example, SUM, AVERAGE, and COUNT can help you add, find the average, and count numbers in a range of cells.
Just type the function name, like "=SUM(A1:A10)" to add numbers in cells A1 to A10.

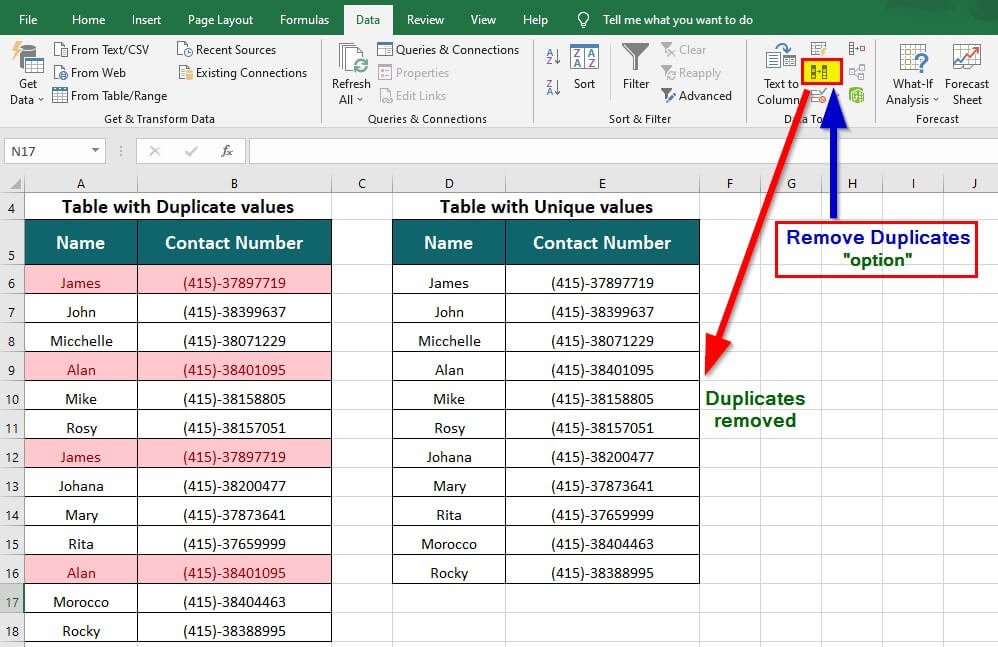
8. Remove duplicates:
Delete duplicate rows in your data.
Click Data > Remove Duplicates and select which columns to assess uniqueness.
Delete duplicate rows in your data.
Click Data > Remove Duplicates and select which columns to assess uniqueness.
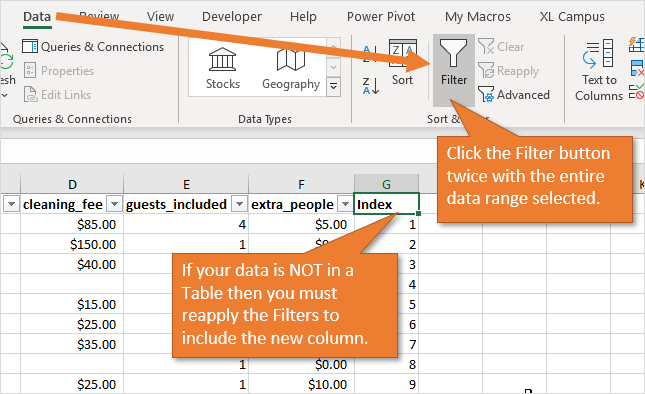
9. Sorting and filtering:
You can sort your data in alphabetical order or by number.
Just click on the column you want to sort and use the "Sort" button.
You can also filter data to only show what you want.
Click on the column header and use the "Filter" button.
You can sort your data in alphabetical order or by number.
Just click on the column you want to sort and use the "Sort" button.
You can also filter data to only show what you want.
Click on the column header and use the "Filter" button.
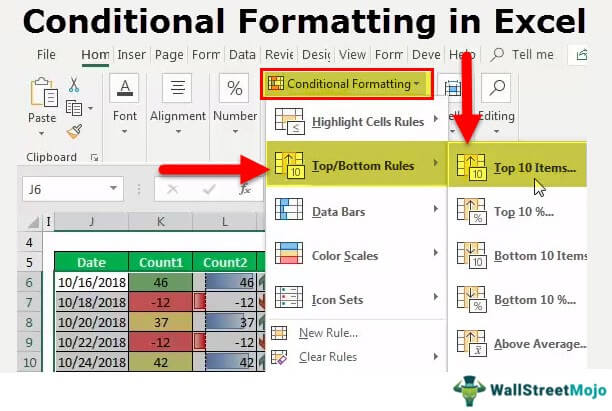
10. Using conditional formatting:
This lets you change the color of cells based on their value.
For example, you can make negative numbers red and positive numbers green.
Just select the cells, click "Conditional Formatting," and choose the style you want.
This lets you change the color of cells based on their value.
For example, you can make negative numbers red and positive numbers green.
Just select the cells, click "Conditional Formatting," and choose the style you want.
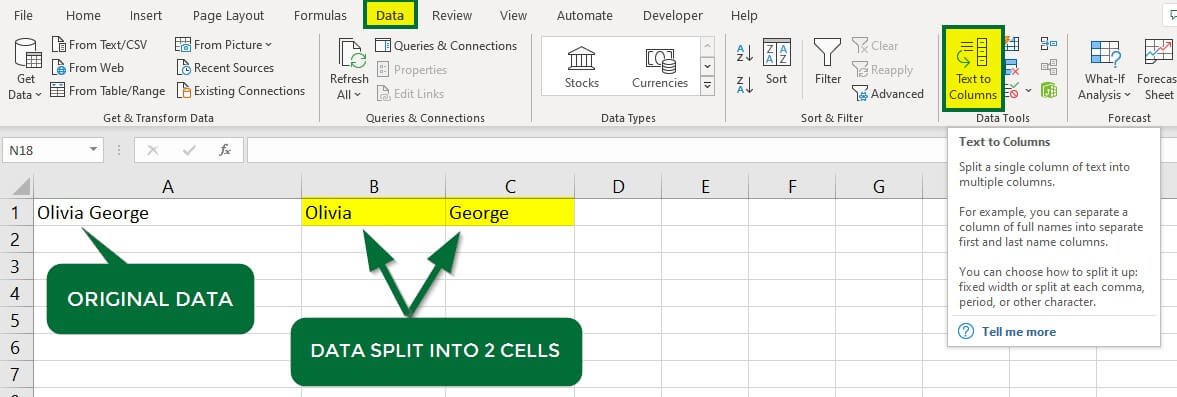
11. Text to columns:
This feature lets you split text in a cell into multiple columns.
For example, you can split a full name into first and last names.
This feature lets you split text in a cell into multiple columns.
For example, you can split a full name into first and last names.
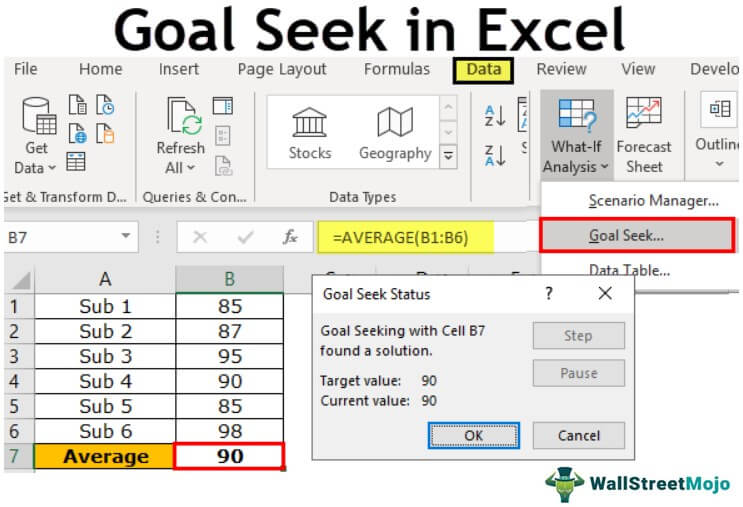
12. Goal seek:
This feature lets you find the input value needed to reach a specific goal.
For example, you can find the interest rate needed to reach a certain investment goal.
This feature lets you find the input value needed to reach a specific goal.
For example, you can find the interest rate needed to reach a certain investment goal.
If you want to Excel at using the most used business program in the World, memorize these basics:
• Goal seek
• VLOOKUP
• Pivot tables
• IF statements
• Basic functions
• Text to columns
• Charts and graphs
• Quick Analysis tool
• Remove Duplicates
• Keyboard shortcuts
• Sorting and filtering
• Conditional formatting
• Goal seek
• VLOOKUP
• Pivot tables
• IF statements
• Basic functions
• Text to columns
• Charts and graphs
• Quick Analysis tool
• Remove Duplicates
• Keyboard shortcuts
• Sorting and filtering
• Conditional formatting
Excel is one of the most important skills for your career.
If you enjoyed this thread, please:
1. 🔁RT it to share it with others!
2. Follow me @FluentInFinance for daily tips!
3. Join my 50,000+ readers in my newsletter at TheFinanceNewsletter.com for more tips!
If you enjoyed this thread, please:
1. 🔁RT it to share it with others!
2. Follow me @FluentInFinance for daily tips!
3. Join my 50,000+ readers in my newsletter at TheFinanceNewsletter.com for more tips!
We'll discuss this more in my newsletter ― Join 50,000+ readers and sign-up at TheFinanceNewsletter.com!
Loading suggestions...