

Dashboards are my favorite thing to create in Microsoft Excel...
and when set up correctly, they add a ton of value to a presentation
Here is how I build Dashboards using just 8 steps...
and when set up correctly, they add a ton of value to a presentation
Here is how I build Dashboards using just 8 steps...

Step 1: Import your data
This can be anything...
but most commonly, it involves your:
1. Profit & Loss 2. Balance Sheet
from there you can get your cash flows via the indirect method
other areas to import can be revenue, headcount, and other KPIs
This can be anything...
but most commonly, it involves your:
1. Profit & Loss 2. Balance Sheet
from there you can get your cash flows via the indirect method
other areas to import can be revenue, headcount, and other KPIs

Step 2: Clean with Power Query
Before you can work with your data in a flexible & dynamic way…
it needs to be structured correctly.
That’s where Power Query comes in.
If you haven’t used Power Query….oh boy…you are missing out.
Before you can work with your data in a flexible & dynamic way…
it needs to be structured correctly.
That’s where Power Query comes in.
If you haven’t used Power Query….oh boy…you are missing out.

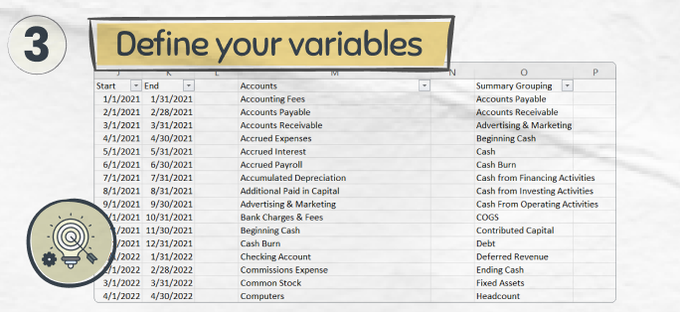
Step 3: Define your Variables
When designing dashboards, variables play a key piece.
Common variables can be ranges (profit & loss accounts)…
or specific values (start date, end date)
When designing dashboards, variables play a key piece.
Common variables can be ranges (profit & loss accounts)…
or specific values (start date, end date)
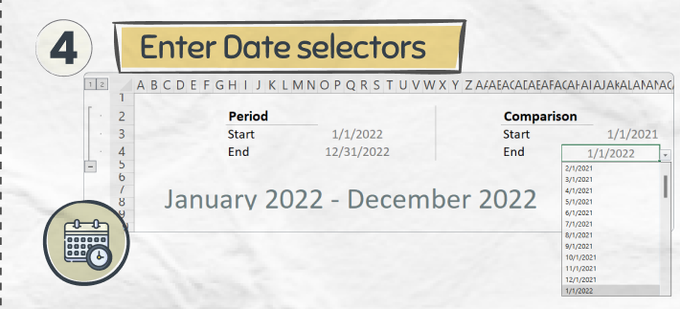
Step 4: Enter your Date Selectors
The best dashboards are ones where you can easily toggle to different dates…
allowing you to see your data update in real time for whichever period you set to
The best dashboards are ones where you can easily toggle to different dates…
allowing you to see your data update in real time for whichever period you set to
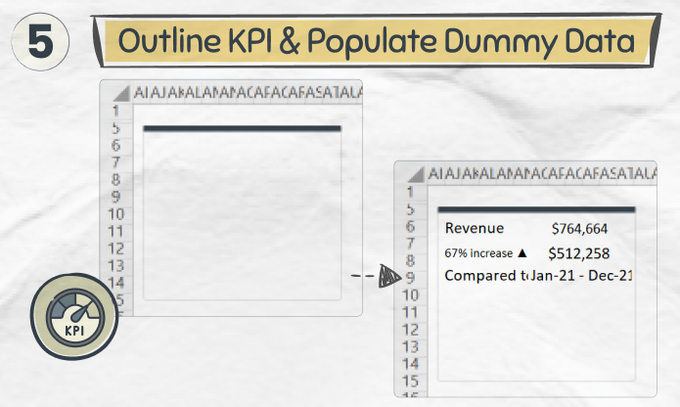
Step 5: Outline your first KPI with dummy data
Now comes time for the fun.
Start by including shapes, and populating raw text with where you want your data to go
Now comes time for the fun.
Start by including shapes, and populating raw text with where you want your data to go
Step 6: Finalize your design
Now it’s time to make this prettier, getting it ultimately to the design that you want.
Don’t skip this step! We are creatures of design, and it can make the world of a difference
Now it’s time to make this prettier, getting it ultimately to the design that you want.
Don’t skip this step! We are creatures of design, and it can make the world of a difference

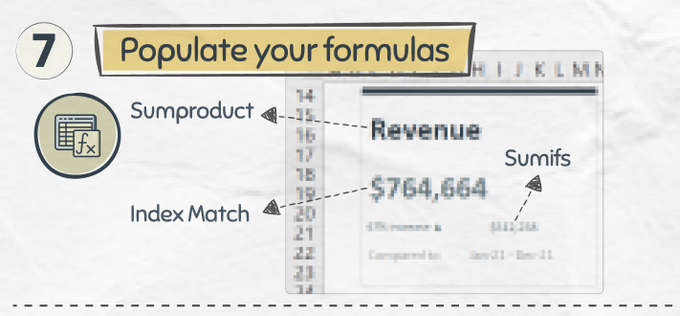
Step 7: Populate your formulas
Now it’s time to connect your data correctly using dynamic formulas
My favorite are:
∙ Index / Match
∙ Sumifs
∙ SumProduct
Now it’s time to connect your data correctly using dynamic formulas
My favorite are:
∙ Index / Match
∙ Sumifs
∙ SumProduct
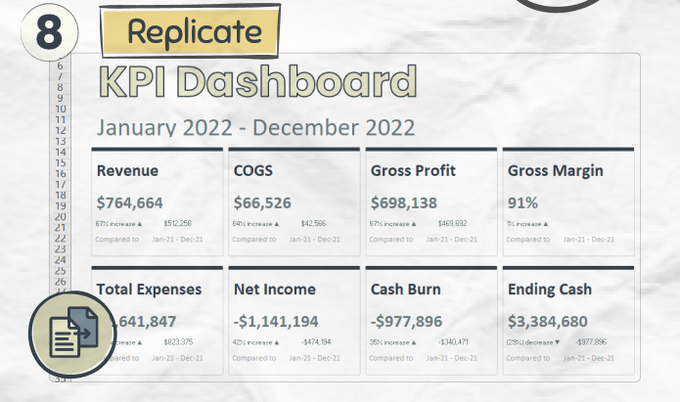
Step 8: Replicate
Once you have it all laid out…
you should be able to just copy and paste…
allowing you to replicate your dynamic pretty designs with ease
Once you have it all laid out…
you should be able to just copy and paste…
allowing you to replicate your dynamic pretty designs with ease
That's how I build my dashboards!
How about you? I
f you enjoyed this and want to receive more, subscribe to my newsletters here:
yourcfoguy.com
How about you? I
f you enjoyed this and want to receive more, subscribe to my newsletters here:
yourcfoguy.com

Loading suggestions...