

99% of traders rely on some kind of indicator to back their conviction.
It's not bad to use indicators. However, before applying them, a trader should understand how these indicators are derived or calculated.
Here are 10 widely used indicators by traders and institutions: 👇🏼👇🏼
It's not bad to use indicators. However, before applying them, a trader should understand how these indicators are derived or calculated.
Here are 10 widely used indicators by traders and institutions: 👇🏼👇🏼

This thread is in collaboration
@OmkarBanne
He is a fellow trader and all credits to this thread goes to him.
@OmkarBanne
He is a fellow trader and all credits to this thread goes to him.

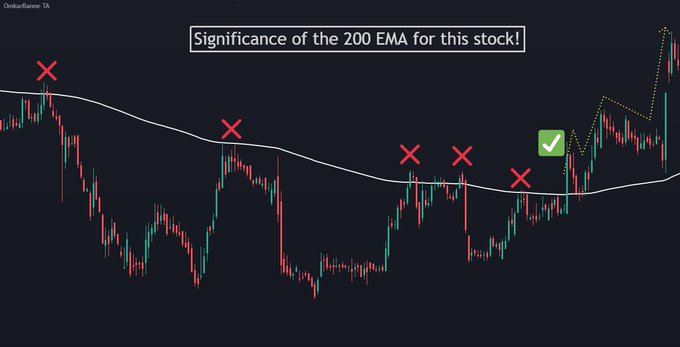
1. Moving Averages
- Calculates the average price of a stock over a specified period of time & helps traders identify trends and support/resistance levels
- Most commonly used MAs are 10, 21, 50, 100, 200
- Calculates the average price of a stock over a specified period of time & helps traders identify trends and support/resistance levels
- Most commonly used MAs are 10, 21, 50, 100, 200
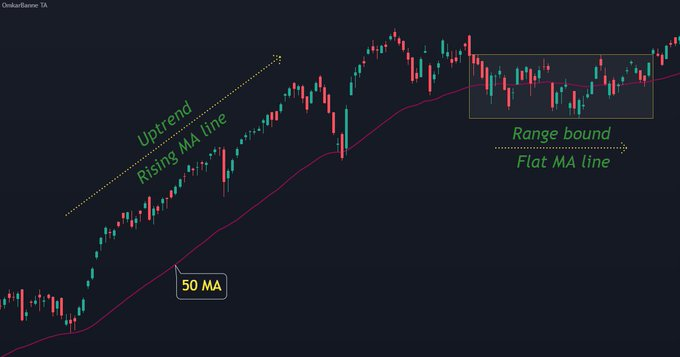
👉How to use it?
Analyse the angle of the MA.
- If the MA line is flat, then the stock is range bound.
- If the MA line angles up, the trend is an uptrend & vice versa
- Golden cross: 50 MA crosses over 200 MA; bullish
- Death cross: 50 MA crosses below 200 MA; bearish
Analyse the angle of the MA.
- If the MA line is flat, then the stock is range bound.
- If the MA line angles up, the trend is an uptrend & vice versa
- Golden cross: 50 MA crosses over 200 MA; bullish
- Death cross: 50 MA crosses below 200 MA; bearish
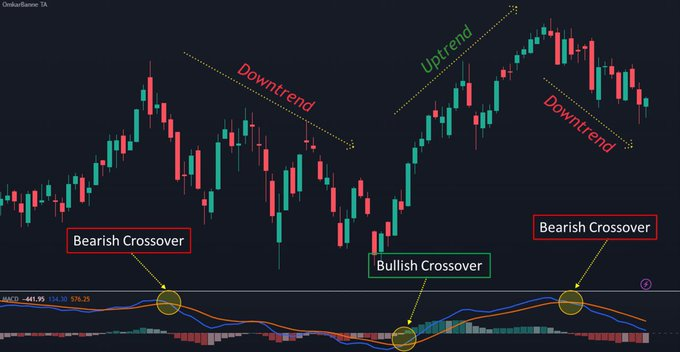
2. MACD
- The MACD is calculated by subtracting a long-term EMA (26) from a short-term EMA (12)
- The MACD indicator has three main components: the MACD line, the signal line, and the histogram
- The MACD is calculated by subtracting a long-term EMA (26) from a short-term EMA (12)
- The MACD indicator has three main components: the MACD line, the signal line, and the histogram
- Crossover: When the MACD line crosses above the signal line; bullish trend & vice versa
- Histogram: When the histogram is above the zero line; bullish momentum increasing & vice versa
- Divergence: If the price is making HH & the MACD is making LH; potential trend reversal
- Histogram: When the histogram is above the zero line; bullish momentum increasing & vice versa
- Divergence: If the price is making HH & the MACD is making LH; potential trend reversal
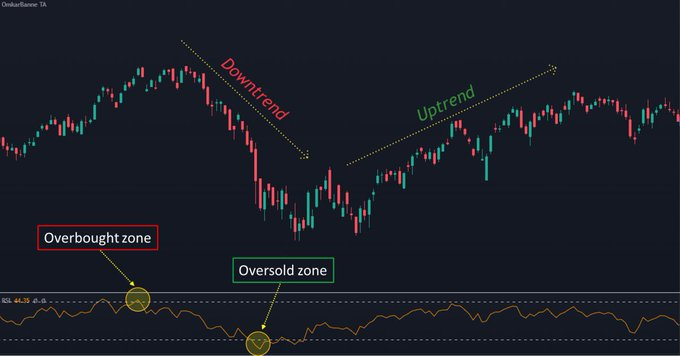
3. Relative Strength Index
- RSI is used to identify potential trend reversals and overbought or oversold conditions
- It is calculated by comparing the average gains & losses of a stock over a specified period of time (default of 14 days)
- RSI ranges from 0 to 100
- RSI is used to identify potential trend reversals and overbought or oversold conditions
- It is calculated by comparing the average gains & losses of a stock over a specified period of time (default of 14 days)
- RSI ranges from 0 to 100
👉How to use it?
- Bullish or Bearish divergence: if the price is making LL & the RSI is making HL; a potential bullish reversal and vice versa
- Entry & Exit points: if the RSI is in an oversold zone and begins to rise, a buying opportunity and vice versa
- Bullish or Bearish divergence: if the price is making LL & the RSI is making HL; a potential bullish reversal and vice versa
- Entry & Exit points: if the RSI is in an oversold zone and begins to rise, a buying opportunity and vice versa
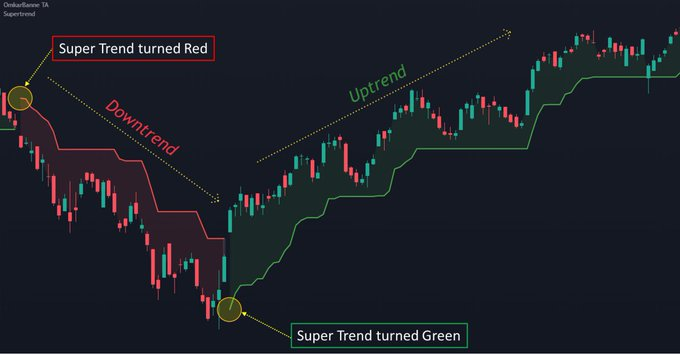
4. Super Trend
- It is similar to moving averages
- It is a very simple indicator and is constructed with the help of just two parameters- period (10) & multiplier (3)
- As a trending indicator, Super Trend performs excellently in trending markets (both uptrends & downtrends)
- It is similar to moving averages
- It is a very simple indicator and is constructed with the help of just two parameters- period (10) & multiplier (3)
- As a trending indicator, Super Trend performs excellently in trending markets (both uptrends & downtrends)
👉How to use it?
- If the Super Trend indicator moves below the price, the indicator shows a buy signal and turns green
- If a Super Trend closes above the price, then the indicator shows a sell signal in red
- It suggests support & resistance levels
- If the Super Trend indicator moves below the price, the indicator shows a buy signal and turns green
- If a Super Trend closes above the price, then the indicator shows a sell signal in red
- It suggests support & resistance levels
5. Average Directional Index (ADX)
- It is used to measure the strength of a trend
- The ADX ranges from 0 to 100
- It is calculated by taking the difference between +ve directional indicator (+DI) & -ve directional indicator (-DI) and dividing it by the sum of the two
- It is used to measure the strength of a trend
- The ADX ranges from 0 to 100
- It is calculated by taking the difference between +ve directional indicator (+DI) & -ve directional indicator (-DI) and dividing it by the sum of the two
- ADX does not indicate the direction of the trend
👉How to use it?
- The higher the ADX, the stronger the trend
- ADX of 30 or higher is considered a strong trend
- ADX below 20 suggests a weak trend
👉How to use it?
- The higher the ADX, the stronger the trend
- ADX of 30 or higher is considered a strong trend
- ADX below 20 suggests a weak trend
6. Parabolic SAR (Stop and Reverse)
- Used to identify potential reversals in trends
- It is calculated by taking the prior period's high/low & adjusting it by an acceleration factor (0.02)
- This factor increases with the trend, it helps the indicator catch up to the price
- Used to identify potential reversals in trends
- It is calculated by taking the prior period's high/low & adjusting it by an acceleration factor (0.02)
- This factor increases with the trend, it helps the indicator catch up to the price
👉How to use it?
- The dots appear below the price when the trend is up and above the price when the trend is down
- The Parabolic SAR can also be used as a stop-loss tool
For long positions, the SL can be placed below
For short positions, it can be placed above
- The dots appear below the price when the trend is up and above the price when the trend is down
- The Parabolic SAR can also be used as a stop-loss tool
For long positions, the SL can be placed below
For short positions, it can be placed above
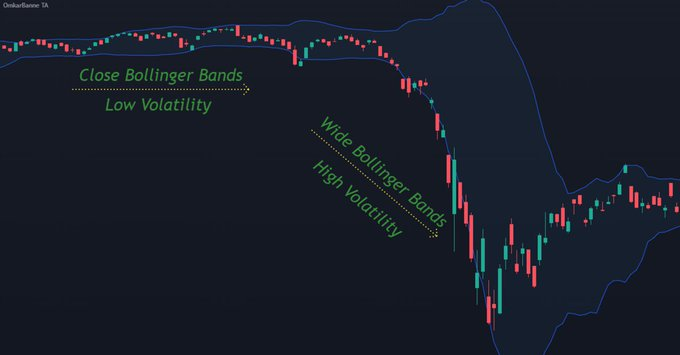
7. Bollinger Bands
- It is used to measure volatility & identify potential reversals
- It consists of three lines, a simple moving average (SMA) in the middle and an upper & lower band that are two standard deviations away from the SMA
- It is used to measure volatility & identify potential reversals
- It consists of three lines, a simple moving average (SMA) in the middle and an upper & lower band that are two standard deviations away from the SMA
👉How to use it?
- When the bands are close together; it suggests low volatility
When the bands are far apart; it suggests high volatility
- When the price touches the upper/lower band, it suggests that the market may be overbought/oversold and a reversal may be imminent
- When the bands are close together; it suggests low volatility
When the bands are far apart; it suggests high volatility
- When the price touches the upper/lower band, it suggests that the market may be overbought/oversold and a reversal may be imminent
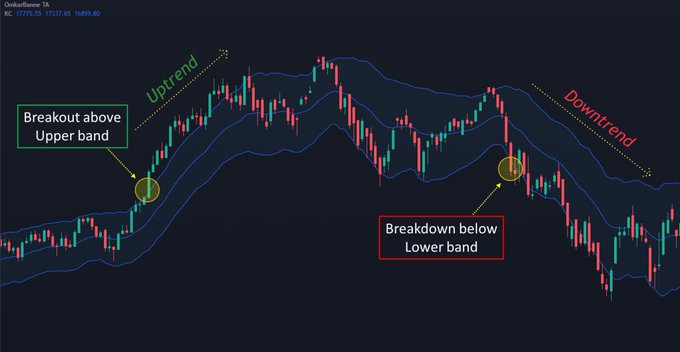
8.Keltner Channel
- It is used to identify potential breakouts & trends
- It consists of two lines, an upper & lower band, that are plotted using the Average True Range (ATR)
- The upper & lower bands are plotted by adding & subtracting a multiple of the ATR from the MA
- It is used to identify potential breakouts & trends
- It consists of two lines, an upper & lower band, that are plotted using the Average True Range (ATR)
- The upper & lower bands are plotted by adding & subtracting a multiple of the ATR from the MA
👉How to use it?
- When the price breaks above the upper band, it suggests a potential bullish trend
- When the price breaks below the lower band, it suggests a potential bearish trend
Keltner Channel is best used in trending markets & may not be as effective in range.
- When the price breaks above the upper band, it suggests a potential bullish trend
- When the price breaks below the lower band, it suggests a potential bearish trend
Keltner Channel is best used in trending markets & may not be as effective in range.
9. Donchian Channel
- It consists of an upper & lower band, which are plotted using the highest high & lowest low over a set period of time (default 20)
- The upper band represents the highest high while the lower band represents the lowest low over the set period
- It consists of an upper & lower band, which are plotted using the highest high & lowest low over a set period of time (default 20)
- The upper band represents the highest high while the lower band represents the lowest low over the set period
👉How to use it?
- When the price breaks above the upper band, it suggests a potential bullish breakout
- When the price breaks below the lower band, it suggests a potential bearish breakout
- When the price breaks above the upper band, it suggests a potential bullish breakout
- When the price breaks below the lower band, it suggests a potential bearish breakout
10. Average True Range (ATR)
- It is used to measure volatility & identify potential price movements in the market
- It measures the average range of price movement over a set period of time (default 14)
- It is used to measure volatility & identify potential price movements in the market
- It measures the average range of price movement over a set period of time (default 14)
Hope you found this helpful? Want to learn more? 🙂
Just retweet the first tweet and Follow us @Omkarbanne @chartians🔥
Just retweet the first tweet and Follow us @Omkarbanne @chartians🔥
Loading suggestions...