

If you want to get a quick and dirty top-down view of the long-term market trends, you can look at indices trading above their 200-day moving averages. You can see this easily on the Technicals Dashboard by @StreakTech. Here are the major Nifty indices trading above their 200 DMA.
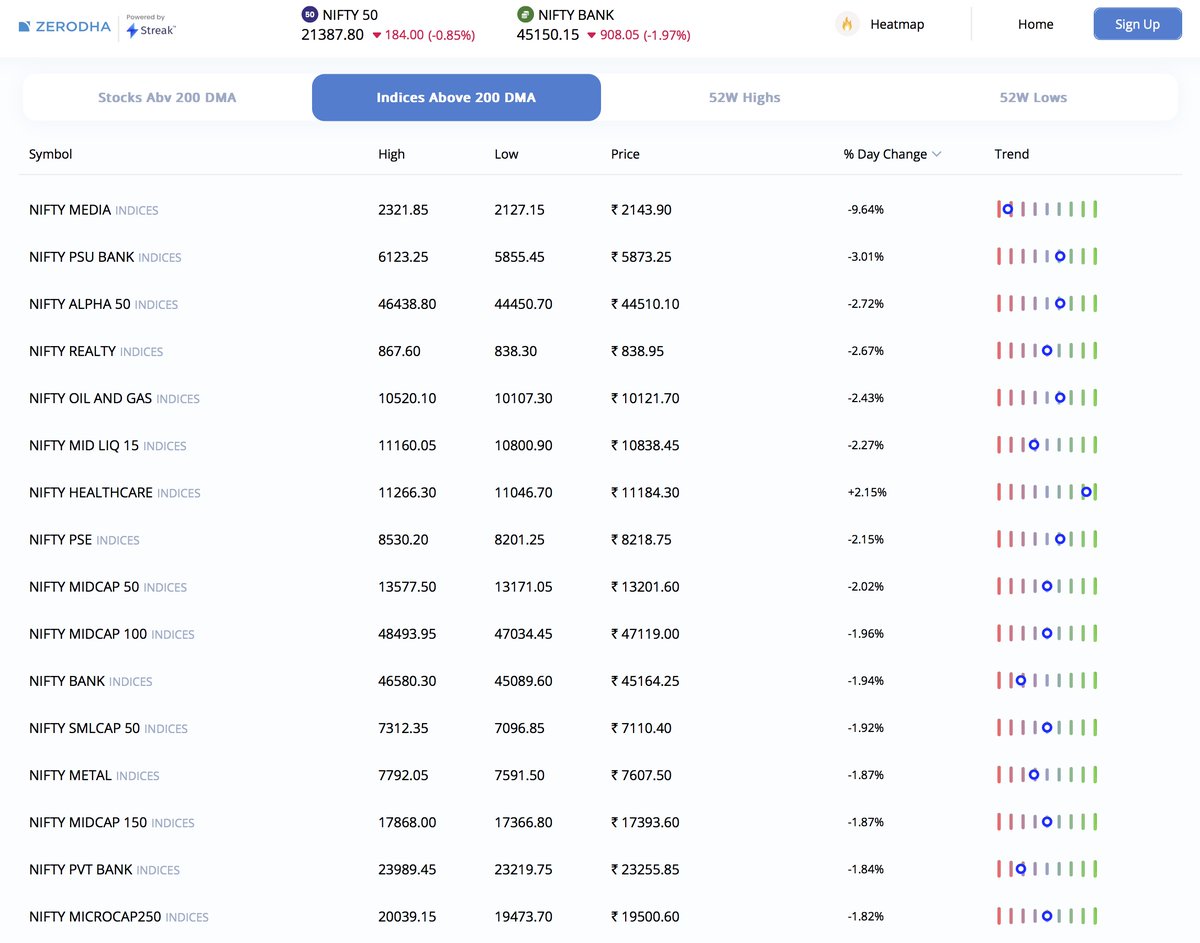
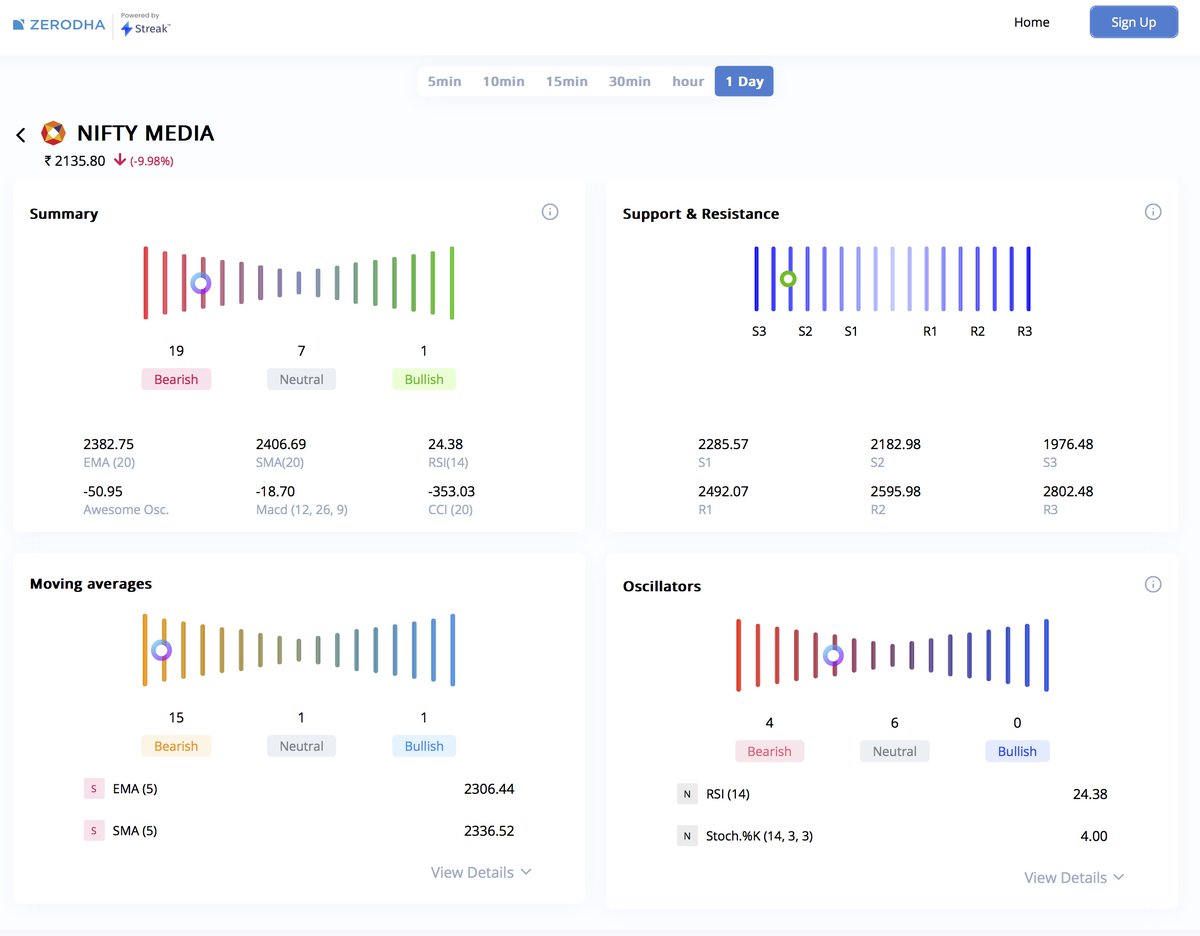
You can click on "Trend" to get a quick technical overview of the index. You can gauge the strength of the index's trend by examining a snapshot of the moving average levels, support, resistance, and oscillators.
You can view this data along with other market summary on the technicals dashboard powered by Streak👇
technicals.zerodha.com
technicals.zerodha.com

One of the best things about technical analysis is that it mostly forces you to trade with the trend rather than going against it. Trading against the trend is one big reason why traders lose money. It's a good tool to have in your arsenal, both as a trader and an investor.
If you want to learn the basics without losing your mind, this @ZerodhaVarsity playlist is a good place to start👇
youtube.com
youtube.com

Loading suggestions...