

Google Sheet is a powerful tool, but most people don’t know how to use it to excel in TRADING and INVESTING 📖
Top Google Sheet features every trader and investor should know in this Thread 🧵:
Top Google Sheet features every trader and investor should know in this Thread 🧵:
How you can use some secret features of Google Sheet and Google Finance in your trading together?
5 things that a trader should know and implement:
5 things that a trader should know and implement:
GOOGLEFINANCE(ticker, [attribute], [start_date], [end_date|num_days], [interval])
The above function is a basic one.
Let's decode each parameter in this:
⚡️ Ticker: This is the symbol of the stock.
"NSE: RELIANCE" is the ticker for Reliance Industries
The above function is a basic one.
Let's decode each parameter in this:
⚡️ Ticker: This is the symbol of the stock.
"NSE: RELIANCE" is the ticker for Reliance Industries
![GOOGLEFINANCE(ticker, [attribute], [start_date], [end_date|num_days], [interval])
The above functio...](https://pbs.twimg.com/media/GENXREiaMAAyGVA.jpg)
⚡️ Attribute:
The attribute to fetch about ticker from Google Finance and is required if a date is specified.
The following data can be fetched:
-Open
-Close
-High
-Low
-Volume
-Market Cap
-Price (Ltp)
-52-week high
-52-week low
-Change in price
The attribute to fetch about ticker from Google Finance and is required if a date is specified.
The following data can be fetched:
-Open
-Close
-High
-Low
-Volume
-Market Cap
-Price (Ltp)
-52-week high
-52-week low
-Change in price
⚡️ Start_Date (Optional): The start date when fetching historical data.
⚡️ End_Date|Num_Days (O): The end date when fetching historical data, or the number of days from start_date for which to return data.
⚡️ Interval (O): The frequency of returned data; either "D" or "W"
⚡️ End_Date|Num_Days (O): The end date when fetching historical data, or the number of days from start_date for which to return data.
⚡️ Interval (O): The frequency of returned data; either "D" or "W"
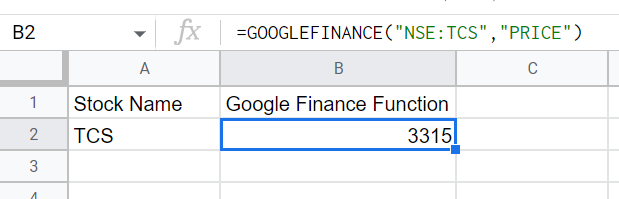
1/ Fetching Stock Price Live
GOOGLEFINANCE("NSE:TCS","PRICE")
This function will help you in fetching stock price live.
Make sure you mention exchange and ticker code properly.
Attribute can be price or any of the above attribute.
GOOGLEFINANCE("NSE:TCS","PRICE")
This function will help you in fetching stock price live.
Make sure you mention exchange and ticker code properly.
Attribute can be price or any of the above attribute.
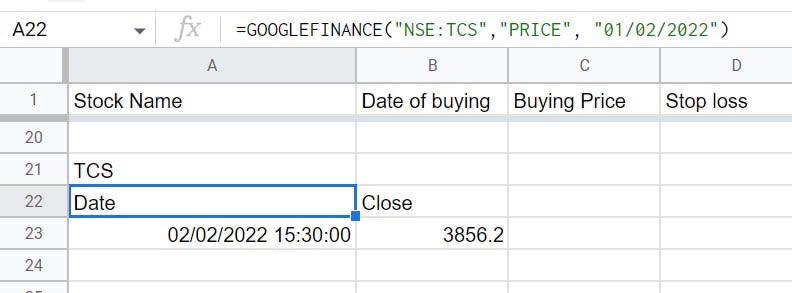
2/ Fetching Stock Price of any particular date:
GOOGLEFINANCE("TCS","PRICE", "01/02/2022")
This function will fetch the TCS stock price as on 1st Feb 2022.
Output is shown in the image below image.
GOOGLEFINANCE("TCS","PRICE", "01/02/2022")
This function will fetch the TCS stock price as on 1st Feb 2022.
Output is shown in the image below image.
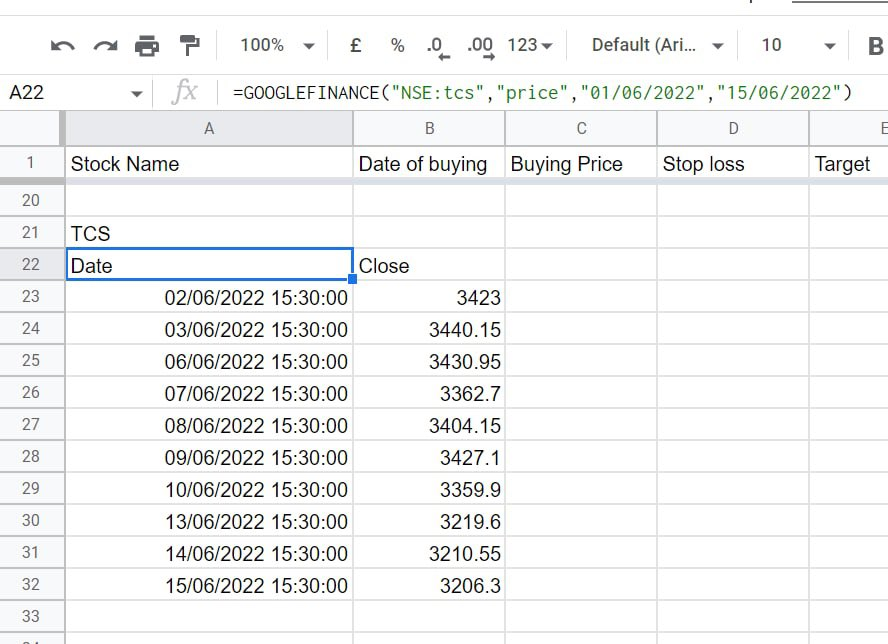
3/ Fetching Stock Price for an interval:
GOOGLEFINANCE("NSE:TCS","price","01/06/2022","15/06/2022")
This will fetch Trent Daily Stock Price from 1st June to 15th June 2022.
Output is shown in the image below image.
GOOGLEFINANCE("NSE:TCS","price","01/06/2022","15/06/2022")
This will fetch Trent Daily Stock Price from 1st June to 15th June 2022.
Output is shown in the image below image.
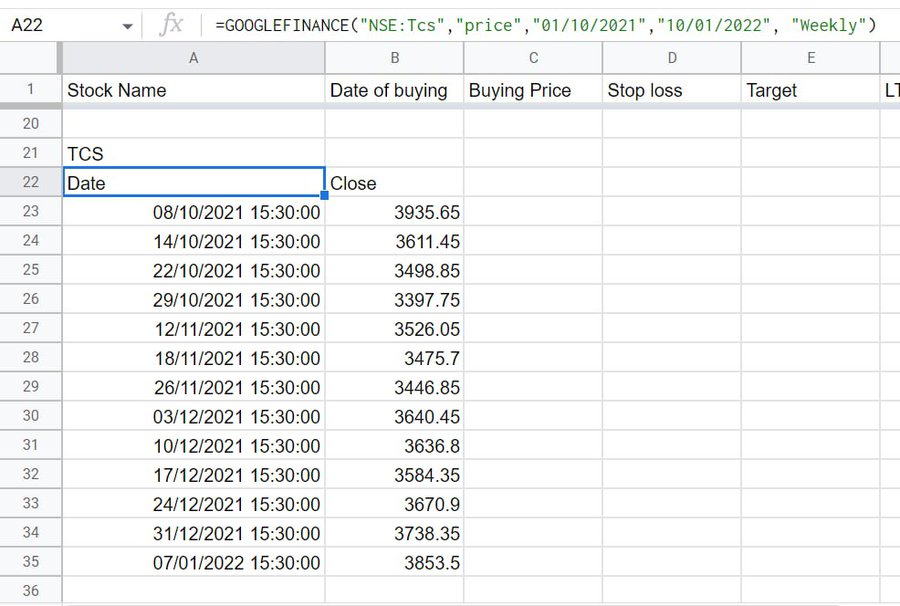
4/ Fetching Stock Price for an interval on weekly basis:
GOOGLEFINANCE("NSE:TCS","price","01/10/2021","15/01/2022", "Weekly")
This will fetch Trent Weekly Stock Price from 1st Oct to 15th Jan 2022.
Output is shown in the image below image.
GOOGLEFINANCE("NSE:TCS","price","01/10/2021","15/01/2022", "Weekly")
This will fetch Trent Weekly Stock Price from 1st Oct to 15th Jan 2022.
Output is shown in the image below image.
5/ These were the Google Finance functions for stocks.
Some basic function which you can use are:
⚡️ "Today()" = Fetch Current Date.
⚡️ "Today()-30" = Fetch 30 days back date.
⚡️ EDATE("01/02/2022",-3) = Fetch 3 months back date.
Some basic function which you can use are:
⚡️ "Today()" = Fetch Current Date.
⚡️ "Today()-30" = Fetch 30 days back date.
⚡️ EDATE("01/02/2022",-3) = Fetch 3 months back date.
How you can use this Google Sheet in your trading?
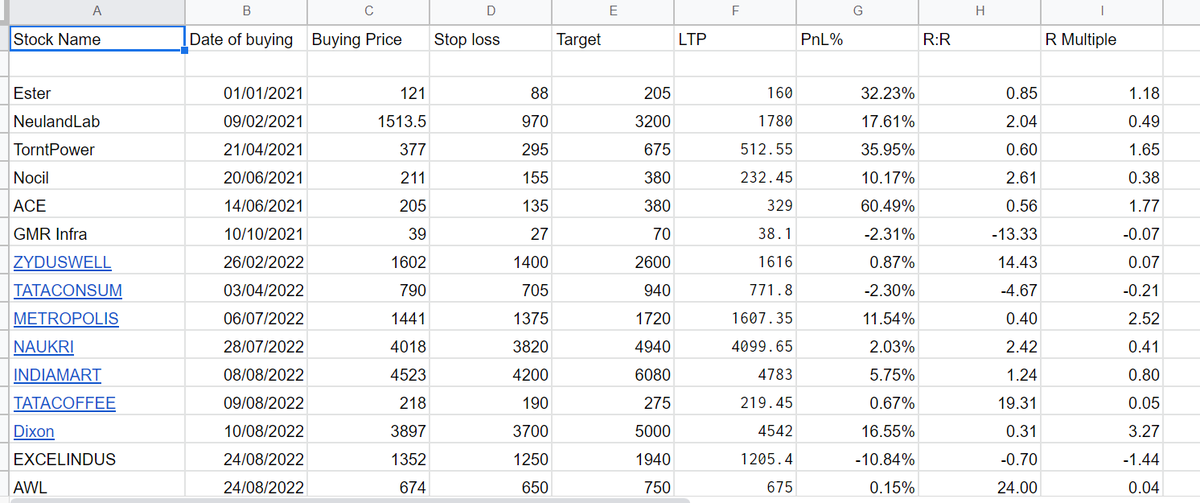
⚡️ Track all your open and close position, just like how we are doing this for years.
⚡️ If you monitor your closed position, then you can create a graph of your capital and NAV/Equity Curve easily.
⚡️ Track all your open and close position, just like how we are doing this for years.
⚡️ If you monitor your closed position, then you can create a graph of your capital and NAV/Equity Curve easily.
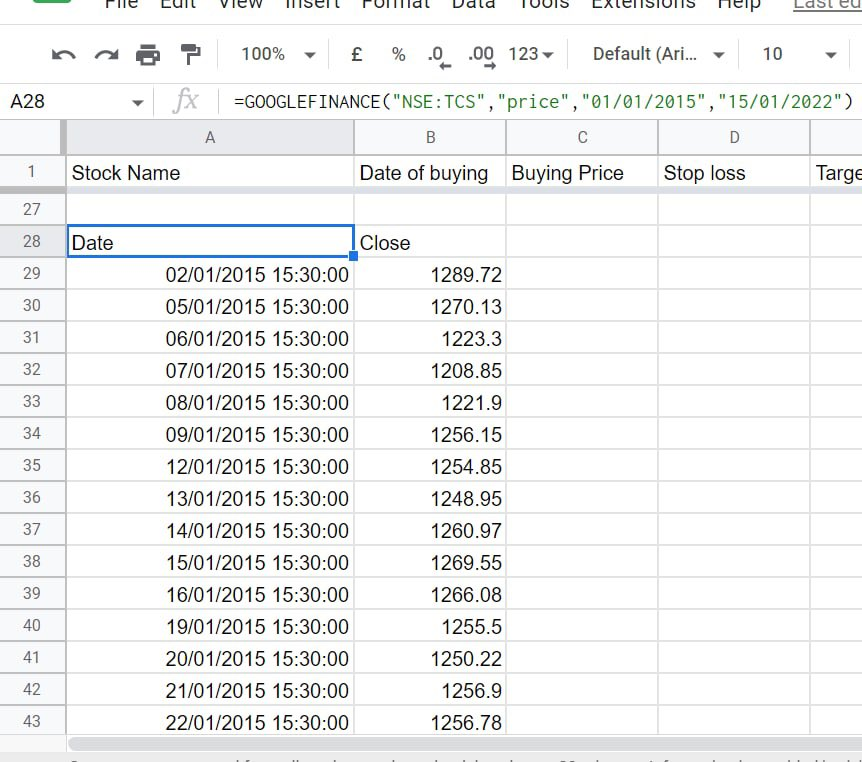
⚡️ Pull out entire data of any stock or index for any particular duration automatically.
In the image, we are fetching the last 7 years' data of TCS price in just a few seconds, otherwise it would have taken hours.
Above data, you can use to do backtesting of any strategy.
In the image, we are fetching the last 7 years' data of TCS price in just a few seconds, otherwise it would have taken hours.
Above data, you can use to do backtesting of any strategy.
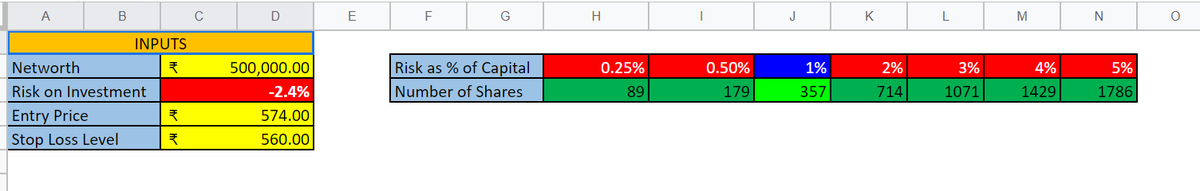
⚡️ Create your money or risk management tool on Google Sheet:
This is how you can create your own Risk Management Google Sheet with basic functions.
Based on risk % per trade, it will automatically calculate the quantities that you can buy in a stock.
This is how you can create your own Risk Management Google Sheet with basic functions.
Based on risk % per trade, it will automatically calculate the quantities that you can buy in a stock.
These are the best features of Google Sheet that a trader should try out in their trading and analysis.
If you found this useful, please RT the first tweet.
For live trading and stock market related updates, you can join our Telegram Channel⤵️
telegram.me
If you found this useful, please RT the first tweet.
For live trading and stock market related updates, you can join our Telegram Channel⤵️
telegram.me

Loading suggestions...