

13 Stock Chart Patterns that You should know 📈💹
A thread 🔗💬
A thread 🔗💬
On a very basic level, stock chart patterns are a way of viewing a series of price actions that occur during a stock trading period. It can be over any time frame – monthly, weekly, daily, and intra-day.
If you can learn to recognize these patterns early, they will help you to gain a real competitive advantage in the markets. Just as technical indicators can help your technical analysis trading, stock chart patterns can contribute to identifying trend reversals and continuations.

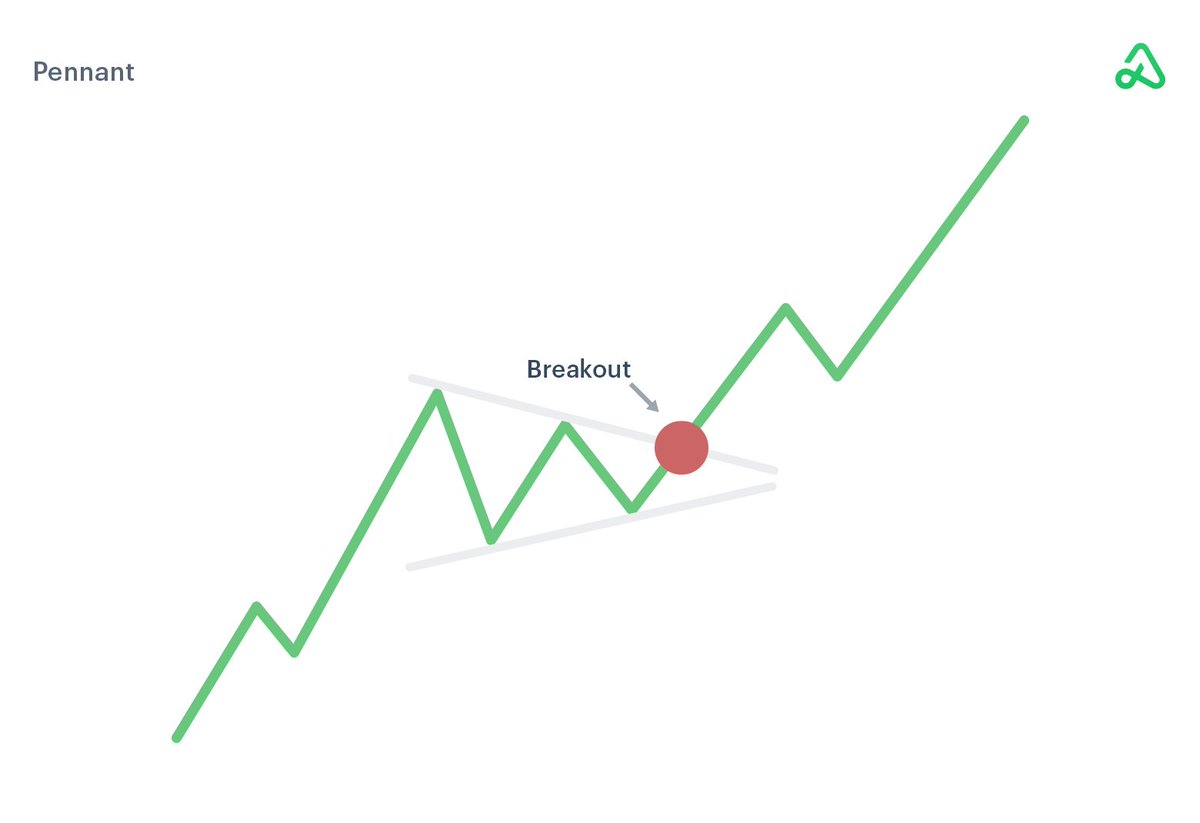
A pennant is created when there is a significant movement in the stock, followed by a period of consolidation – this creates the pennant shape due to the converging lines. A breakout movement then occurs in the same direction as the big stock move.
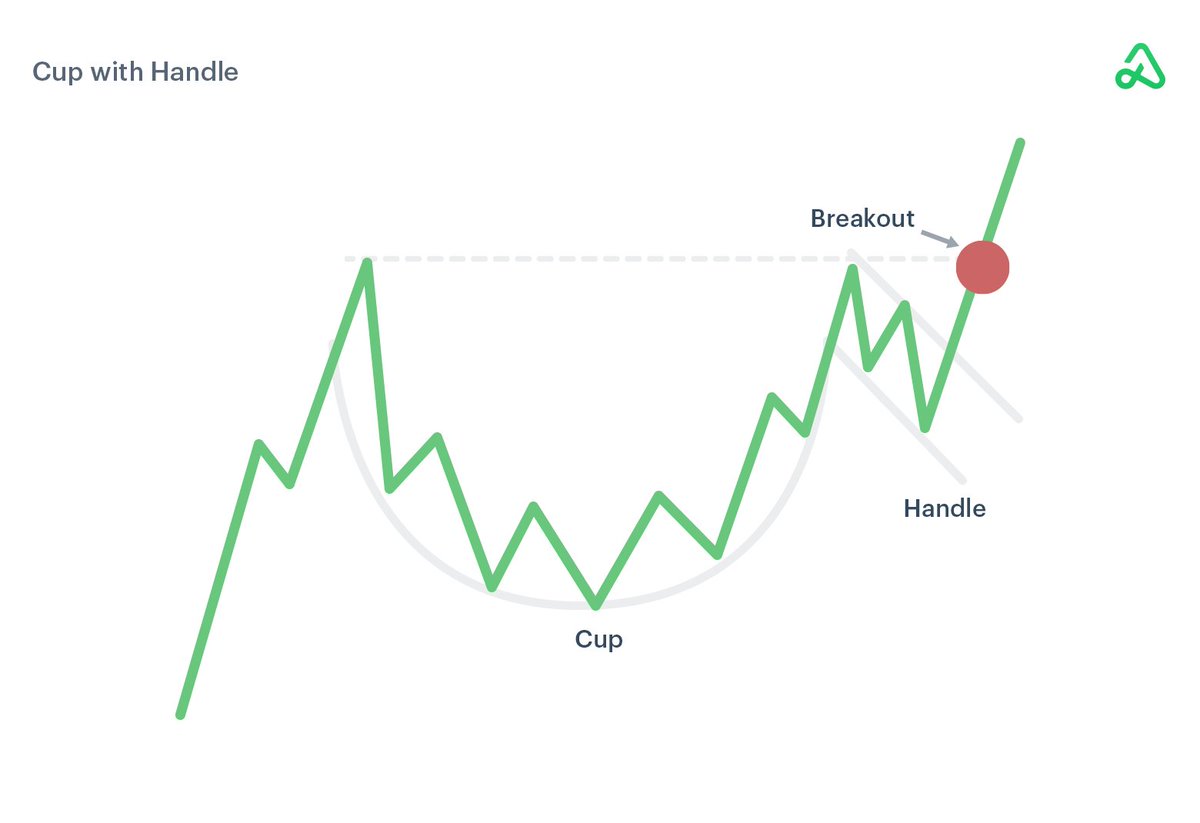
A cup with handle pattern gets its name from the obvious pattern it makes on the chart. The cup is a curved u-shape, while the handle slopes slightly downwards. In general, the right-hand side of the diagram has low trading volume, and it can last from 7 to 65 weeks.
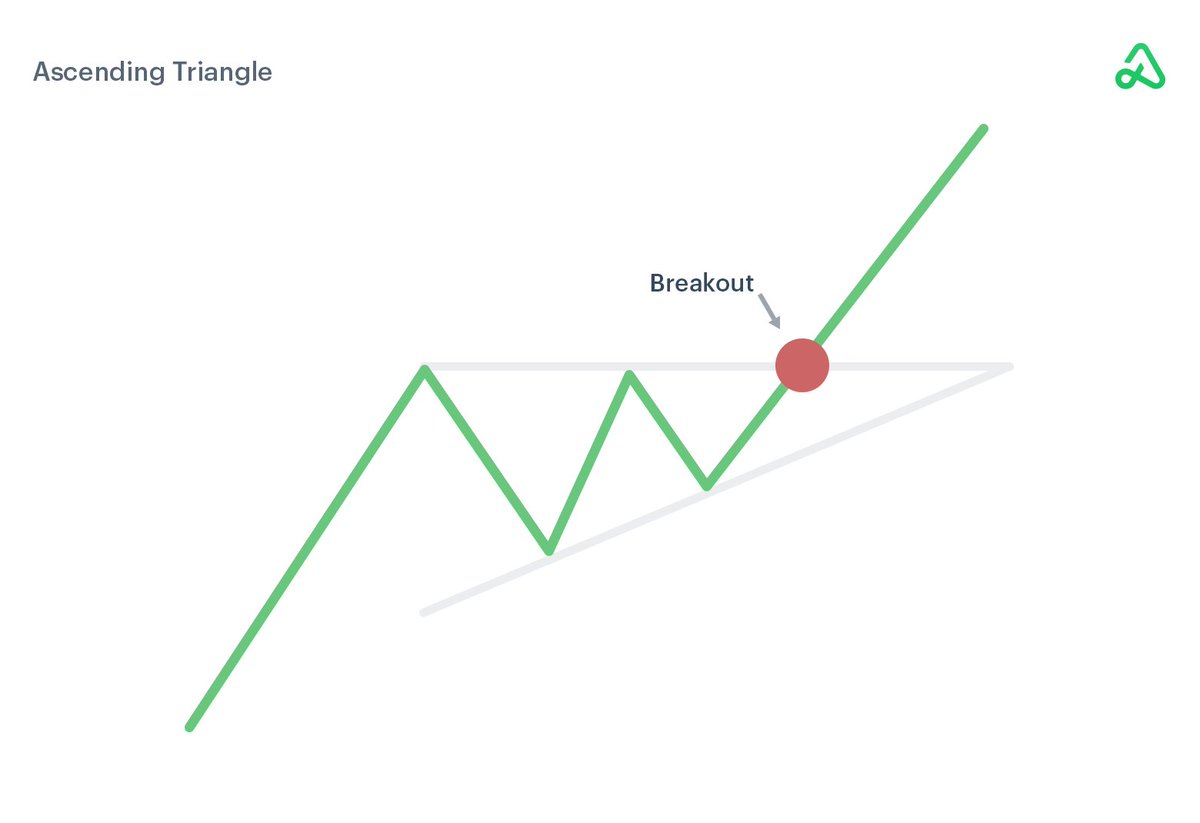
This triangle usually appears during an upward trend and is regarded as a continuation pattern. It is a bullish pattern. Sometimes it can be created as part of a reversal at the end of a downward trend, but more commonly it is a continuation.
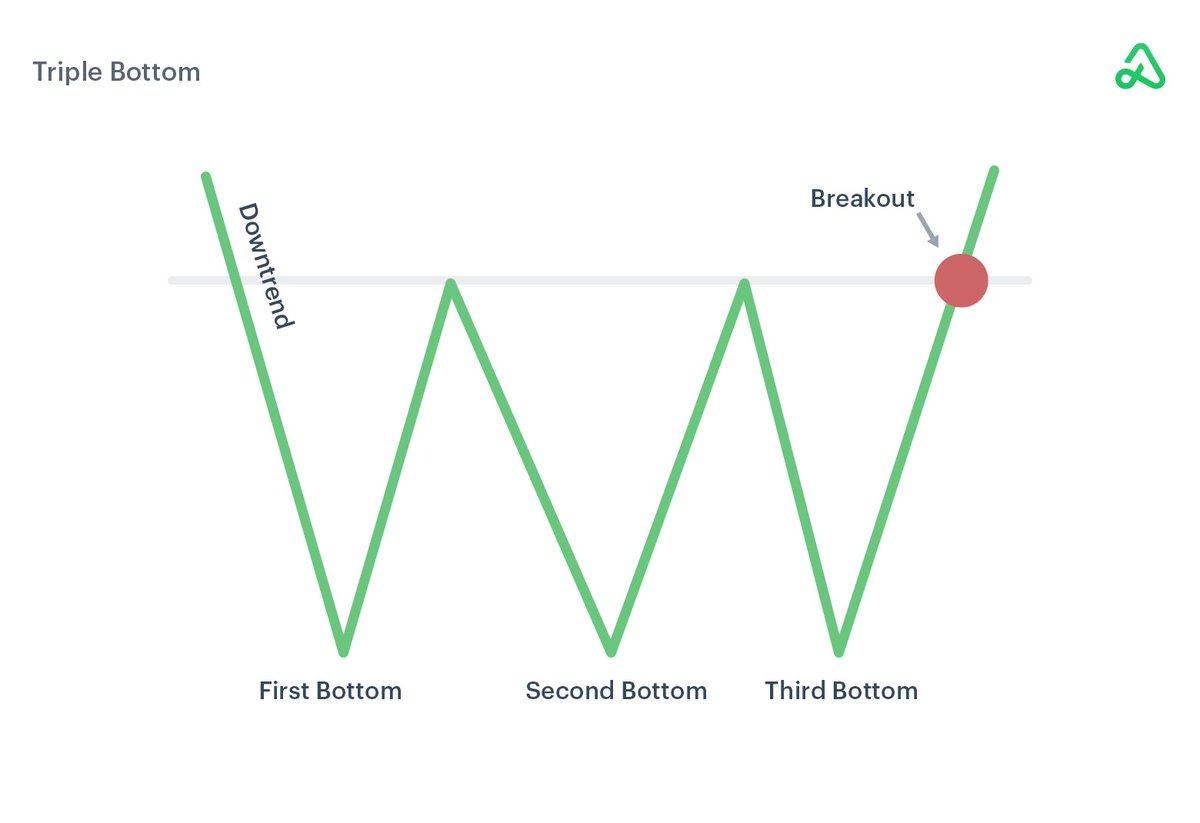
The triple bottom pattern is used in technical analysis to predict a reversal following a long downward trend. The triple bottom occurs when the stock price creates three distinct downward movements, at or around the same price level, before breaking out and reversing the trend.
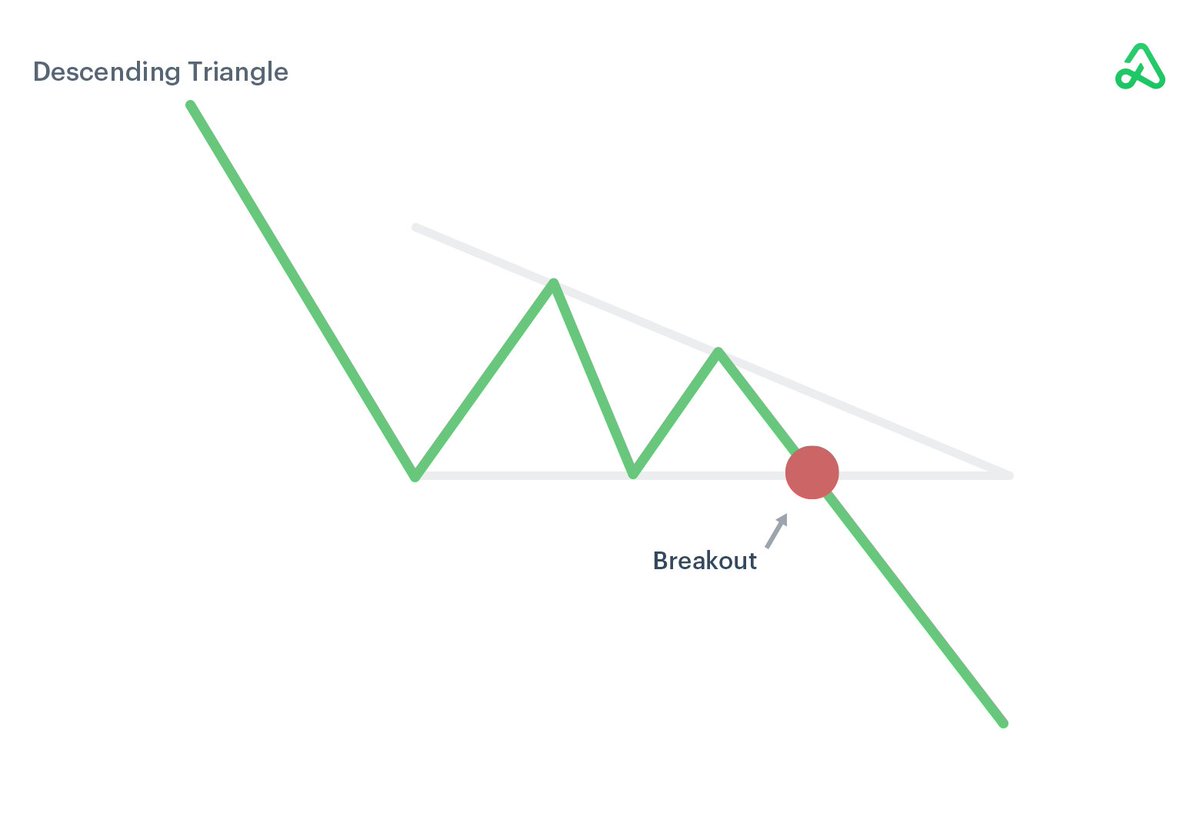
The descending triangle is another continuation pattern, but this triangle is a bearish pattern and is usually created as a continuation during a downward trend. Occasionally it can be seen as a reversal during an upward trend (the opposite of the ascending triangle pattern)
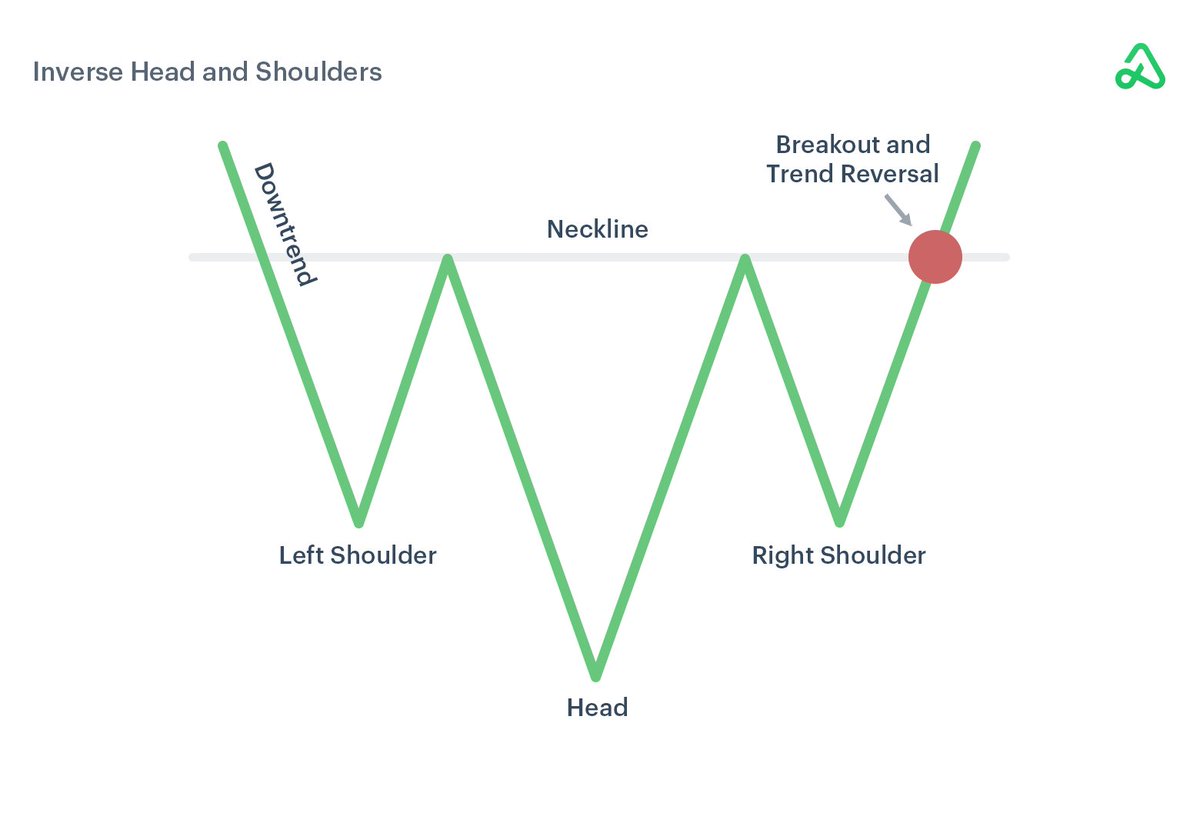
The inverse head and shoulders stock chart pattern is used to predict the reversal of a downward trend. It gets the name from having one longer peak, forming the head, and two level peaks on either side, which create the shoulders.
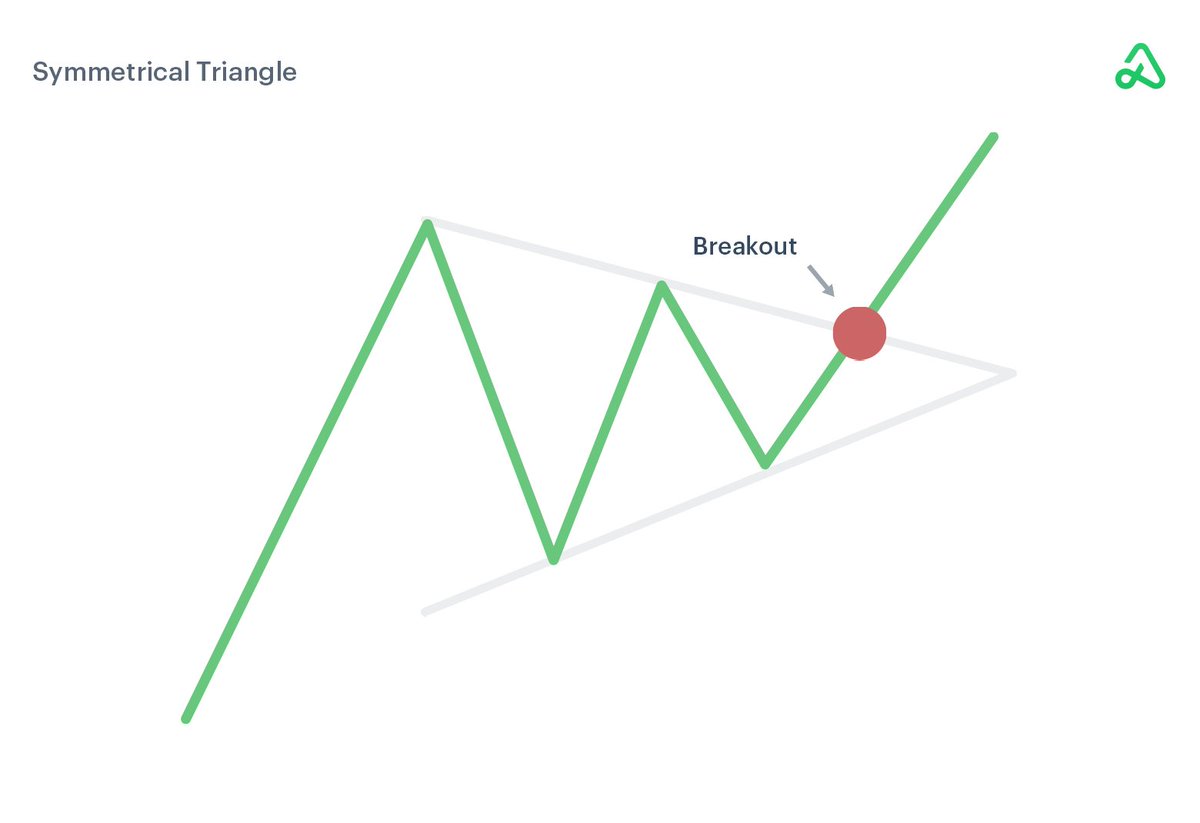
Thanks to the distinctive shape developed by the two trendlines that converge, the symmetrical triangle pattern is easy to spot.
This pattern occurs by drawing trendlines, which connect a series of peaks and troughs.
This pattern occurs by drawing trendlines, which connect a series of peaks and troughs.
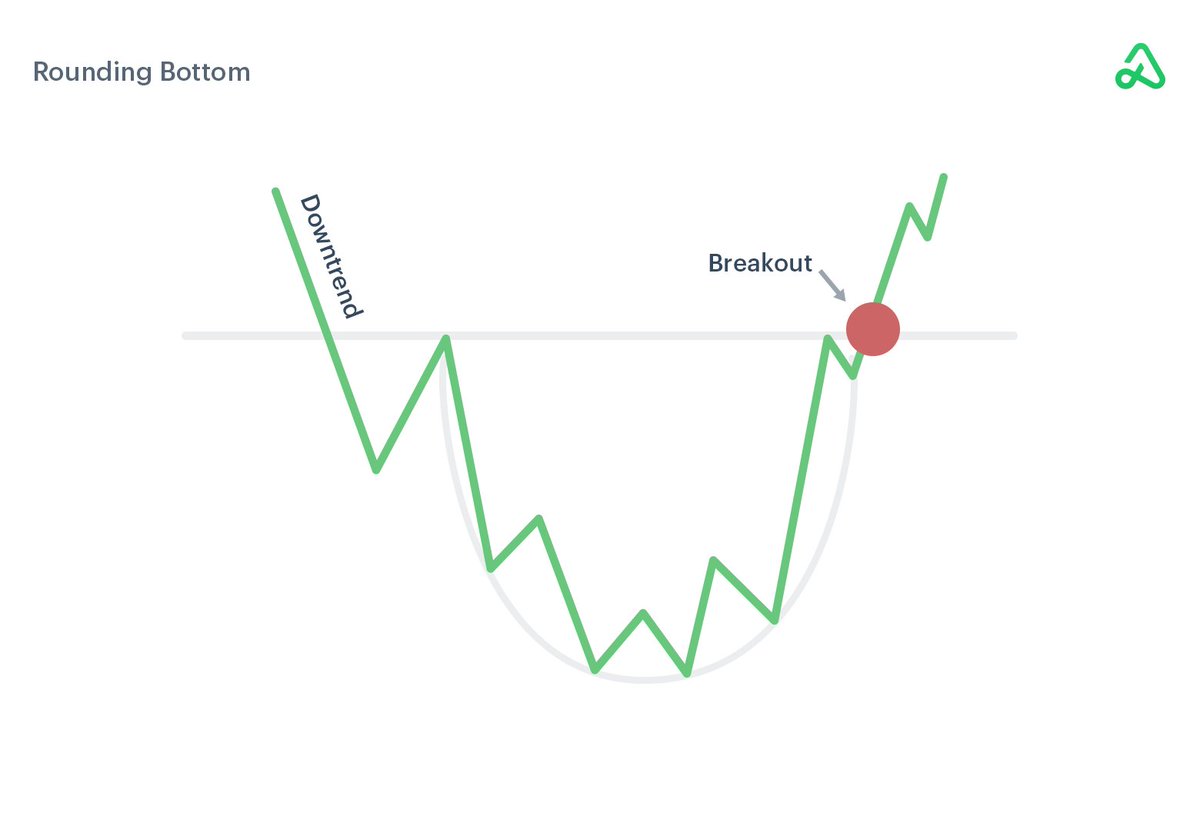
This pattern is sometimes also called a “saucer bottom” and demonstrates a long-term reversal showing that the stock is moving from a downward trend towards an upward trend instead. It can last any time from several months to years.
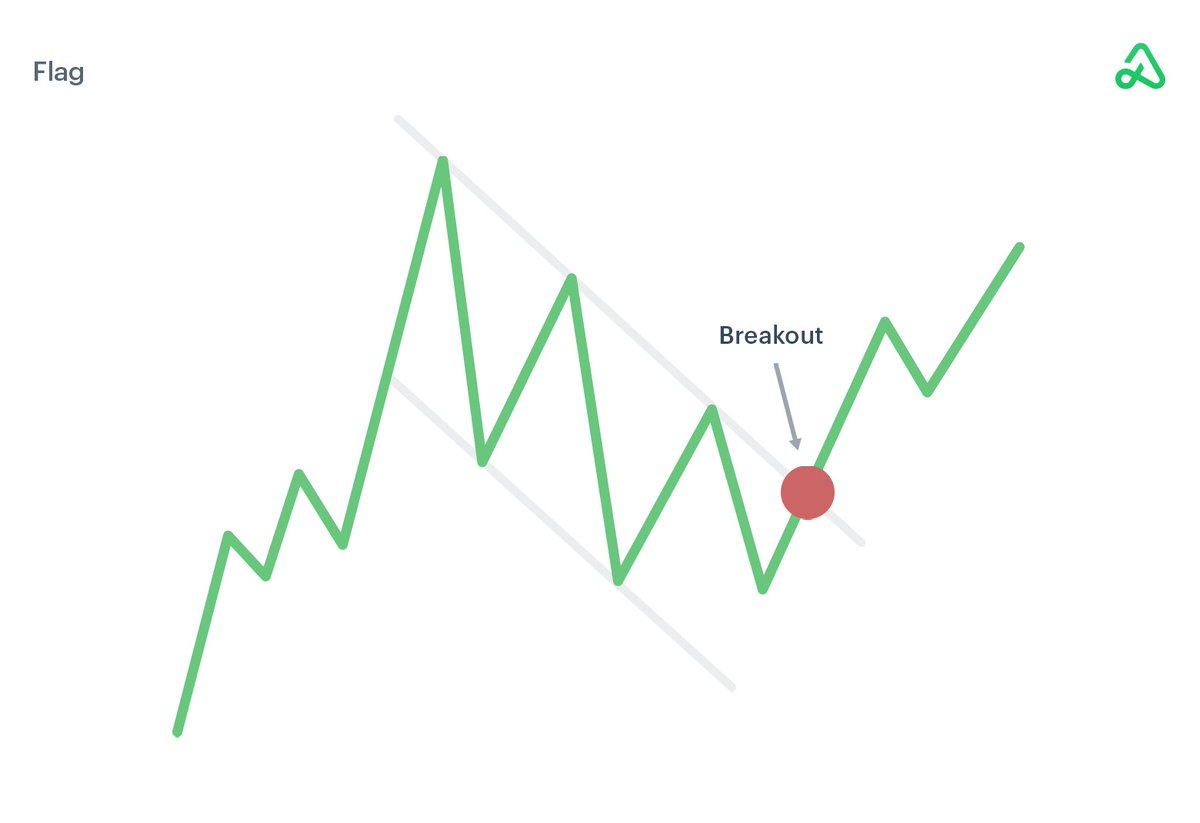
The flag stock chart pattern forms through a rectangle. The rectangle develops from two trendlines which form the support and resistance until the price breaks out. The flag will have sloping trendline & the slope should move in the opposite direction to the original price move.
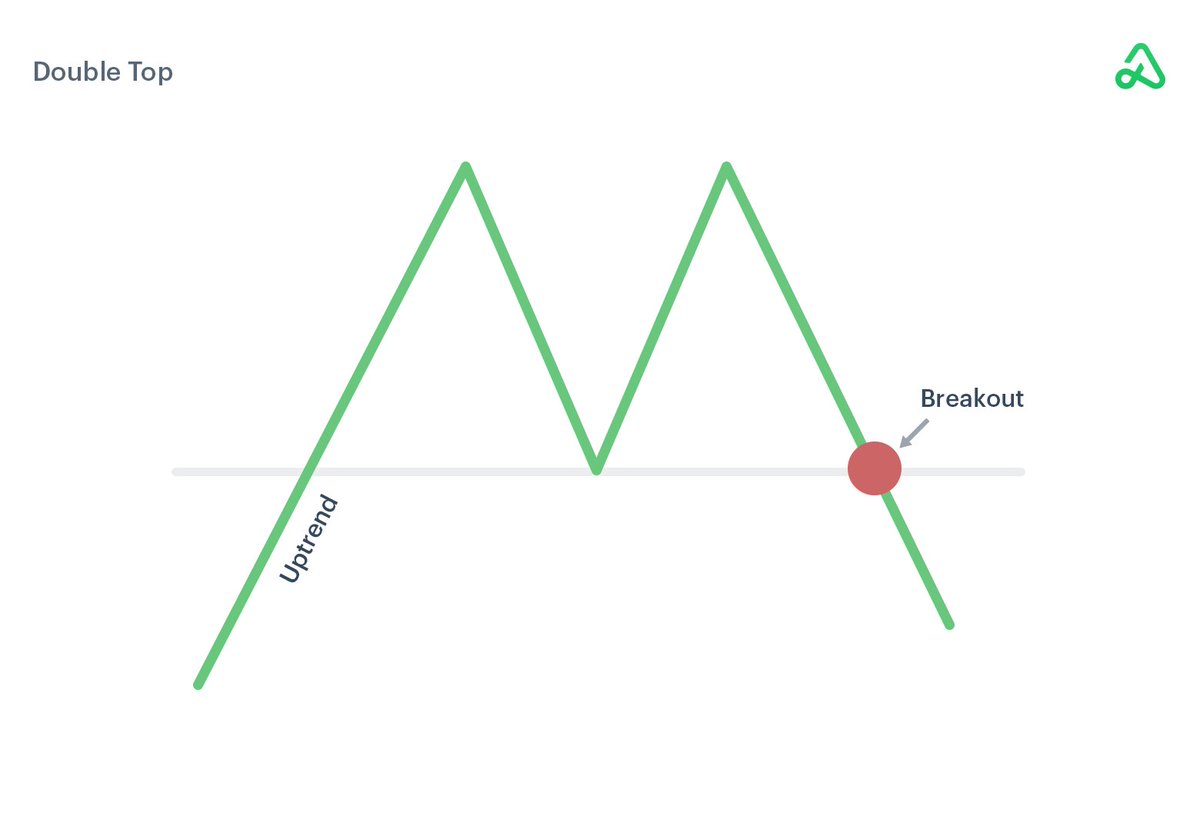
The double top is a bearish reversal pattern with two peaks, or highs, at approximately the same price level. The double top typically follows a long uptrend, and its "M" shape is easily recognizable.
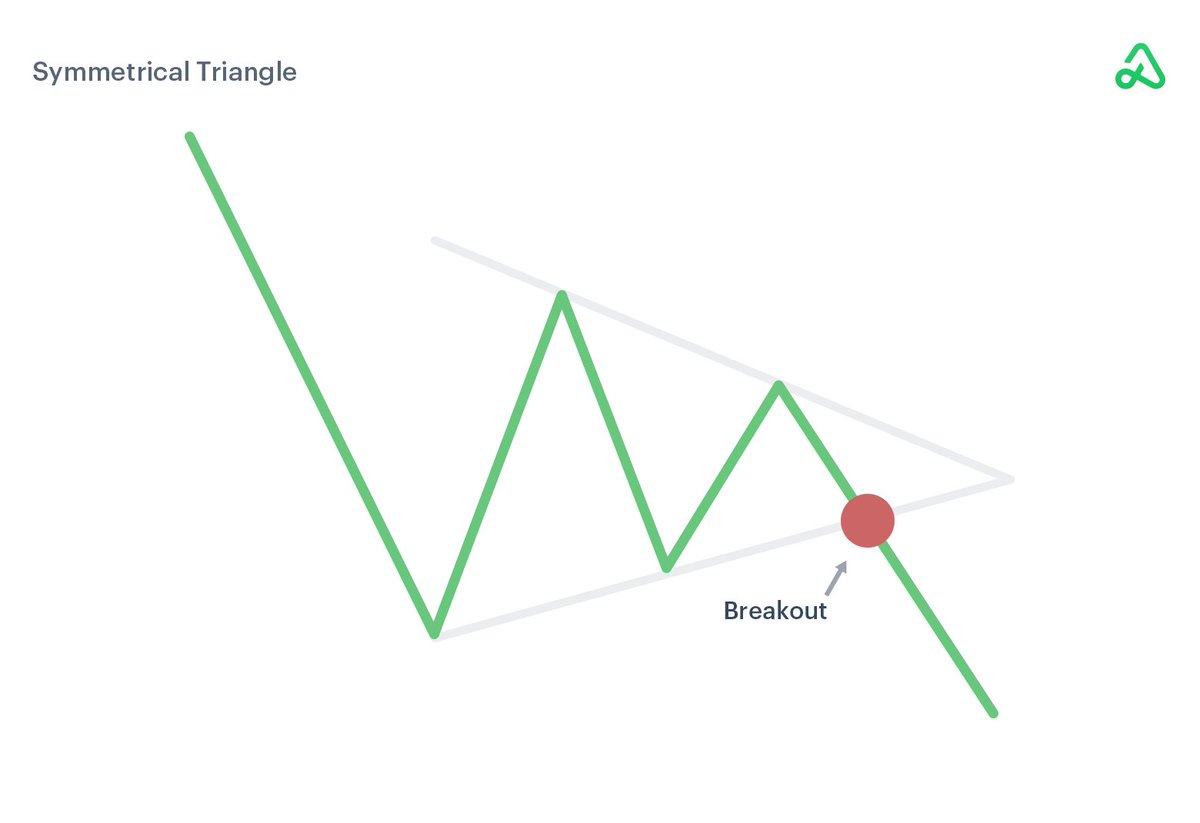
The symmetrical triangle pattern is easy to spot, thanks to the distinctive shape developed by the two trendlines that converge.
This pattern is created by drawing trendlines, which connect a series of peaks and troughs.
This pattern is created by drawing trendlines, which connect a series of peaks and troughs.
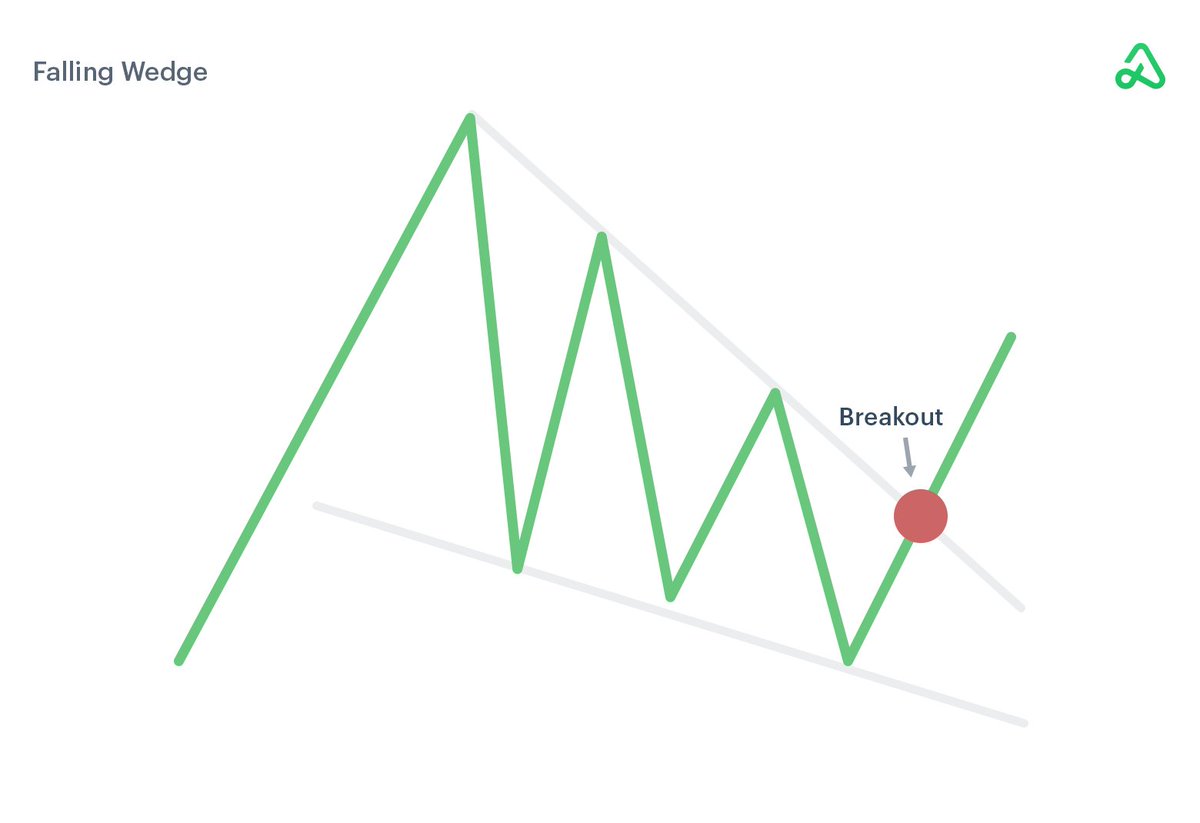
A falling wedge is a bullish pattern that can indicate either continuation or reversal, depending on its location.
Wedges are like triangles but slope opposite to the previous trend. In an uptrend, a falling wedge forms before a breakout to higher levels.
Wedges are like triangles but slope opposite to the previous trend. In an uptrend, a falling wedge forms before a breakout to higher levels.
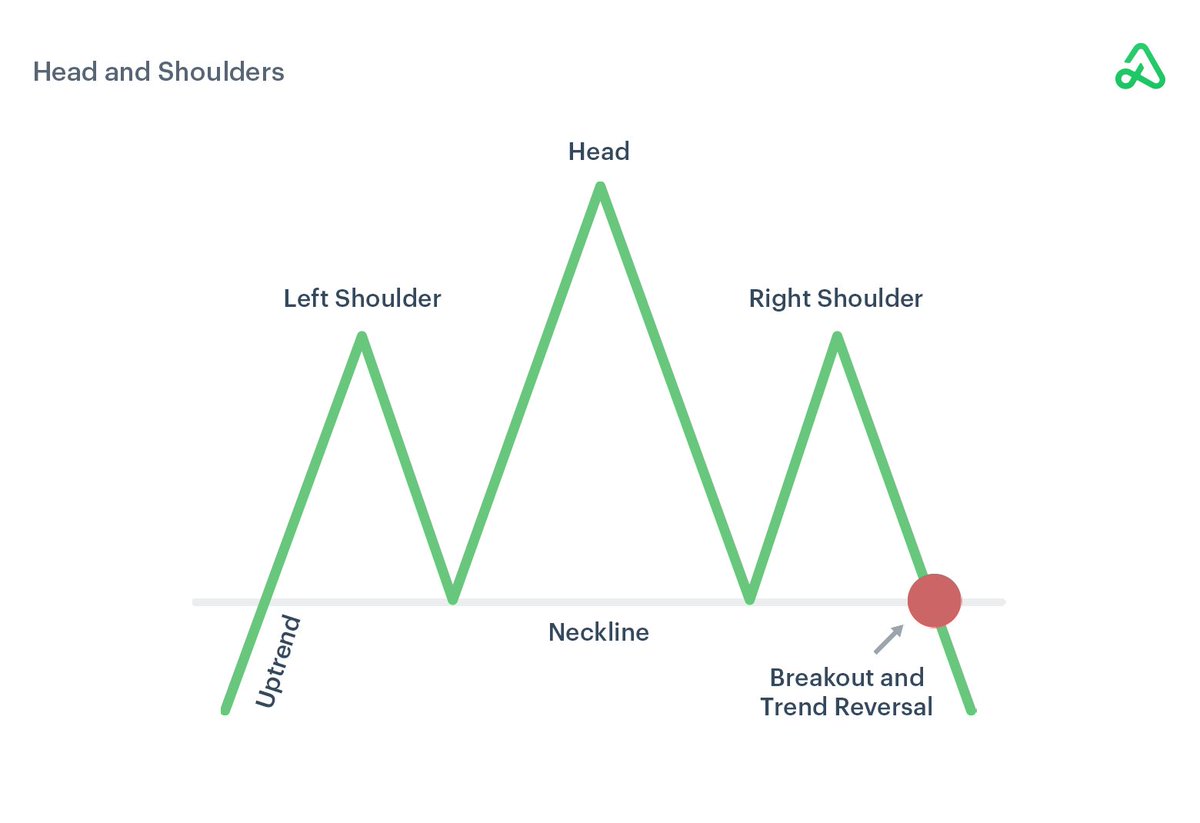
The head and shoulders stock chart pattern is used to predict the reversal of an uptrend. It is also sometimes called the “head and shoulders top.”
It gets the name from having one longer peak, forming the head, and two level peaks on either side, which create the shoulders.
It gets the name from having one longer peak, forming the head, and two level peaks on either side, which create the shoulders.
That's all about this thread !
I hope you've found this thread helpful.
Follow us @chartians for more.
For live stocks and options trade updates, you can join our Telegram Channel ⤵️
telegram.me
Like/Repost the quote below if you can:
I hope you've found this thread helpful.
Follow us @chartians for more.
For live stocks and options trade updates, you can join our Telegram Channel ⤵️
telegram.me
Like/Repost the quote below if you can:

Loading suggestions...