

Master thread on Fibonacci Retracement. 🔥🧵
In this thread, I will explain:
1. What is Fibonacci retracement
2. What are Fibonacci Retracement levels
3. What is the significance of retracement levels
4. How to find retracement levels
5. How to use the retracement levels
Before we get started, please retweet this thread and follow me @imfamousrajat for more technical insights. 🔥
⦿ What is Fibonacci retracement?
▪️ The Fibonacci tool is based on the Fibonacci sequence, a mathematical concept in which each number is the sum of the two preceding ones (e.g., 0, 1, 1, 2, 3, 5, 8, 13, and so on).
It is used in technical analysis to identify potential levels of support and resistance.
▪️ Fibonacci retracement levels are drawn by connecting two significant price points on a chart, typically a recent peak (high) and trough (low).
▪️ The key Fibonacci retracement levels include 23.6%, 38.2%, 50%, 61.8%, and 78.6%.
▪️ The Fibonacci tool is widely used by traders, leveraging the principle of a self-fulfilling prophecy.
This means that its effectiveness is often enhanced by the collective belief and actions of market participants who utilise and trust in its application, thereby influencing market dynamics.
⦿ What are Fibonacci Retracement levels?
▪️ Fibonacci levels are derived from Fibonacci numbers and each level corresponds to a specific percentage, indicating the extent to which the price retraces a prior move.
▪️ The retracement levels, represented by horizontal lines, serve as indicators of potential price stalling or reversal zones.
▪️ It's important to emphasize that these levels may or may not act as horizontal support or resistance points—there is a possibility but not a certainty. Hence, these levels should be viewed as areas of interest.
▪️ These key retracement levels are commonly set at 23.6%, 38.2%, 61.8%, and 78.6%.
Notably, while 50% is not a strictly Fibonacci ratio, it is still widely used as a significant support and resistance level due to its acknowledged importance by traders.
Significance of Fibonacci Retracement levels
The Fib levels can be used in plenty of ways but the most common usage is as follows:
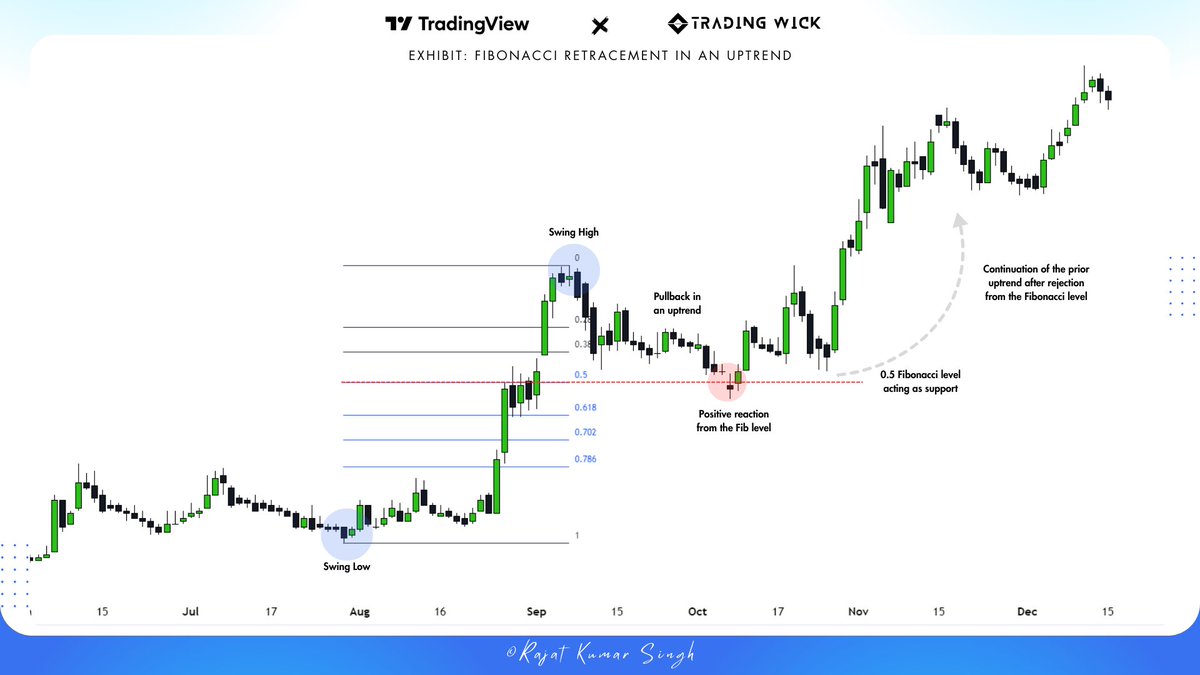
▪️ Price Reversal Zones: The Fibonacci retracement levels are strategically placed to identify zones of interest.
For example: Consider a stock in an uptrend.
Following an upward movement, it retraces to the 61.8% Fibonacci level. Subsequently, the stock resumes its upward trajectory. Given that the bounce took place at a retracement level within the existing uptrend, traders may consider initiating long positions.
▪️ Entry/Exit confirmation: Traders often use Fibonacci retracement in conjunction with other tools to confirm potential entry or exit points.
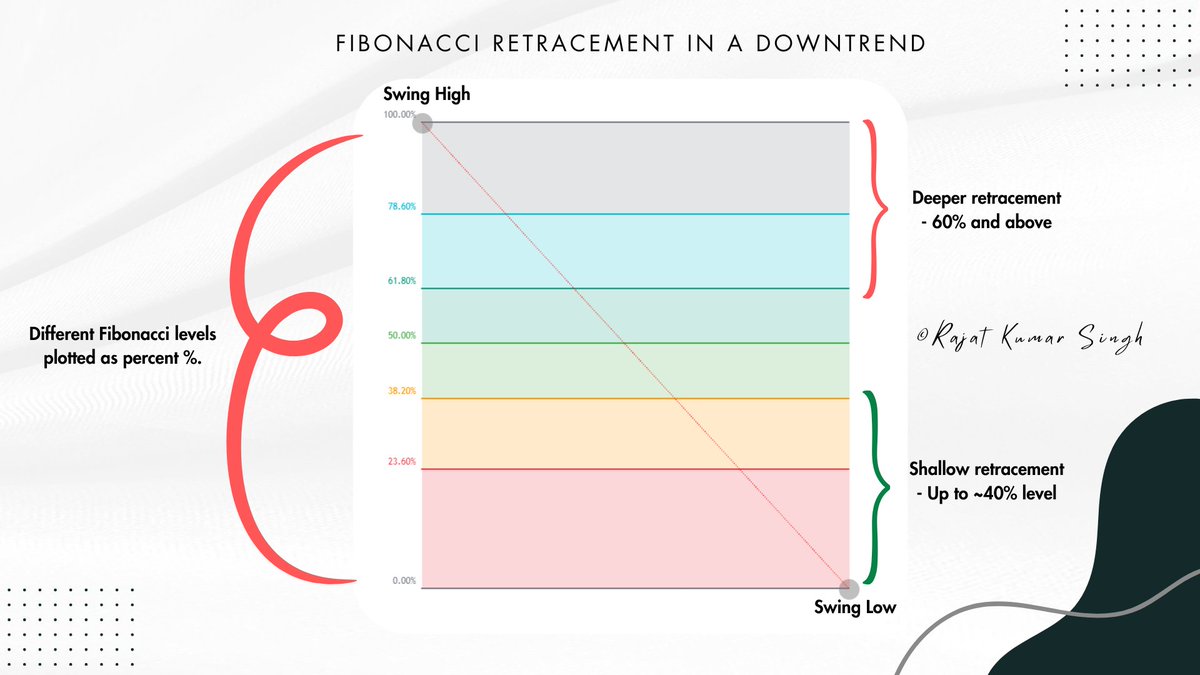
▪️ Trend Strength Assessment: Fibonacci retracement helps traders in gauging the strength of a trend.
If a retracement is shallow (23.6% or 38.2%), it may indicate a strong trend, while deeper retracements (61.8% or 78.6%) might suggest a weaker trend or potential trend reversal.
In this thread, I will explain:
1. What is Fibonacci retracement
2. What are Fibonacci Retracement levels
3. What is the significance of retracement levels
4. How to find retracement levels
5. How to use the retracement levels
Before we get started, please retweet this thread and follow me @imfamousrajat for more technical insights. 🔥
⦿ What is Fibonacci retracement?
▪️ The Fibonacci tool is based on the Fibonacci sequence, a mathematical concept in which each number is the sum of the two preceding ones (e.g., 0, 1, 1, 2, 3, 5, 8, 13, and so on).
It is used in technical analysis to identify potential levels of support and resistance.
▪️ Fibonacci retracement levels are drawn by connecting two significant price points on a chart, typically a recent peak (high) and trough (low).
▪️ The key Fibonacci retracement levels include 23.6%, 38.2%, 50%, 61.8%, and 78.6%.
▪️ The Fibonacci tool is widely used by traders, leveraging the principle of a self-fulfilling prophecy.
This means that its effectiveness is often enhanced by the collective belief and actions of market participants who utilise and trust in its application, thereby influencing market dynamics.
⦿ What are Fibonacci Retracement levels?
▪️ Fibonacci levels are derived from Fibonacci numbers and each level corresponds to a specific percentage, indicating the extent to which the price retraces a prior move.
▪️ The retracement levels, represented by horizontal lines, serve as indicators of potential price stalling or reversal zones.
▪️ It's important to emphasize that these levels may or may not act as horizontal support or resistance points—there is a possibility but not a certainty. Hence, these levels should be viewed as areas of interest.
▪️ These key retracement levels are commonly set at 23.6%, 38.2%, 61.8%, and 78.6%.
Notably, while 50% is not a strictly Fibonacci ratio, it is still widely used as a significant support and resistance level due to its acknowledged importance by traders.
Significance of Fibonacci Retracement levels
The Fib levels can be used in plenty of ways but the most common usage is as follows:
▪️ Price Reversal Zones: The Fibonacci retracement levels are strategically placed to identify zones of interest.
For example: Consider a stock in an uptrend.
Following an upward movement, it retraces to the 61.8% Fibonacci level. Subsequently, the stock resumes its upward trajectory. Given that the bounce took place at a retracement level within the existing uptrend, traders may consider initiating long positions.
▪️ Entry/Exit confirmation: Traders often use Fibonacci retracement in conjunction with other tools to confirm potential entry or exit points.
▪️ Trend Strength Assessment: Fibonacci retracement helps traders in gauging the strength of a trend.
If a retracement is shallow (23.6% or 38.2%), it may indicate a strong trend, while deeper retracements (61.8% or 78.6%) might suggest a weaker trend or potential trend reversal.


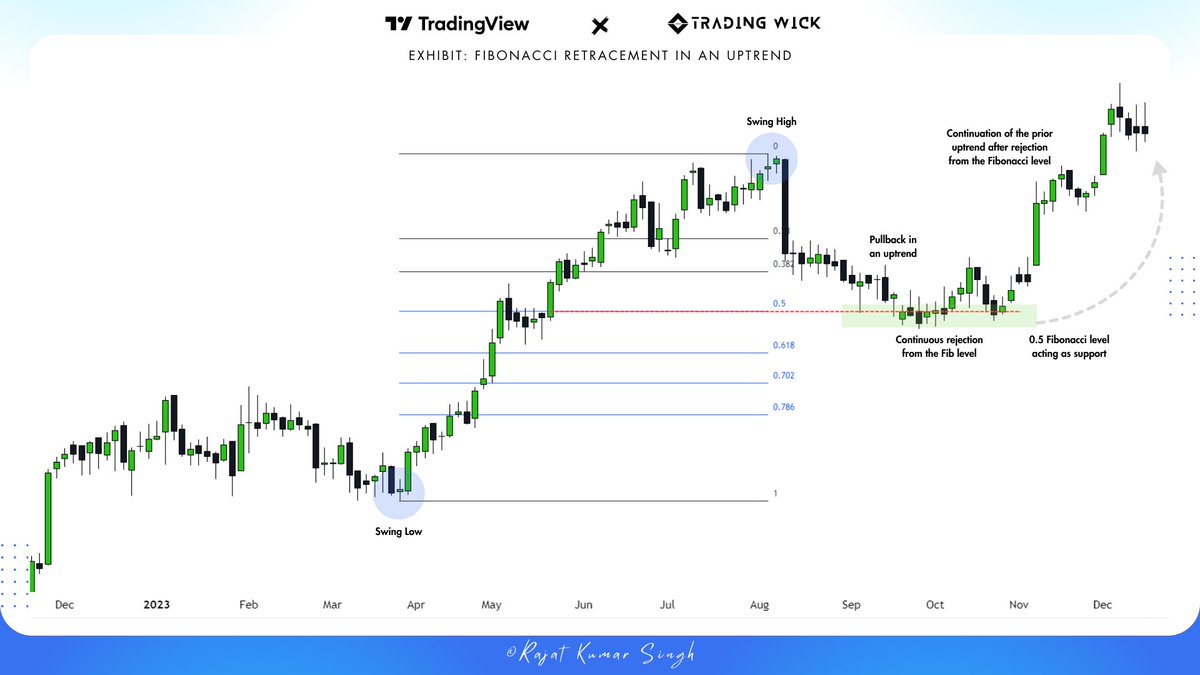
⦿ How to find Fibonacci Retracement levels
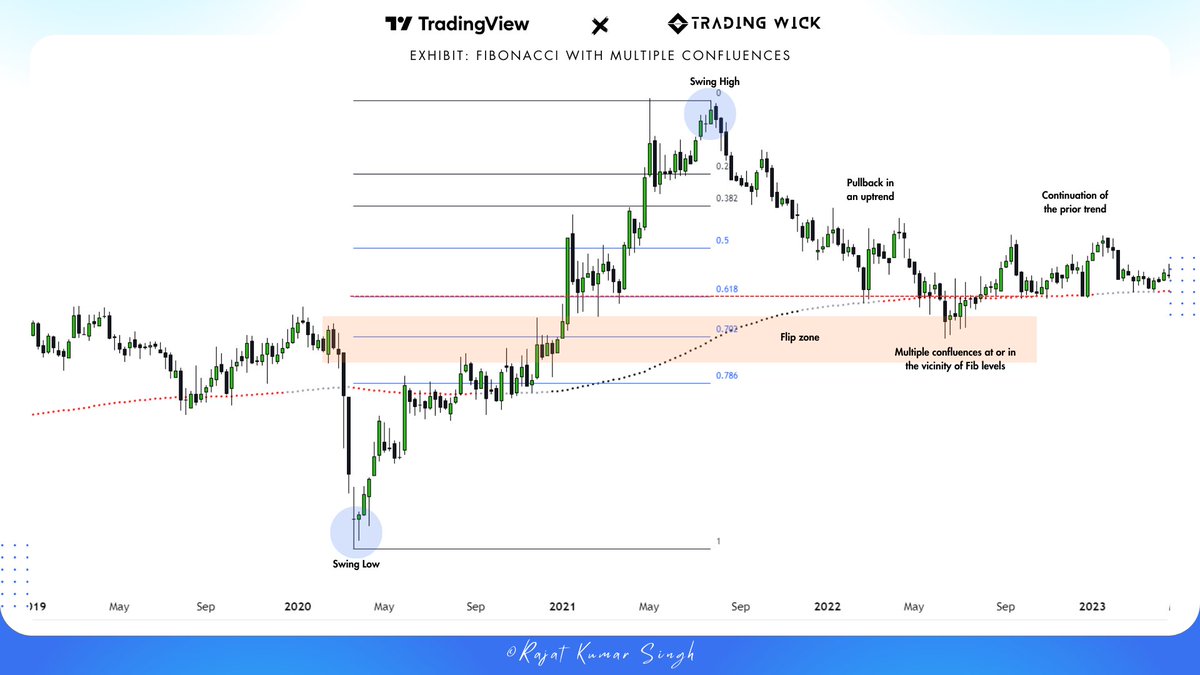
To determine retracement levels, the initial step involves identifying the recent significant swing high and swing low, following which the Fibonacci tool is employed for plotting the levels.
Fibonacci retracement in an uptrend: First select the swing low and then the swing high.
To determine retracement levels, the initial step involves identifying the recent significant swing high and swing low, following which the Fibonacci tool is employed for plotting the levels.
Fibonacci retracement in an uptrend: First select the swing low and then the swing high.

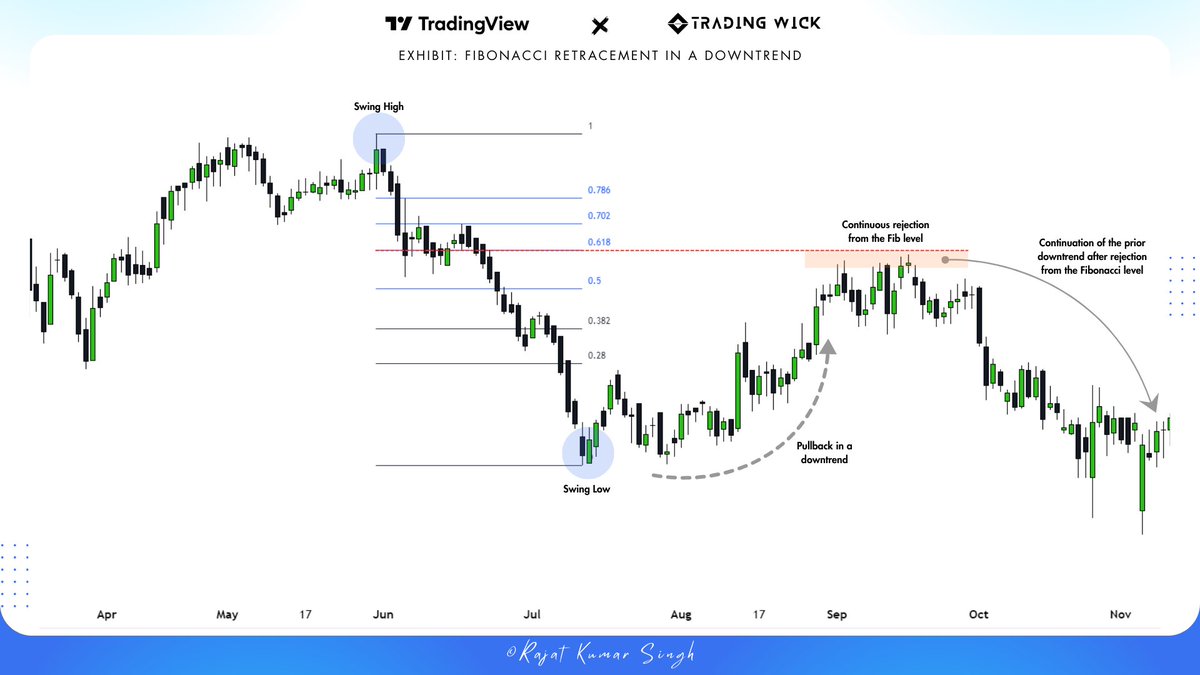
Fibonacci retracement in a downtrend: First select the swing high and then the swing low.

⦿ How to use the retracement levels?
Combining Fibonacci levels with other common tools can be useful in creating confluence zones of interest.
When the price approaches a Fibonacci level, you should look for the following things at the point of interaction or in the proximity of the level.
- Reversal candlestick patterns
- Volume
- Moving averages
- RSI divergence
- Previous support/resistance level

Hope this was helpful. 🙂
If you want to read more such informative content, please retweet the first tweet and follow me @imfamousrajat for more such informative content. 🔥
If you want to read more such informative content, please retweet the first tweet and follow me @imfamousrajat for more such informative content. 🔥
Loading suggestions...