

This simple trick can help you find explosive breakout stocks using RSI (THREAD):
(1) Open your charting platform and pick the RSI Indicator.
Set the upper RSI band at 60 to identify explosive breakout opportunities, following the steps illustrated in the video.
Set the upper RSI band at 60 to identify explosive breakout opportunities, following the steps illustrated in the video.

(2) Now, plot the 50-EMA to protect yourself from false breakouts and trade in line with the trend.
When you see stock trading above the 50-EMA, and the price is consolidating for a few days to weeks, with the (RSI) below 60, be on the lookout for possible breakouts.
When you see stock trading above the 50-EMA, and the price is consolidating for a few days to weeks, with the (RSI) below 60, be on the lookout for possible breakouts.
(3) Now, let's explore how you can identify potential explosive breakouts on charts using this RSI strategy.
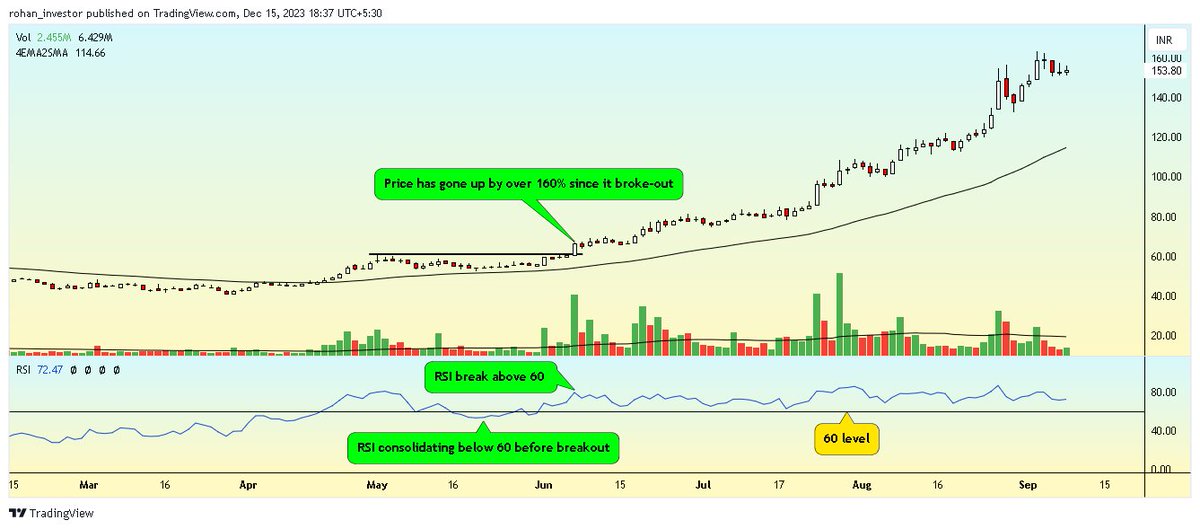
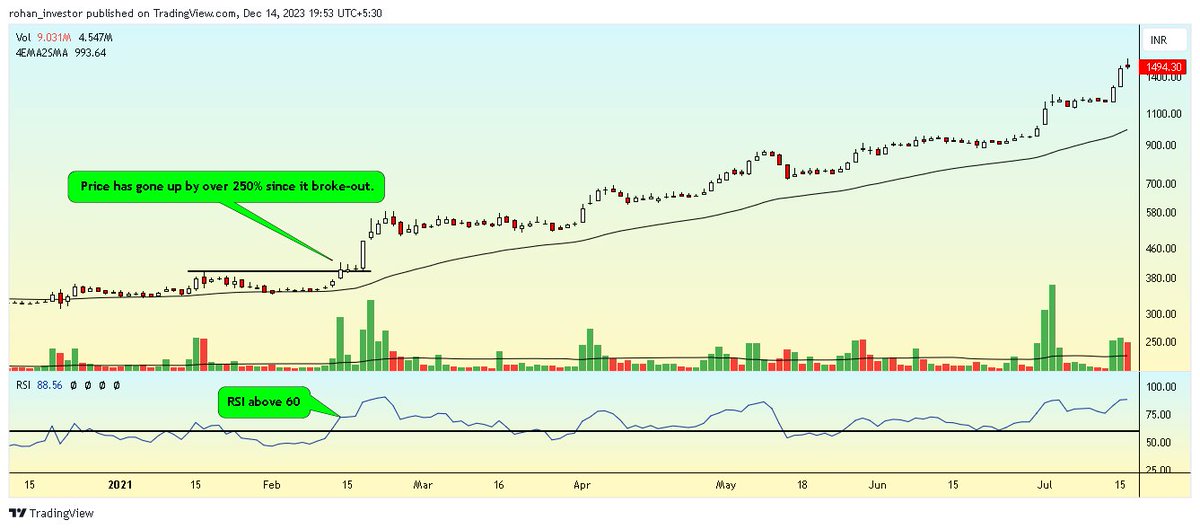

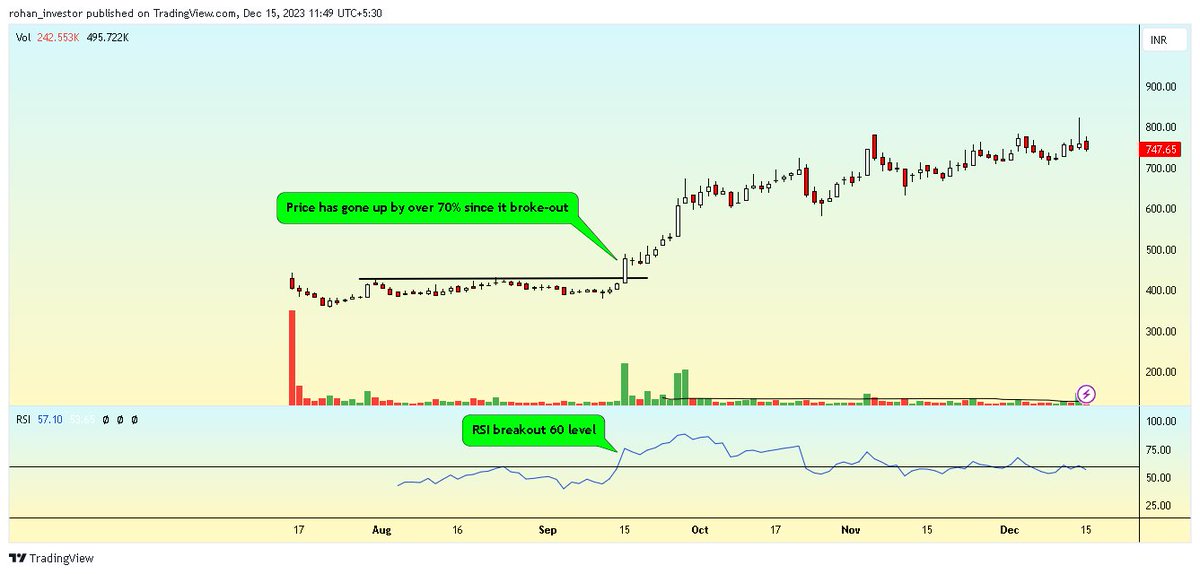
(4) You can use the 'RSI explosive breakout' strategy on any timeframe.
Let's explore a few more chart examples for better understanding.
Let's explore a few more chart examples for better understanding.

(5) Stop loss condition:
Set a 10% stop loss from the breakout point if it doesn't move as anticipated.
Let's say you bought XYZ stock at 100, set the stop loss at 90, which is 10% below the breakout point.
Set a 10% stop loss from the breakout point if it doesn't move as anticipated.
Let's say you bought XYZ stock at 100, set the stop loss at 90, which is 10% below the breakout point.
(6) Sell rule condition:
Follow the 50-day moving average (DMA) trailing stop loss. If the price is consistently higher than the DMA, continue holding.
Once the price loses momentum and drops below the 50 DMA, sell your holdings and celebrate the multibagger gains.
Follow the 50-day moving average (DMA) trailing stop loss. If the price is consistently higher than the DMA, continue holding.
Once the price loses momentum and drops below the 50 DMA, sell your holdings and celebrate the multibagger gains.
Thread #121 - That's a wrap!
If you found this useful:
(1) Follow me @rohaninvestor for more such threads. I write a new thread every week simplifying trading/investing concepts.
(2) Bookmark this thread for future.
If you found this useful:
(1) Follow me @rohaninvestor for more such threads. I write a new thread every week simplifying trading/investing concepts.
(2) Bookmark this thread for future.
Loading suggestions...