

Breakout and Potential Breakout Stocks of the #Chemical Sector.📊
A thread on Chemical Sector Stocks🧵🧵
1. PIDILITIND (WTF)
•Strong breakout chart
•Sym triangle pattern
•Long-range accumulation
•Overall trading in HH-HL formation
•Huge vol buildup near the breakout zone
A thread on Chemical Sector Stocks🧵🧵
1. PIDILITIND (WTF)
•Strong breakout chart
•Sym triangle pattern
•Long-range accumulation
•Overall trading in HH-HL formation
•Huge vol buildup near the breakout zone

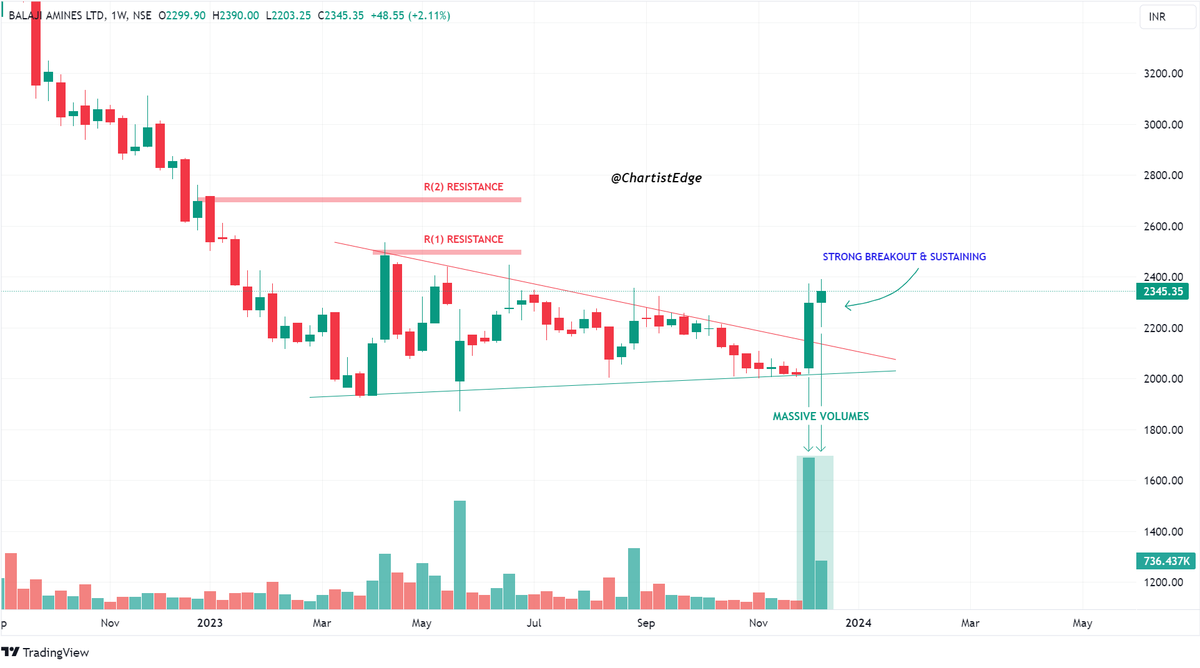
2. BALAMINES (WTF)
•Strong breakout chart
•Symmetrical triangle pattern
•Massive volume buildup near the breakout zone
•R(1)/R(2) resistance levels can act as good resistance levels.
•Strong breakout chart
•Symmetrical triangle pattern
•Massive volume buildup near the breakout zone
•R(1)/R(2) resistance levels can act as good resistance levels.
3. FLUOROCHEM (WTF)
•Strong breakout chart
•Symmetrical triangle pattern
•Long-range accumulation
•Huge volume buildup near the breakout zone
Note: Liquidity grabbed from the lower levels which means that the price is poised to give a good upside momentum
•Strong breakout chart
•Symmetrical triangle pattern
•Long-range accumulation
•Huge volume buildup near the breakout zone
Note: Liquidity grabbed from the lower levels which means that the price is poised to give a good upside momentum

4. DEEPAKNTR (WTF)
•Potential breakout chart
•Darvas box pattern
•Long range accumulation(97 weeks)
•Good volume buildup near the breakout zone but should rise post-breakout
•R(1)/R(2) can act as good resistance levels after the price breaks out of the consolidation zone
•Potential breakout chart
•Darvas box pattern
•Long range accumulation(97 weeks)
•Good volume buildup near the breakout zone but should rise post-breakout
•R(1)/R(2) can act as good resistance levels after the price breaks out of the consolidation zone

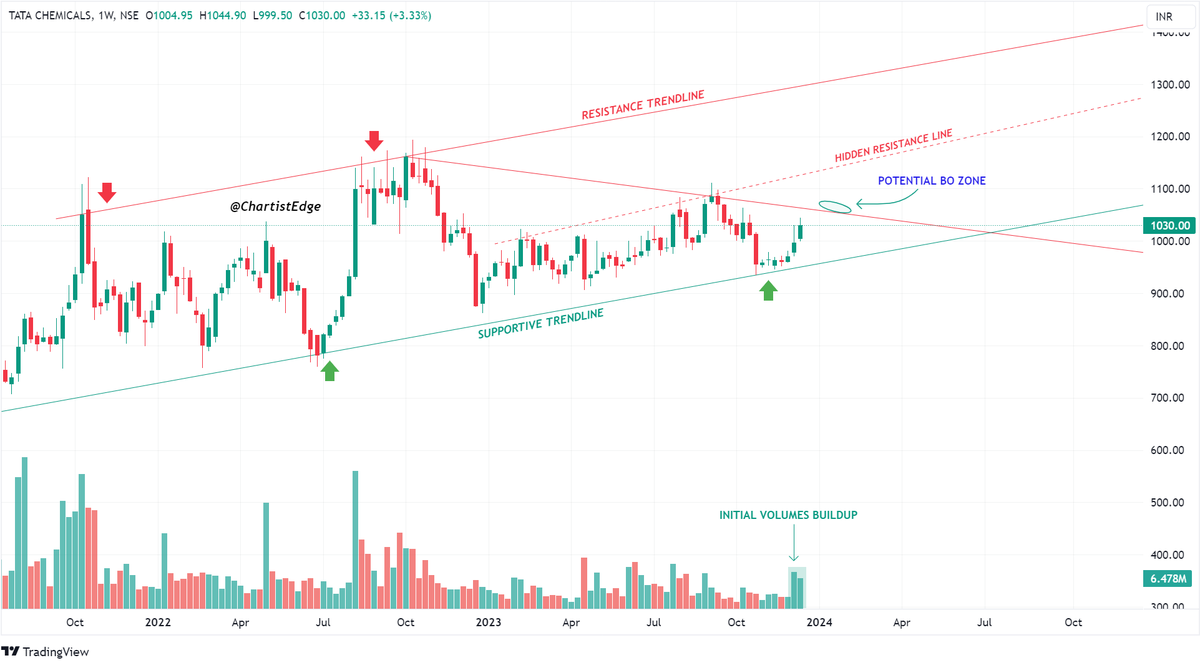
5. TATACHEM (WTF)
•Potential breakout chart
•Symmetrical triangle pattern
•Price is moving in a HH-HL formation with each low being protected
•Volume is building up near the breakout zone and should rise post-breakout.
•Potential breakout chart
•Symmetrical triangle pattern
•Price is moving in a HH-HL formation with each low being protected
•Volume is building up near the breakout zone and should rise post-breakout.
6. CLEAN (WTF)
•Potential breakout chart
•Darvas box pattern
•Long-range accumulation(53 weeks)
•Huge volume buildup near the breakout zone
•R(1)/R(2)/R(3) can act as good resistance levels once the price breaks out of the consolidation zone
•Potential breakout chart
•Darvas box pattern
•Long-range accumulation(53 weeks)
•Huge volume buildup near the breakout zone
•R(1)/R(2)/R(3) can act as good resistance levels once the price breaks out of the consolidation zone

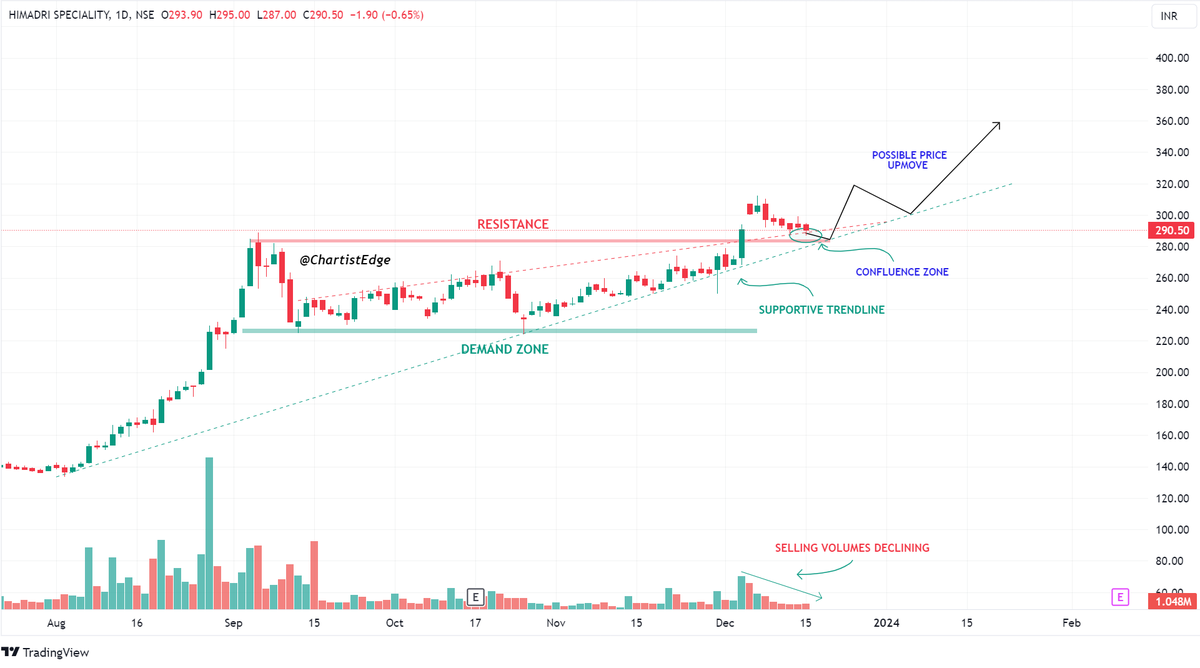
7. HSCL (DTF)
•Support-based setup
•After giving a breakout, the price is currently trying to retest its breakout levels.
•The price is currently trading near the confluence zone and the price should bounce back from these levels as per the price action
•Support-based setup
•After giving a breakout, the price is currently trying to retest its breakout levels.
•The price is currently trading near the confluence zone and the price should bounce back from these levels as per the price action
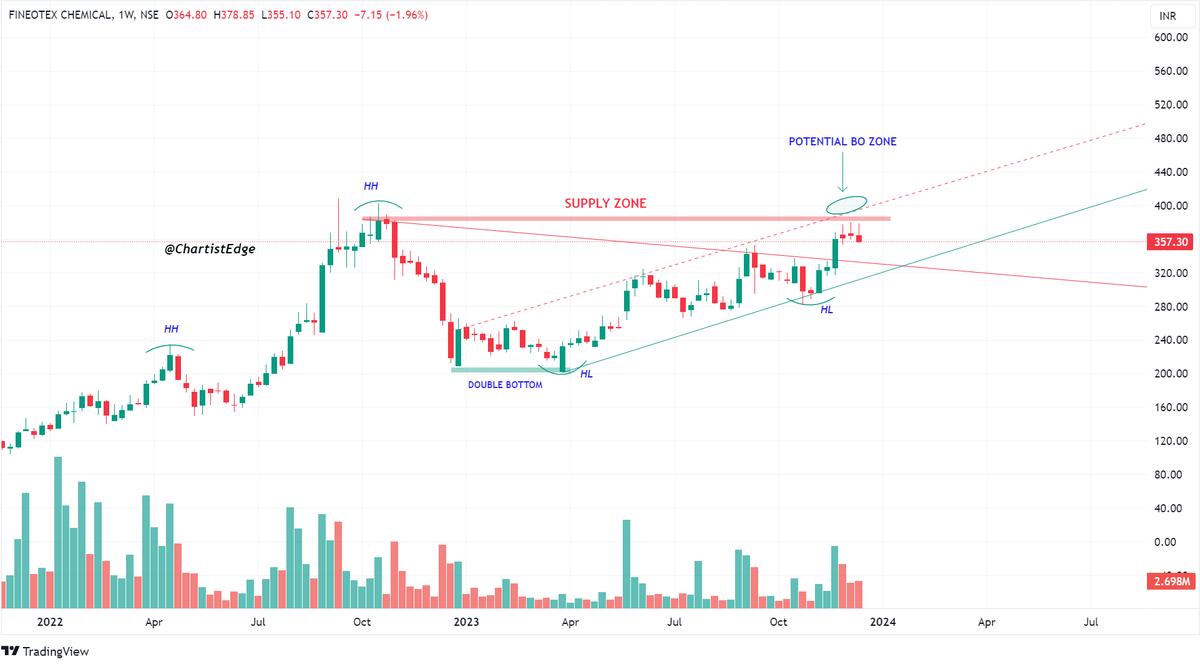
8. FCL (WTF)
•Potential breakout chart
•Symmetrical triangle pattern
•Overall trading in a HH-HL formation
•The price should give a good upside move if the price sustains above the supply zone levels
•Potential breakout chart
•Symmetrical triangle pattern
•Overall trading in a HH-HL formation
•The price should give a good upside move if the price sustains above the supply zone levels
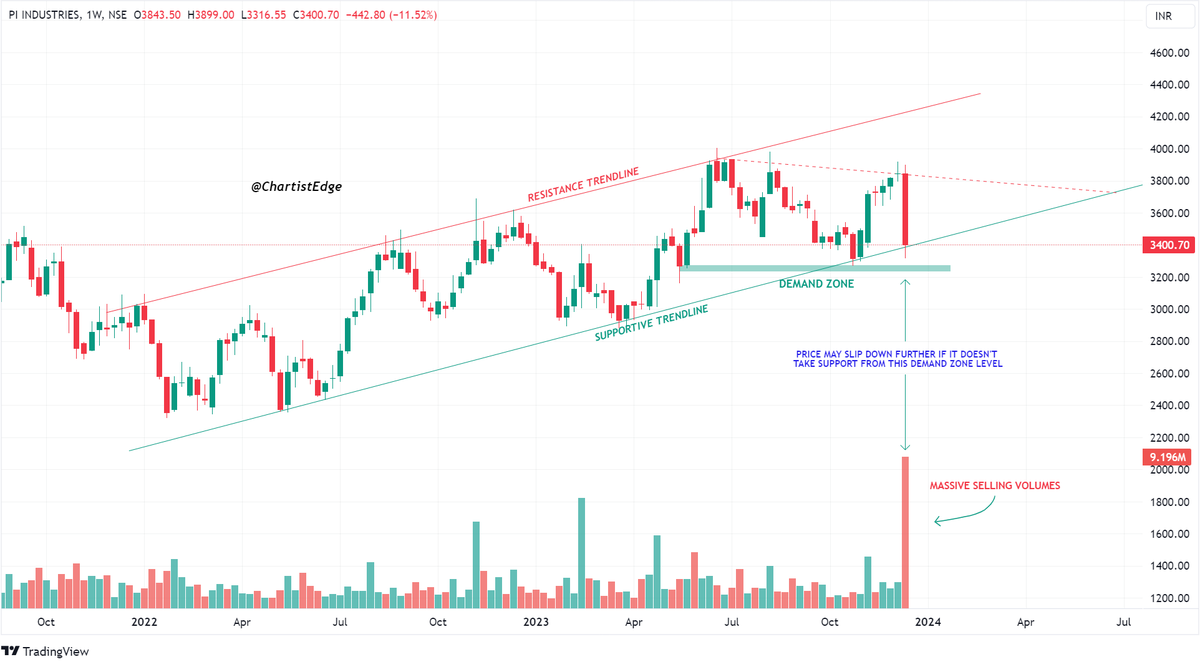
9. PIIND (WTF)
•The price is currently trading near the demand zone
•Massive selling volumes indicate that the price is weak and may slip down even more.
•If the price sustains above the demand zone levels then we can expect a bounce back in the near future
•The price is currently trading near the demand zone
•Massive selling volumes indicate that the price is weak and may slip down even more.
•If the price sustains above the demand zone levels then we can expect a bounce back in the near future
Loading suggestions...