

This indicator presents an alternative approach to identify Market Structure. The logic used is derived from learning material created by @DaveTeachesFX
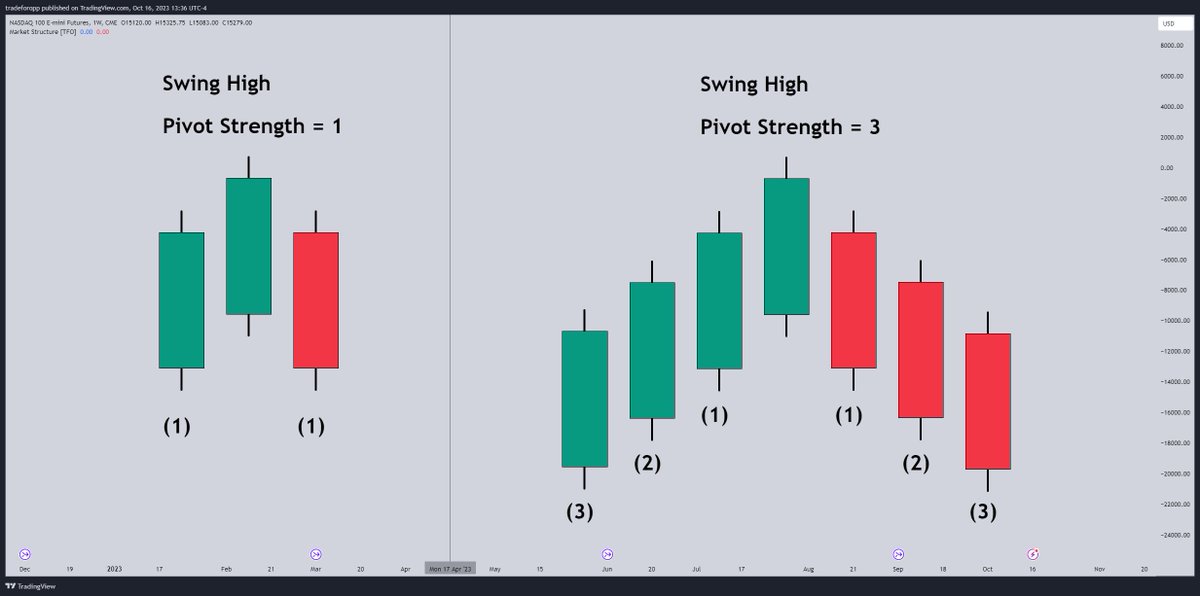
When quantifying Market Structure, it is common to use fractal highs and lows to identify "significant" swing pivots
When quantifying Market Structure, it is common to use fractal highs and lows to identify "significant" swing pivots
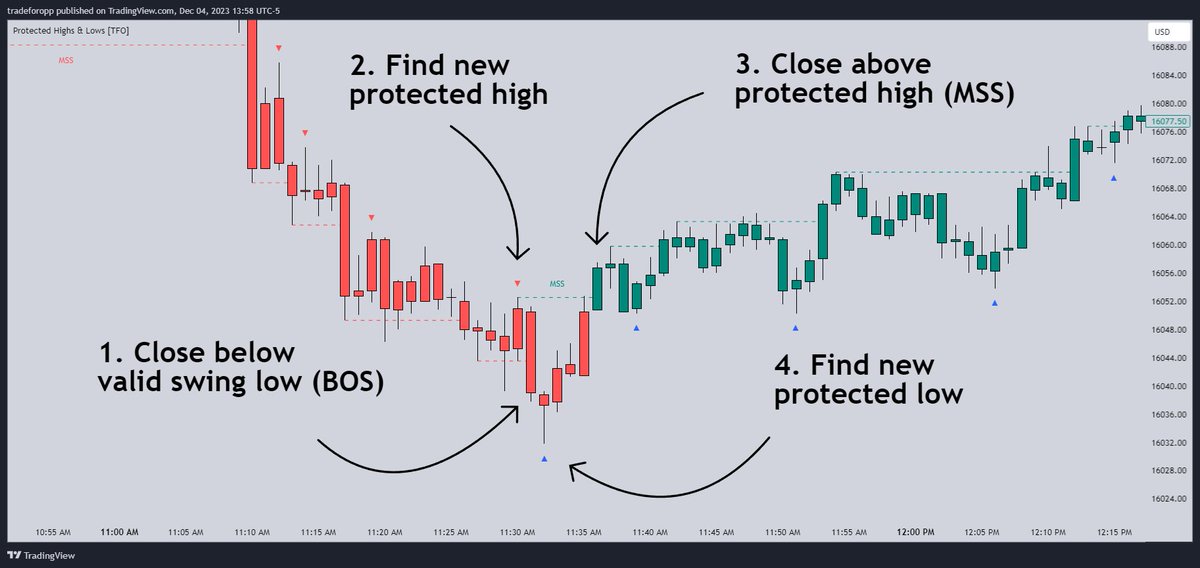
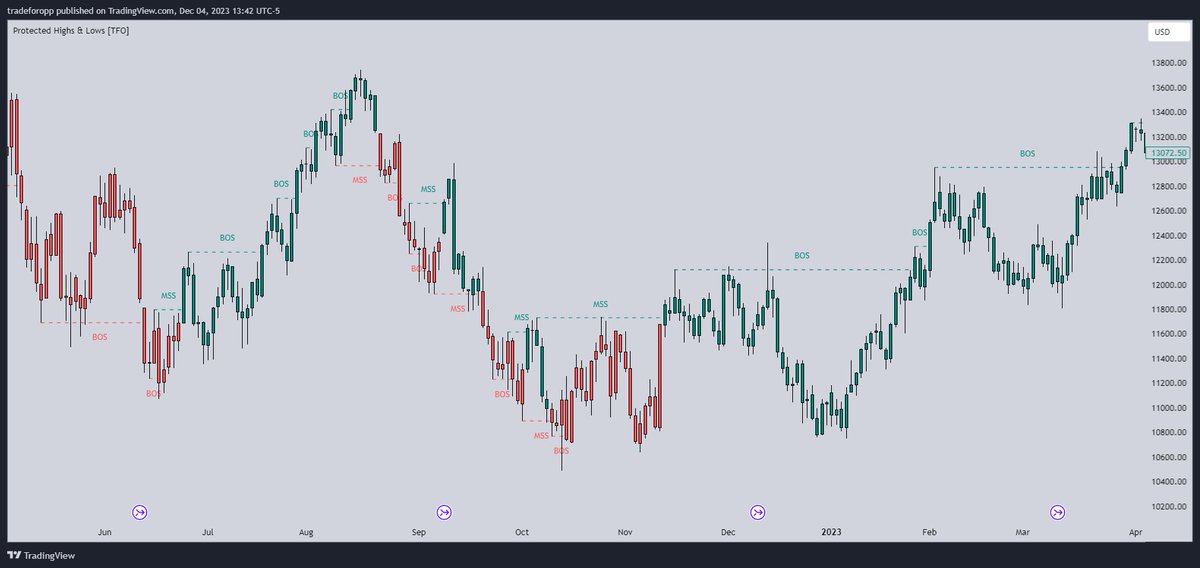
When price closes through these pivots, we may identify a MSS for reversals or a BOS for continuations. The main difference with this "protected" logic is in how we determine the pivots/levels that are utilized to determine a valid MSS or BOS
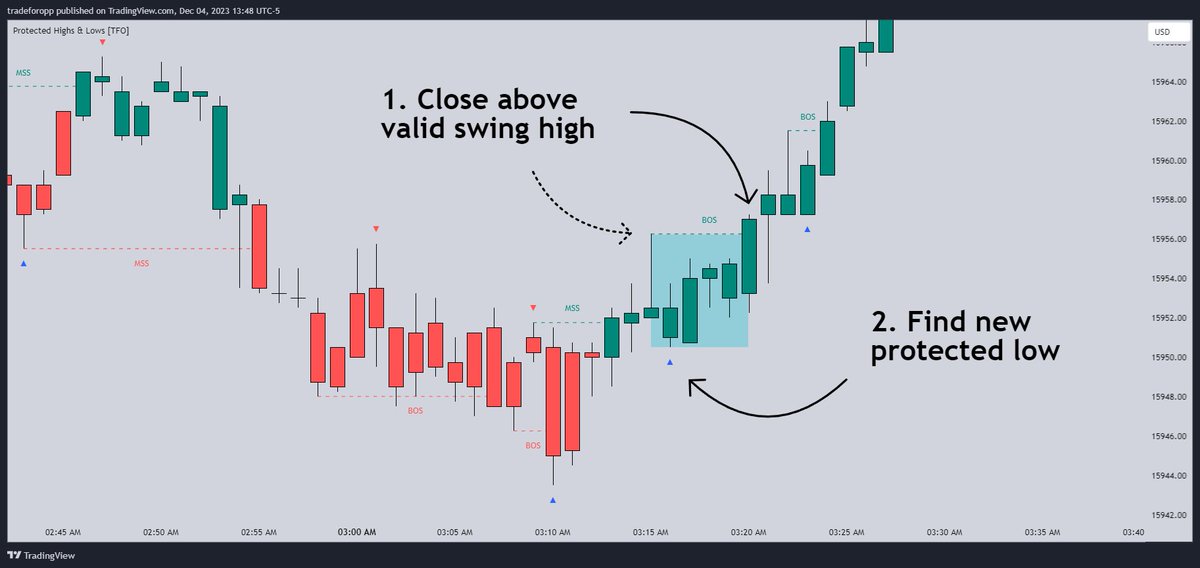
BOS: When price closes above a valid swing high, we look back from the current bar to find the lowest low that was made in that range - this becomes our protected low
MSS: If the current trend is bearish and we're looking for a bullish reversal, we would need price to close above the most recent protected high. When this happens, we still look back to find the lowest low that was created in that range, and make that our new protected low
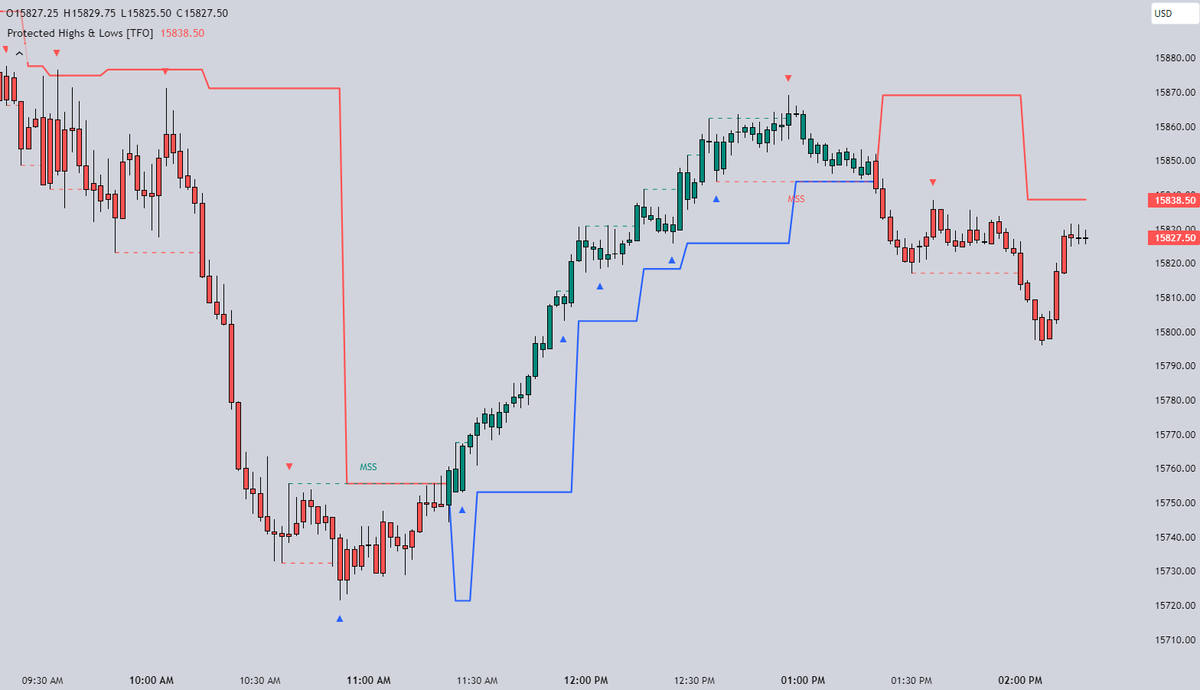
The Trend Candles option allows users to easily visualize the current state of Market Structure with bullish and bearish colors. Users may also show BOS and MSS labels if desired
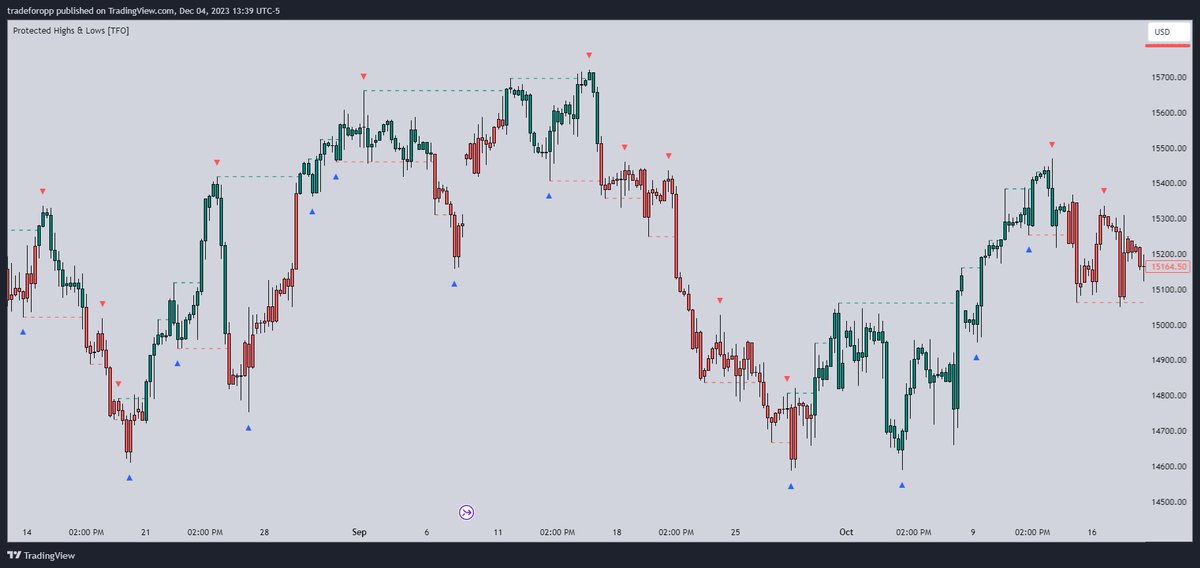
Show Protected Highs & Lows will annotate the protected highs and lows, just note that the labels themselves are plotted in the past due to the lookback function required to identify them
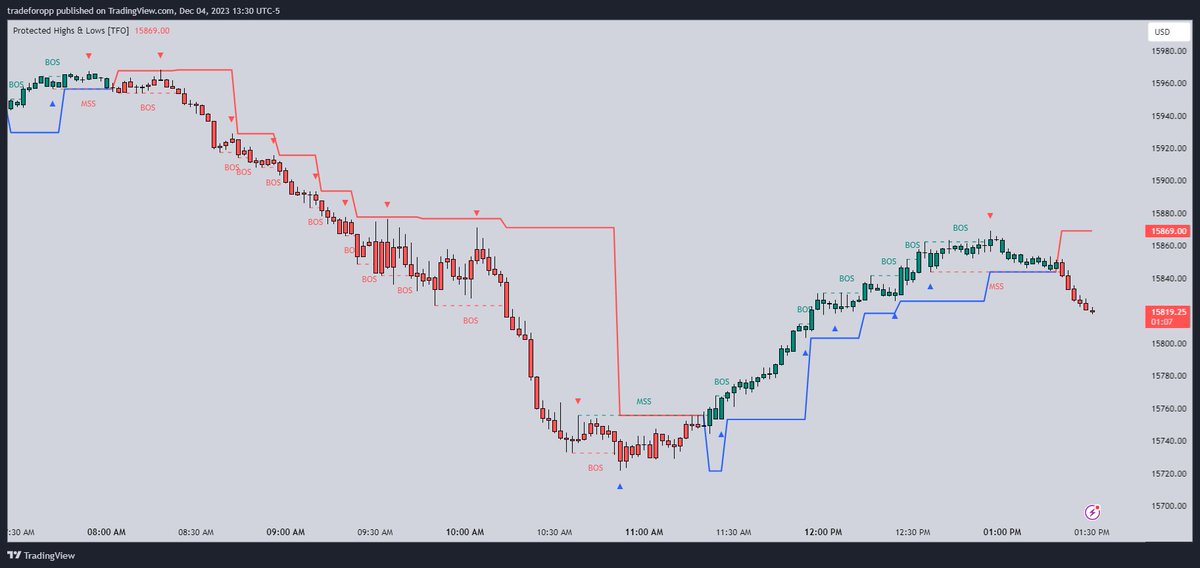
Lastly, the Show Protected Trail option will draw a line to essentially indicate a trailing stop-like line to denote the most recent protected low (if bullish) or protected high (if bearish)
Get access here: tradingview.com
Get access here: tradingview.com
Loading suggestions...