

Data Analysis is always a tedious task for beginners. Specifically for traders who wants to find out details like no of Gap days, how market moved on expiry days vs non expiry days, volatility of the market etc. But with ChatGPT anyone could do these analysis easily. Here's how🧵
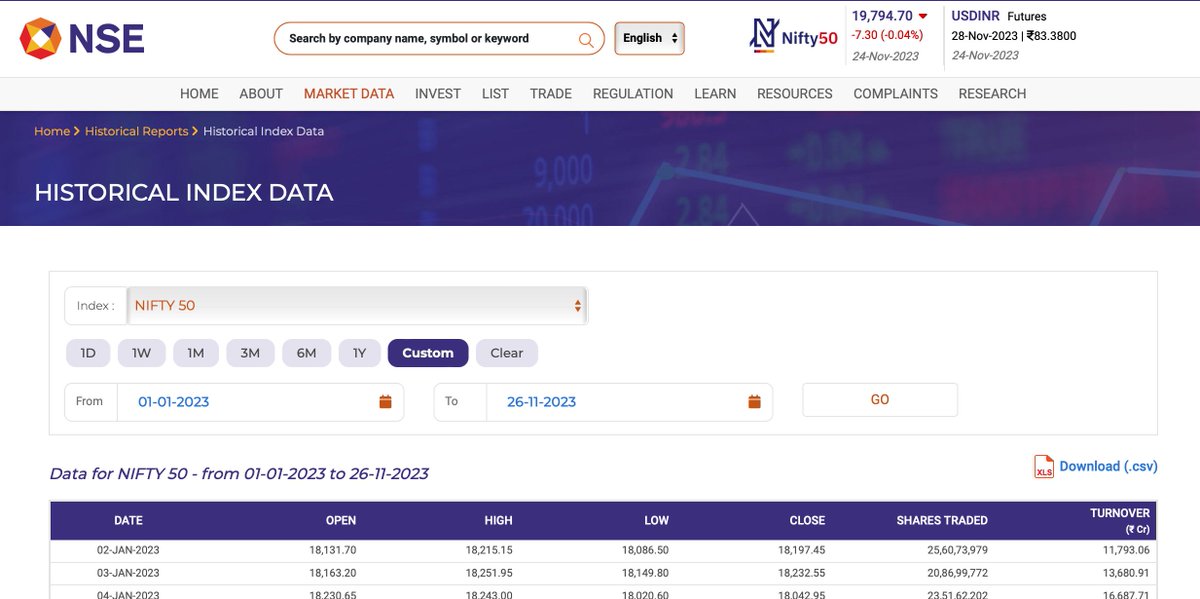
Go to NSE website buff.ly and download the historical data for any index for which you want to perform the data analysis. It contains the Open,High,Low, Close values along with shares traded & turnover.
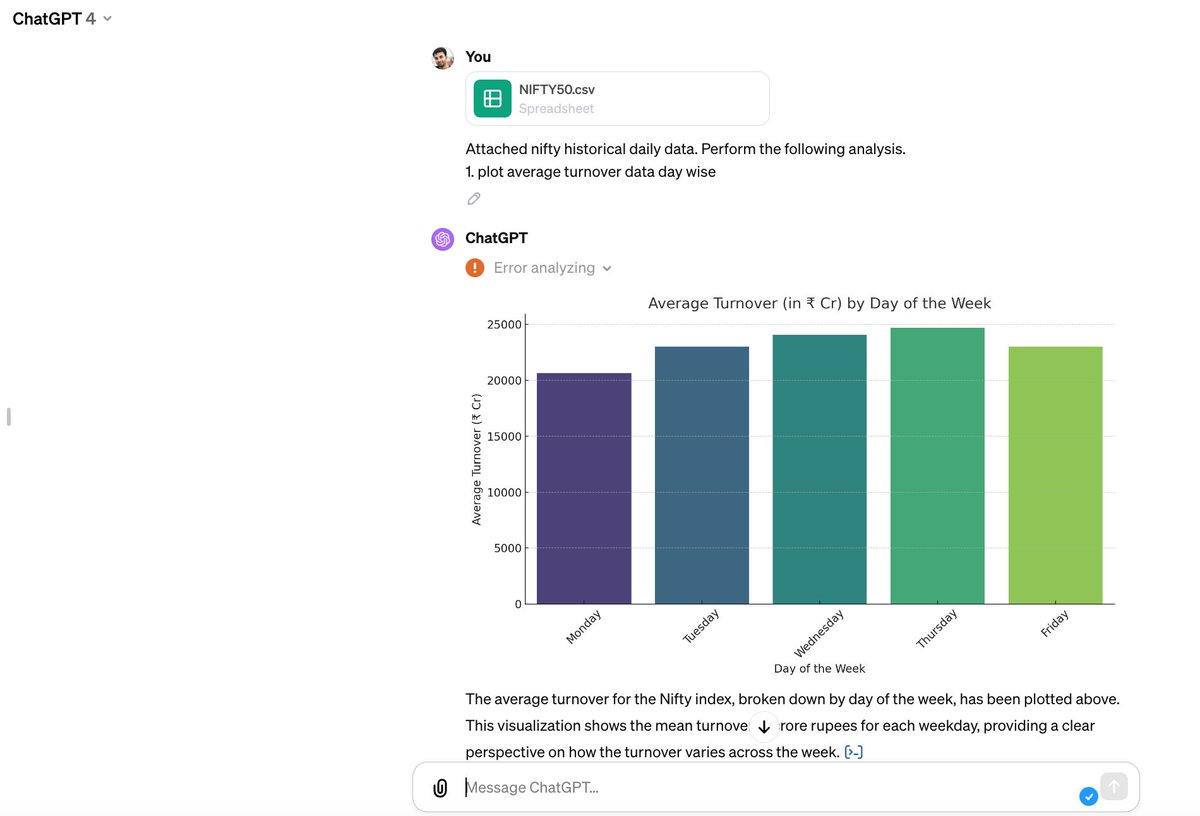
Enable ChatGPT4, so that you can perform all kind of data analysis easily. Just upload the csv file which you downloaded from NSE and instruct the ChatGPT to perform necessary analysis. To start with, I have asked ChatGPT to show day wise turnover. Here's the result
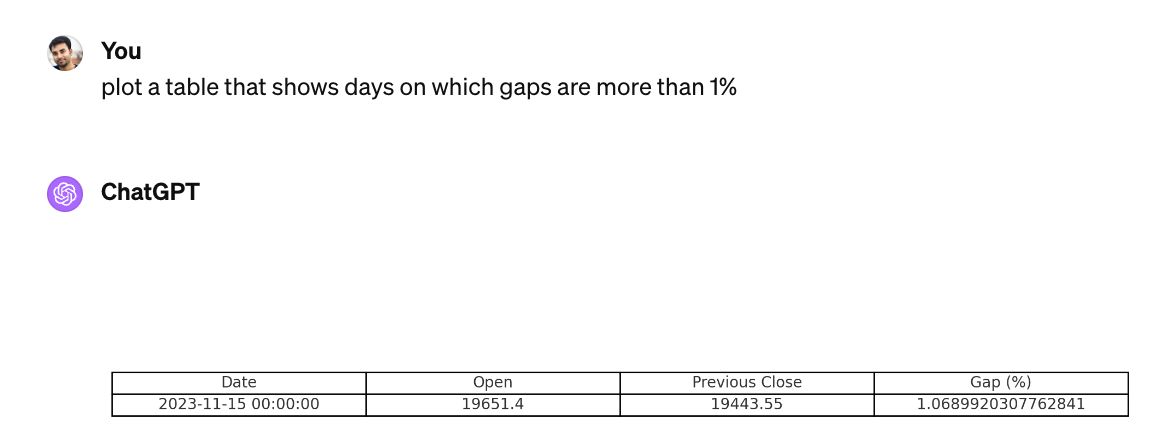
You can perform any specific standalone query as well, like you can ask ChatGPT to find how many days we had greater than 1% gap so for this year. It would pick the correct date and data for you instantly.
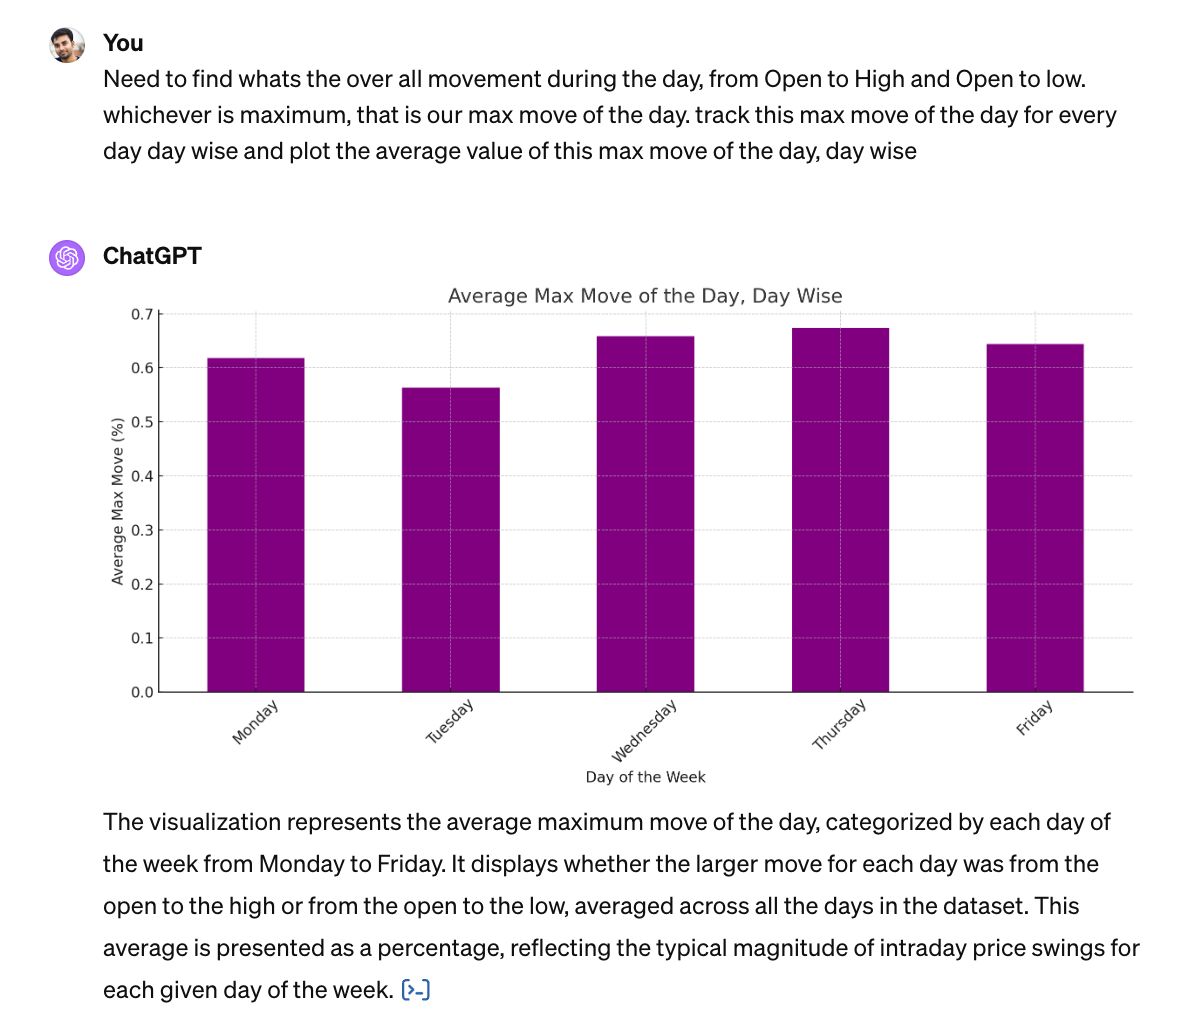
I want to find out intraday movement of Nifty day wise, i.e. after market opened, how much max it has moved up (Day Open to High), how much max it has moved down (Day Open to Low). The necessary analysis would be done by ChatGPT and plot the necessary data in bar graph.
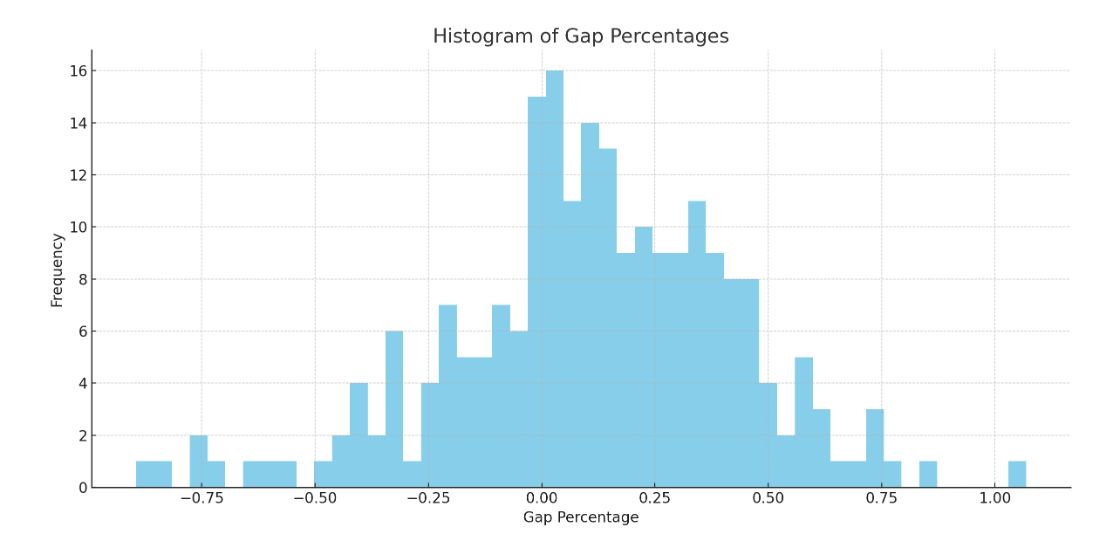
Performed detailed Gap Analysis, ChatGPT would go through every data and plotted a histogram chart which provides a visual distribution of how the gap percentages are spread out across all trading days.
According to the analysis:
There are 72 instances of downward gaps with an average gap of -44.03 points and a mean percentage gap of -0.23%.
There are 150 instances of upward gaps with an average gap of 51.92 points and a mean percentage gap of 0.28%.
There are 72 instances of downward gaps with an average gap of -44.03 points and a mean percentage gap of -0.23%.
There are 150 instances of upward gaps with an average gap of 51.92 points and a mean percentage gap of 0.28%.
The data reveals that small upward gaps are the most frequent, while large downward gaps are the least frequent.
This is the major advantage with ChatGPT along with the analysis, it provides you with detailed interpretation as well. So decision making for traders becomes easier.
This is the major advantage with ChatGPT along with the analysis, it provides you with detailed interpretation as well. So decision making for traders becomes easier.
Asked ChatGPT to perform a detailed range analysis. Here's the data it has given.
The average daily range is approximately 149.85 points.
The standard deviation, which measures the variability of the daily range, is 66.84 points.
The average daily range is approximately 149.85 points.
The standard deviation, which measures the variability of the daily range, is 66.84 points.
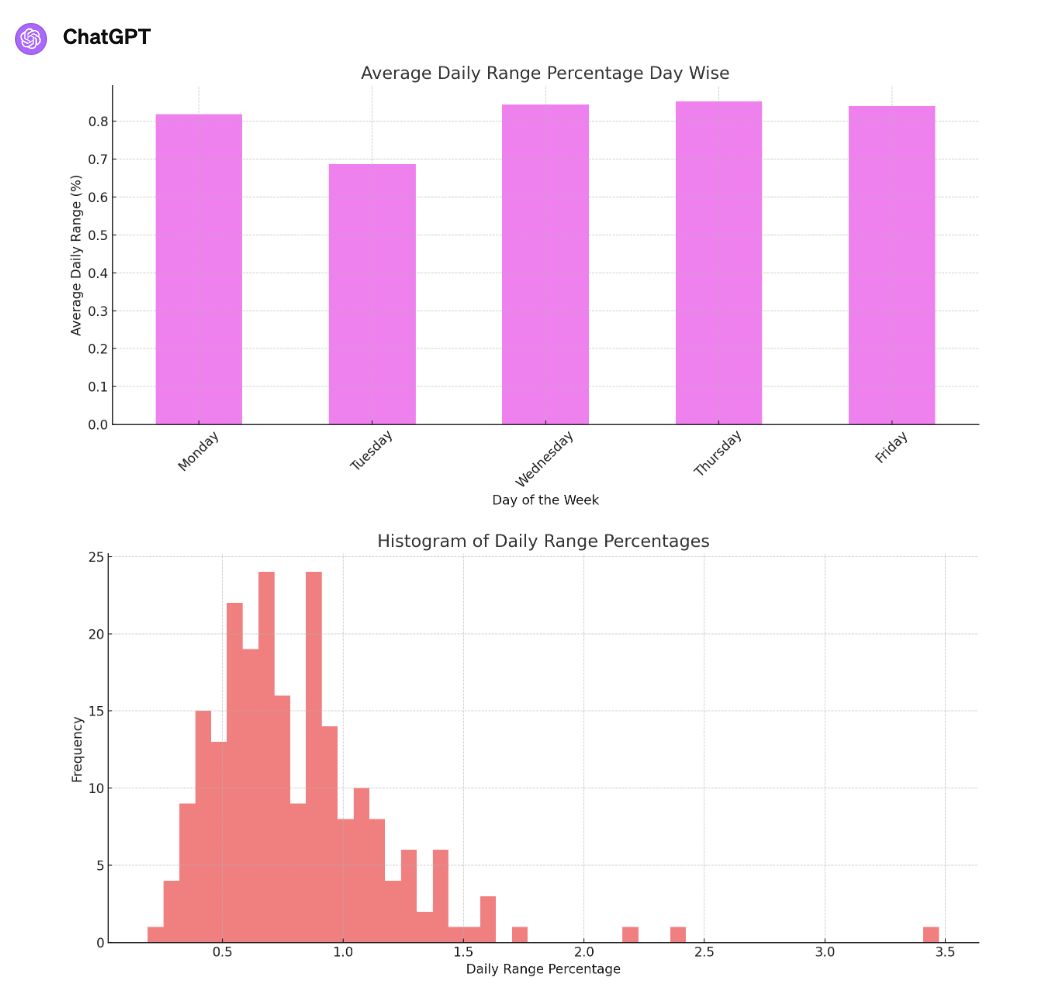
The minimum recorded daily range is 37 points, and the maximum is 618.8 points.
The average daily range percentage is 0.81%, with a standard deviation of 0.38%.
The minimum percentage range is 0.19%, and the maximum is 3.47%.
The average daily range percentage is 0.81%, with a standard deviation of 0.38%.
The minimum percentage range is 0.19%, and the maximum is 3.47%.
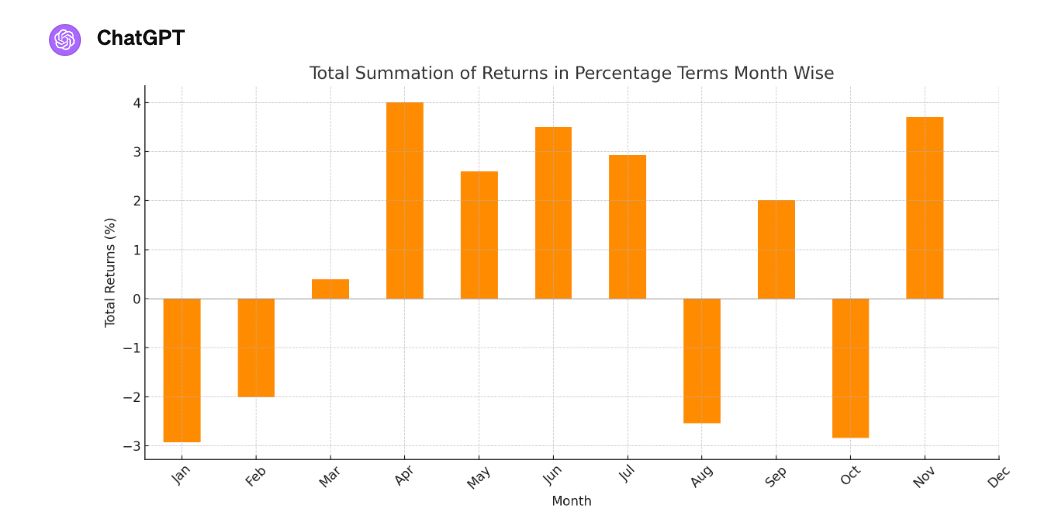
Here's the monthly return distribution chart of Nifty for this year, based on the historical data we uploaded, it automated maps the total return distribution month wise. Even week wise return distribution can also be plotted.
Here's the best part, you can ask ChatGPT to perform behavioural analysis as well. It refers to the tendencies of investors that cause them to act in predictably irrational ways. This analysis provides a quantitative glimpse into potential behavioral biases in the market.

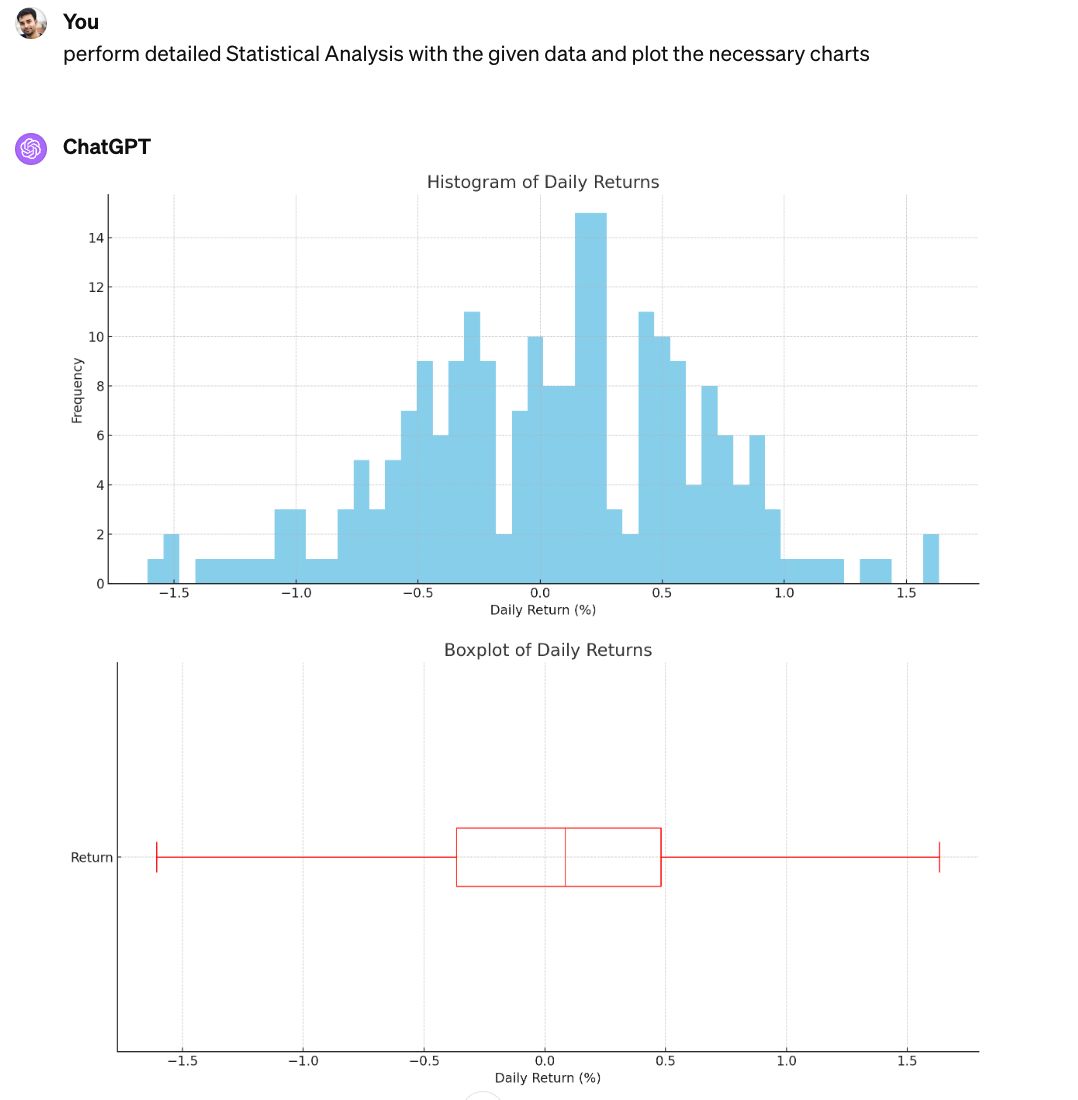
You can perform any kind of statistical analysis as well. Histogram of daily returns shows the frequency distribution of the return percentages. A boxplot provides a graphical view of the median, quartiles, and extremes.These data can help in understanding the risk/return profile
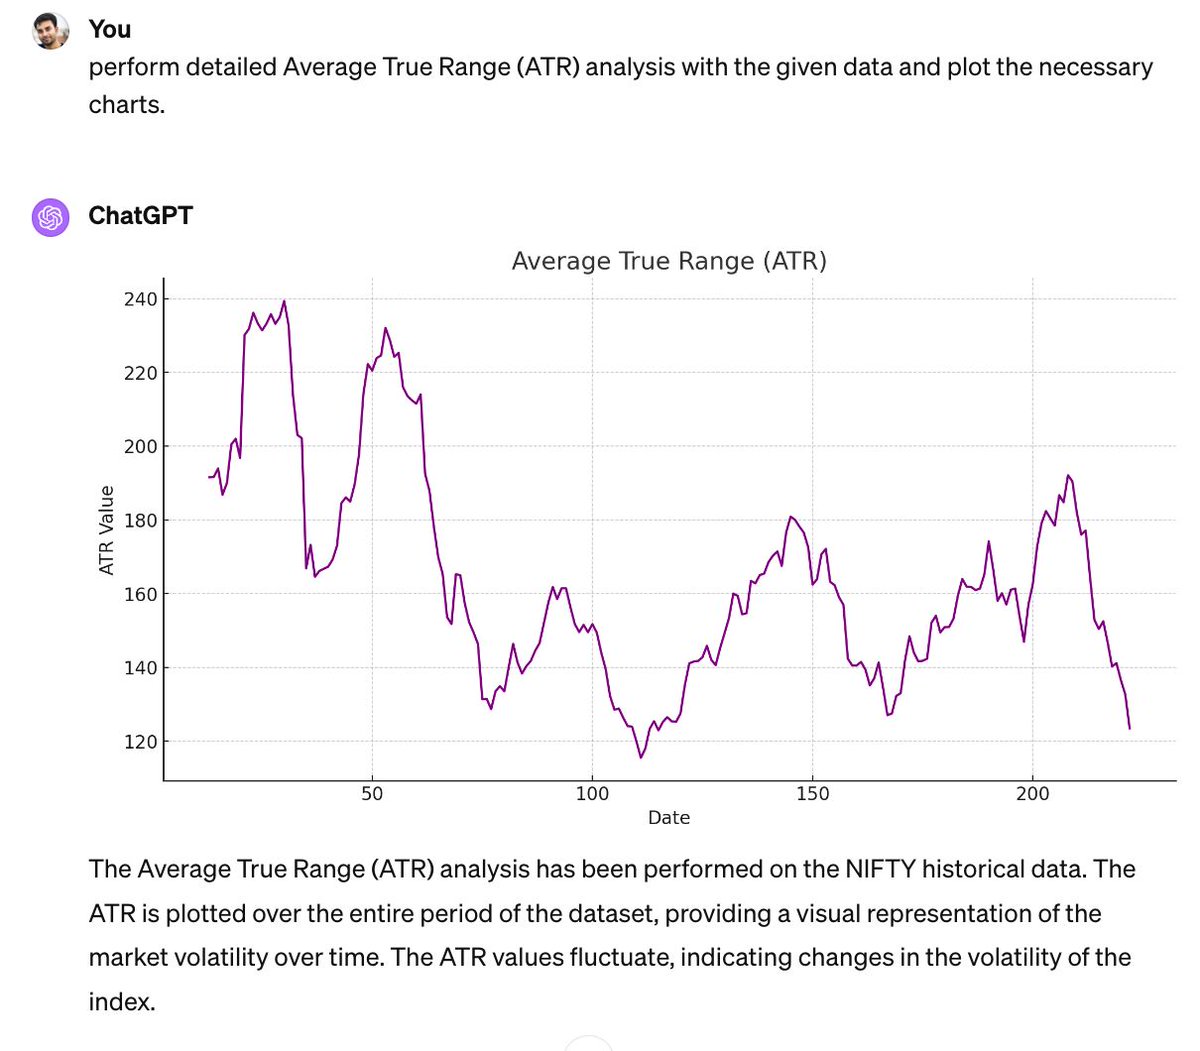
The Average True Range (ATR) analysis can be performed on the NIFTY historical data. It is a measure of market volatility. It helps in identifying Volatility Trends & Market Sentiment.
ChatGPT has drastically reduced my time I spend with Excel. ChatGPT can swiftly execute statistical analysIs, calculate technical indicators like ATR for volatility assessment, and provide chart visualisations for better decision-making. If you haven't tried it yet,give it a try
Loading suggestions...