

Techno-Funda Analysis of Sonata Software: A Consistent Mid-Cap IT Company
Market Cap ~ 17,200 Cr
CMP ~ 1225
PE ~ 36
1 Yr Return ~ 135%
Let's deep dive into it 👇
Market Cap ~ 17,200 Cr
CMP ~ 1225
PE ~ 36
1 Yr Return ~ 135%
Let's deep dive into it 👇
#fundamental Analysis
1. Business Overview
2. Vertical/Segmental Analysis
3. Acquisition History
4. Financial Analysis
5. Opportunities
6. Risk
7. Valuation
8. Guidance
1. Business Overview
2. Vertical/Segmental Analysis
3. Acquisition History
4. Financial Analysis
5. Opportunities
6. Risk
7. Valuation
8. Guidance
Business Overview
-Sonata is provided IT Services & software solutions to its clients
-Sonata is present in US, Europe, Middle East, APAC and New Zealand (17 Nations in total)
-It operates in two verticals:
1. International IT Services(IITS)
2. Domestic Product & Services(DPS)
-Sonata is provided IT Services & software solutions to its clients
-Sonata is present in US, Europe, Middle East, APAC and New Zealand (17 Nations in total)
-It operates in two verticals:
1. International IT Services(IITS)
2. Domestic Product & Services(DPS)
Domestic Product Services Business
-Sonata here focuses on the distribution of packaged software/application, including resale of cloud hosting of different technology gaints like Microsoft
-A low margin, but high ROCE Cash rich Biz (Simply resaler of other Co. Product)
-Sonata here focuses on the distribution of packaged software/application, including resale of cloud hosting of different technology gaints like Microsoft
-A low margin, but high ROCE Cash rich Biz (Simply resaler of other Co. Product)

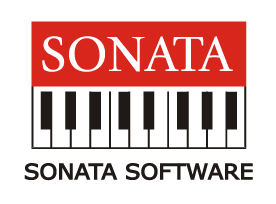
International IT Services Business (IITS)
-Sonata here provides customised & modernization services which improves consumer experience & growth, which help them achieve improved efficiency
-Its an High Margin-Low revenue contribution Vertical (A Premium vertical)
-Sonata here provides customised & modernization services which improves consumer experience & growth, which help them achieve improved efficiency
-Its an High Margin-Low revenue contribution Vertical (A Premium vertical)
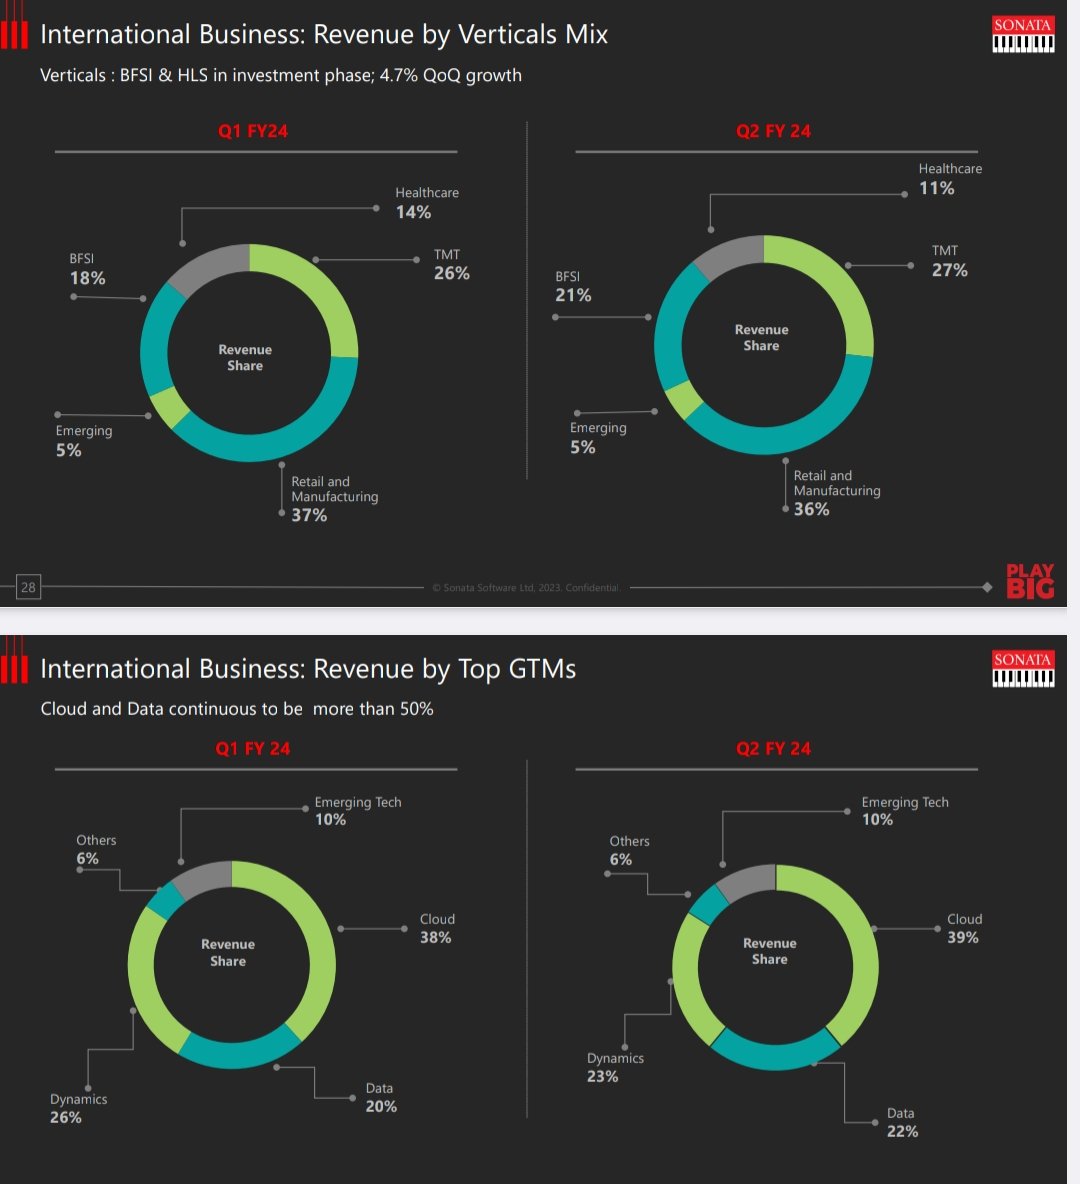
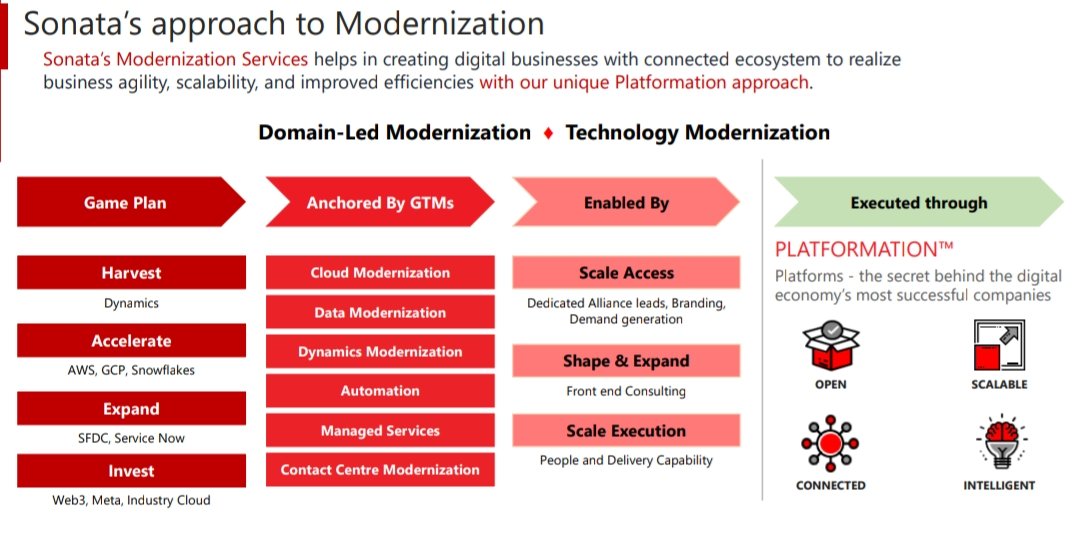
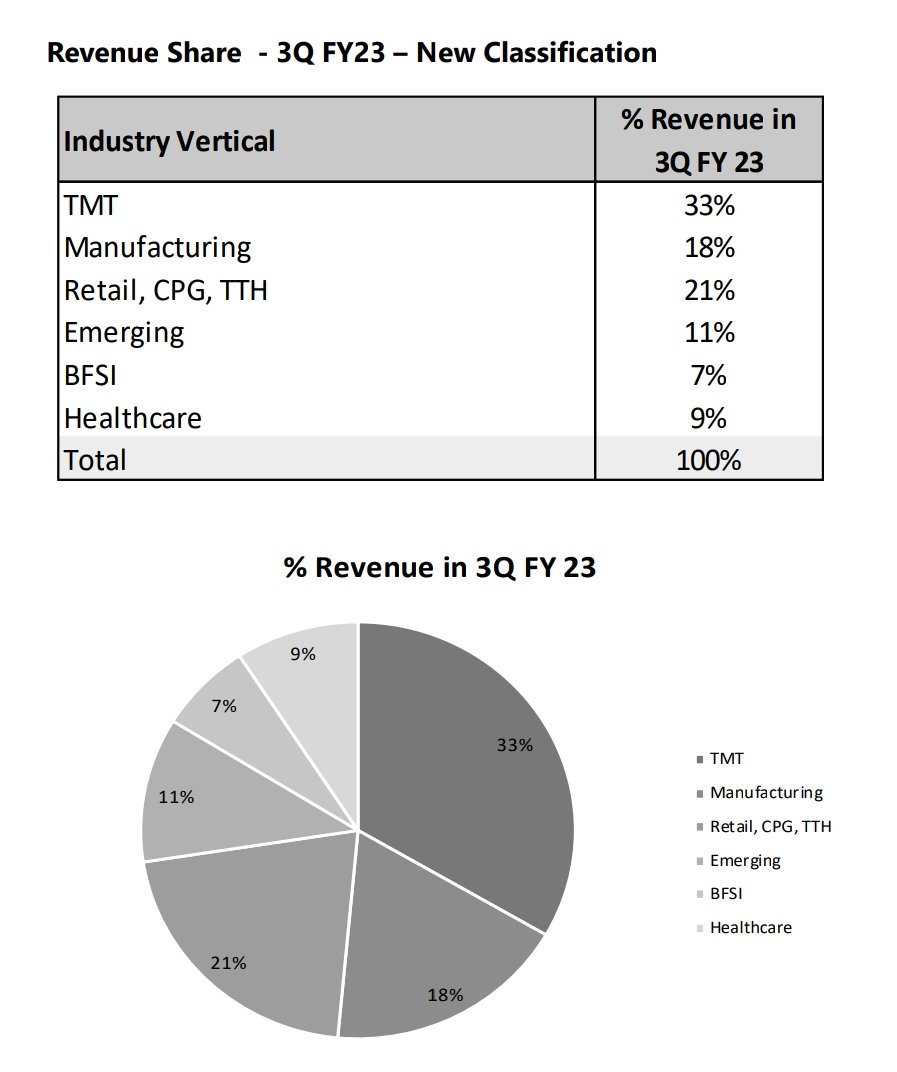
Caters to the following Industries like:
1. TMT: Technology Media & Telecom
2. RMD: Retail, Manuf., Travel & Distribution
3. BFSI: Banking, Financial & Insurance
4. HLS: Healthcare & Life science
5. Emerging
Revenue share 👇
1. TMT: Technology Media & Telecom
2. RMD: Retail, Manuf., Travel & Distribution
3. BFSI: Banking, Financial & Insurance
4. HLS: Healthcare & Life science
5. Emerging
Revenue share 👇
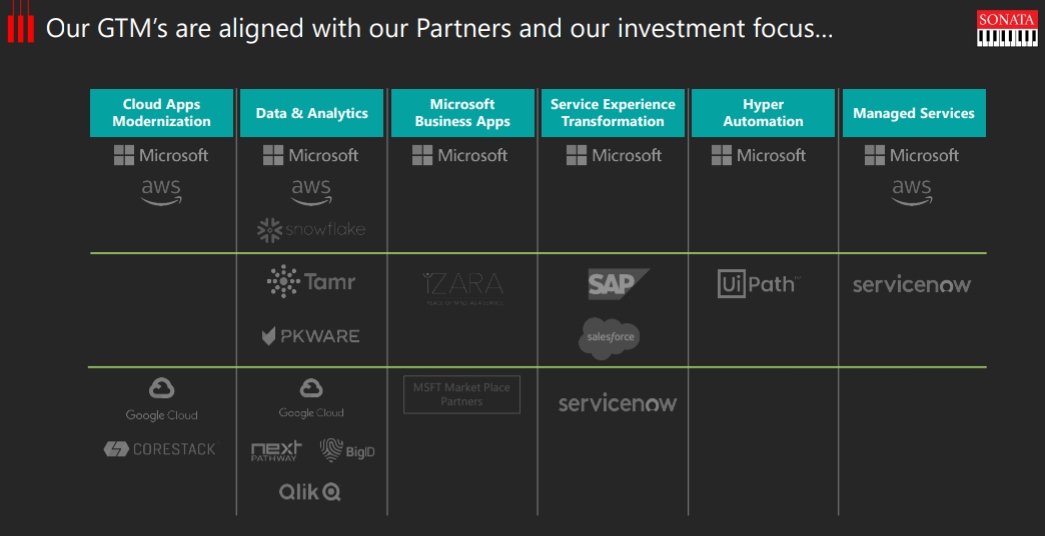
Partners: Ecosystem Partnership Tech + Domain
1. Microsoft
2. AWS
3. Google Cloud
4. Salesforce
5. Snowflake
6. Servicenow
7. Metricstream
8. SAP
Provide services like:
1. Cloud
2. Managed Services
3. Automation
4. AI & Data
5. Dynamics
6. Digital contact centre
1. Microsoft
2. AWS
3. Google Cloud
4. Salesforce
5. Snowflake
6. Servicenow
7. Metricstream
8. SAP
Provide services like:
1. Cloud
2. Managed Services
3. Automation
4. AI & Data
5. Dynamics
6. Digital contact centre
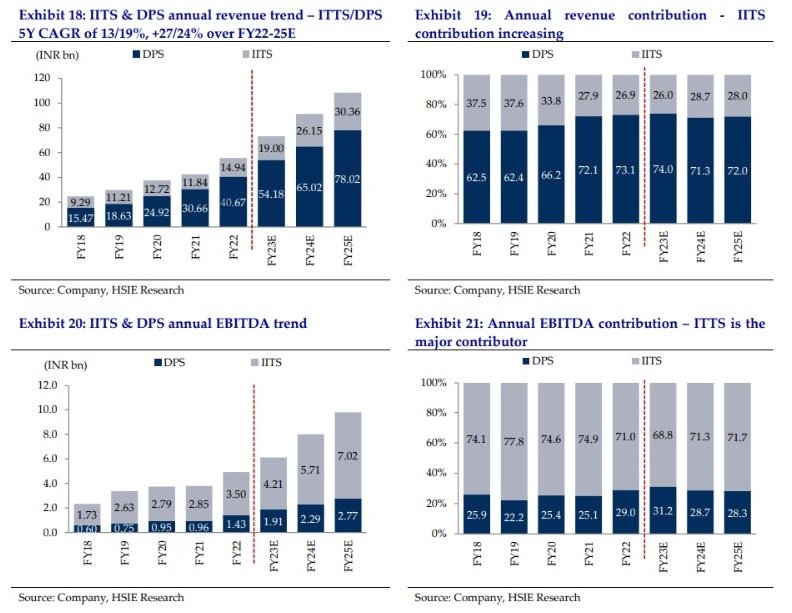
Revenue Contribution:
1. International IT Services(IITS)
-Low Revenue Contribution (26.5%)
-High margin (Low 20s)
2. Domestic Product & Services(DPS)
-High Revenue Contribution (73.5%)
-Low Margin (Low single degit)
Sonata Want to make IITS Biz as majority contri going forward
1. International IT Services(IITS)
-Low Revenue Contribution (26.5%)
-High margin (Low 20s)
2. Domestic Product & Services(DPS)
-High Revenue Contribution (73.5%)
-Low Margin (Low single degit)
Sonata Want to make IITS Biz as majority contri going forward
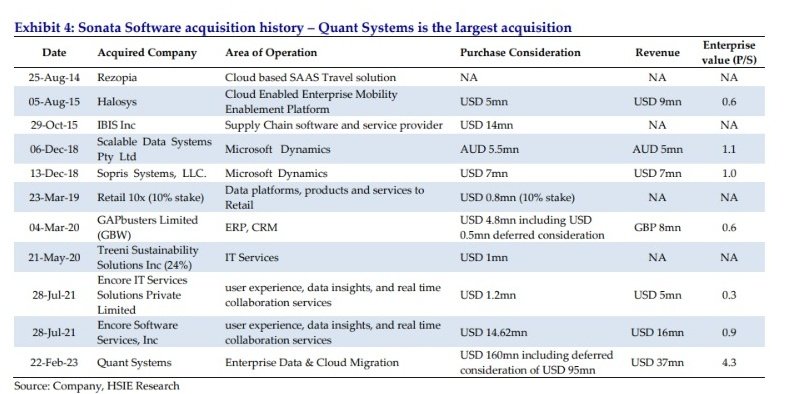
Acquisition History of Sonata:
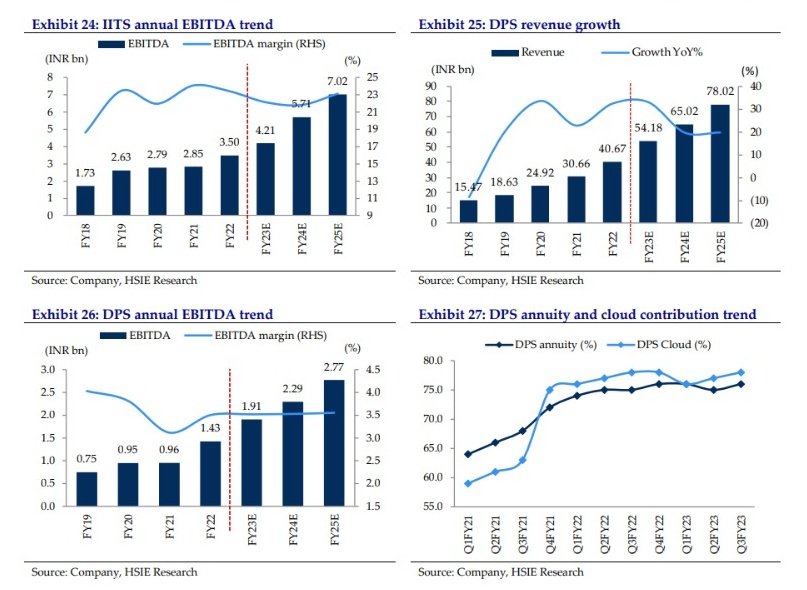
Financial Analysis:
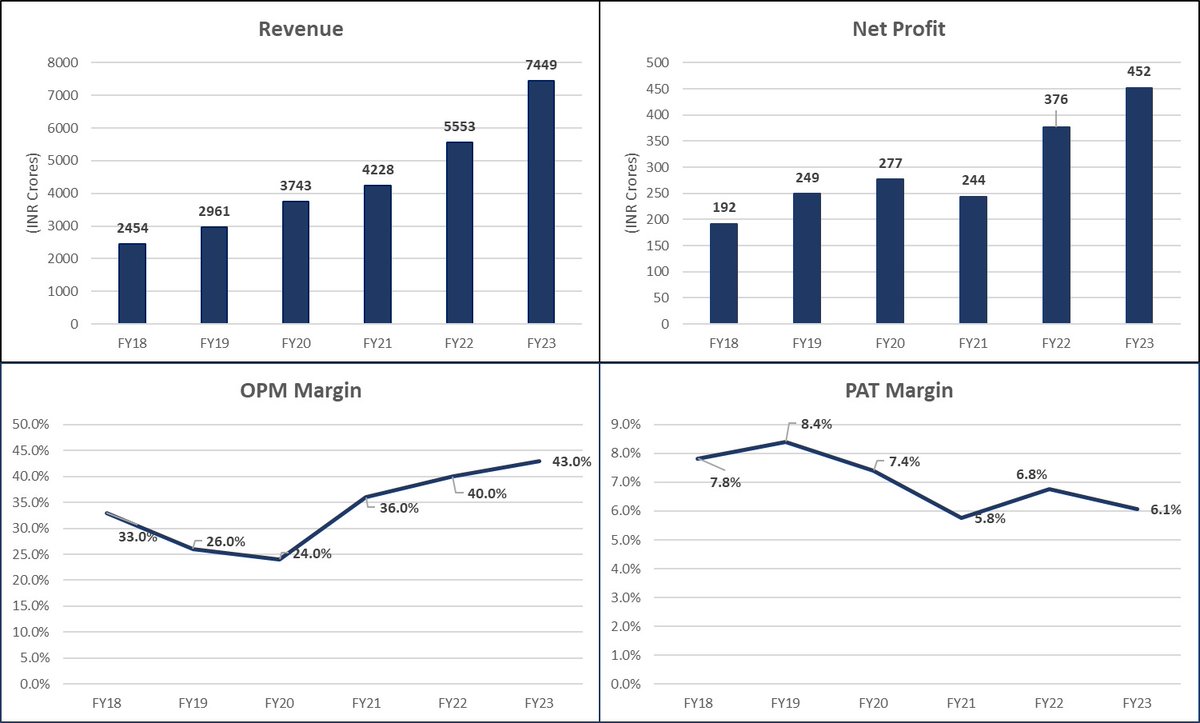
-Revenue Growth of 25% in last 5 years
-OPM Margin consistent around 8-9% from last 3-4 years
-PAT Growth of 19% in last 5 years (Lower due to acquisition leading to High Int & Dep exp)
-PAT Margin of around 6%
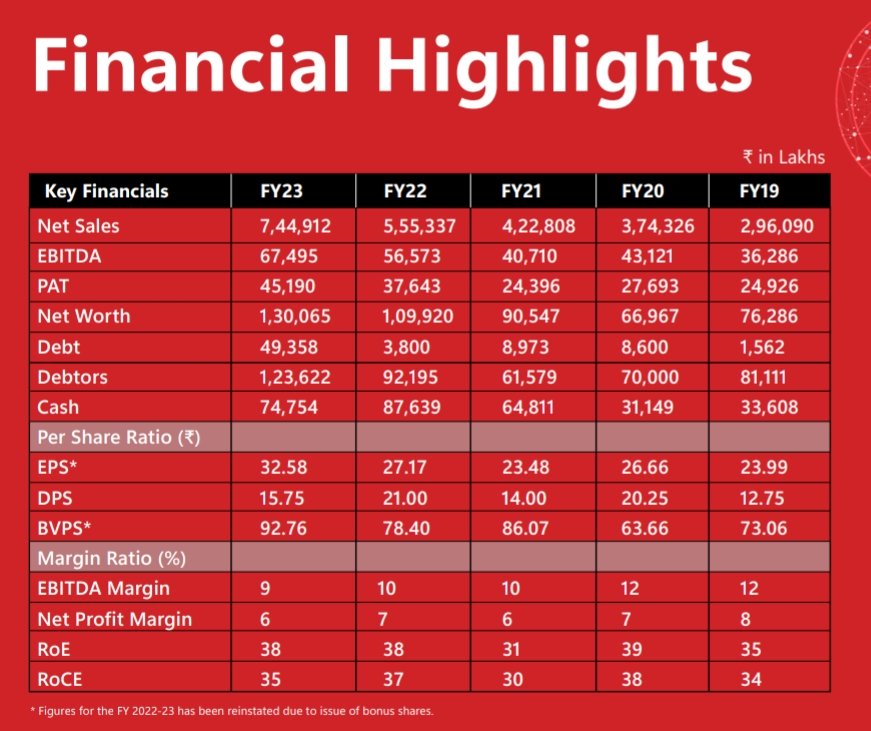
-ROCE: 39%
-ROE: 38%
-Dividend Payout Ratio: 48%
-Revenue Growth of 25% in last 5 years
-OPM Margin consistent around 8-9% from last 3-4 years
-PAT Growth of 19% in last 5 years (Lower due to acquisition leading to High Int & Dep exp)
-PAT Margin of around 6%
-ROCE: 39%
-ROE: 38%
-Dividend Payout Ratio: 48%
Other Metrics:
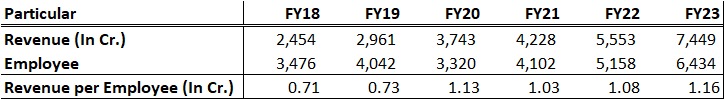
-Revenue per employee has started inching upward after a steep fall, due to COVID
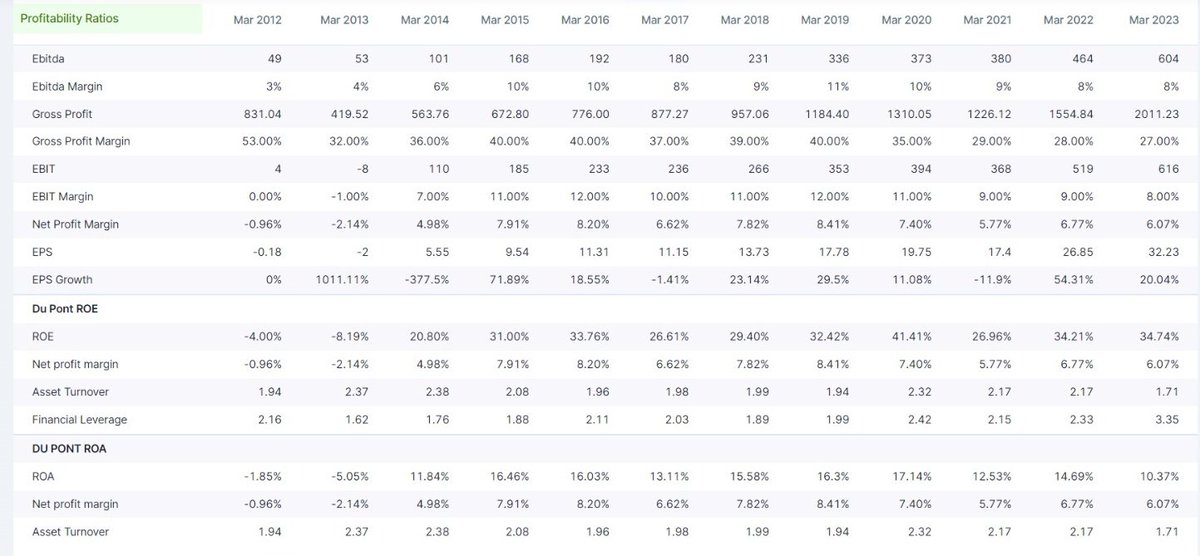
-Major cost in P&L is Stock in Trade (RM) & Employee
-Sonata has good CFO Conversion with CFO to PAT at around 90% average
-Profitablity Ratios
-Revenue per employee has started inching upward after a steep fall, due to COVID
-Major cost in P&L is Stock in Trade (RM) & Employee
-Sonata has good CFO Conversion with CFO to PAT at around 90% average
-Profitablity Ratios
Opportunities
1. Rise in contribution of high margin IITS Vertical
2. Reputed Partnership network, which consists of AWS, Snowflake, Adobe etc
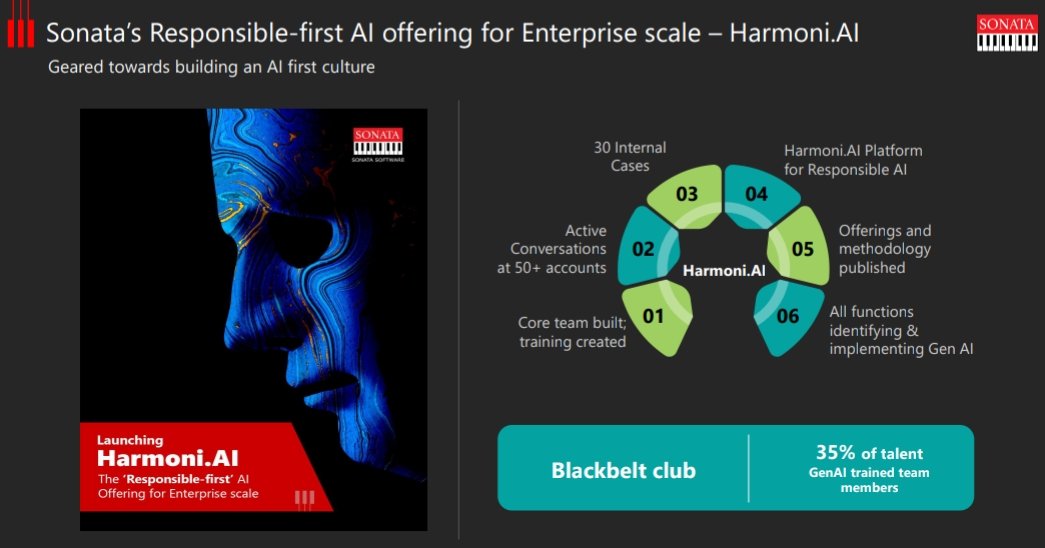
3. Harmoni AI Vertical
-Adopted as service offering & delivery platform (a white space in AI) & not competing with Google or Microsoft
1. Rise in contribution of high margin IITS Vertical
2. Reputed Partnership network, which consists of AWS, Snowflake, Adobe etc
3. Harmoni AI Vertical
-Adopted as service offering & delivery platform (a white space in AI) & not competing with Google or Microsoft

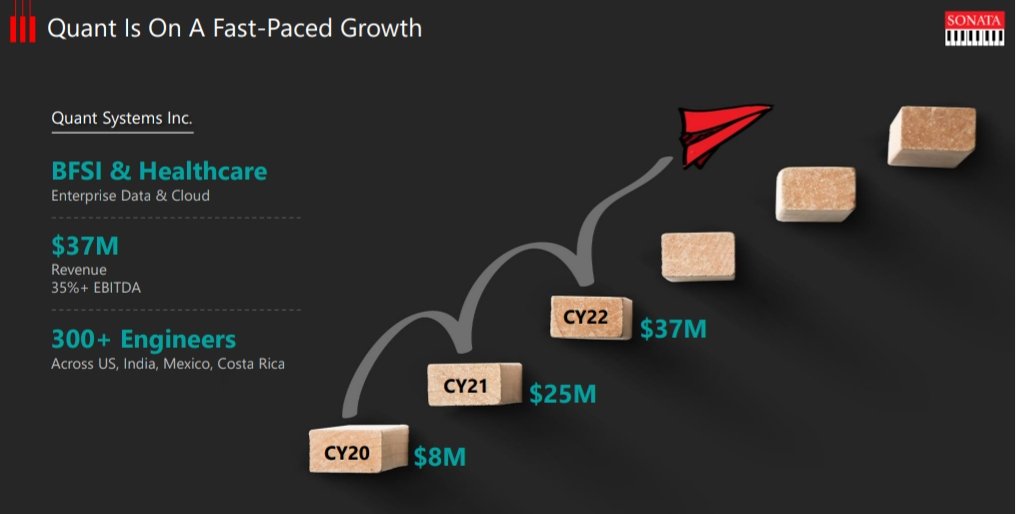
4. High Margin Quant Acquisition
-Quant has higher margin compared to Sonata
-It works in different verticals like Data analytics, Cyber security, cloud monetization & Data privacy
-Had partnership with major tech co. like Adobe, Mulesoft, Collibra etc
-Has differentiate IPs
-Quant has higher margin compared to Sonata
-It works in different verticals like Data analytics, Cyber security, cloud monetization & Data privacy
-Had partnership with major tech co. like Adobe, Mulesoft, Collibra etc
-Has differentiate IPs
5. Growth in BFS & Healthcare Vertical, this vertical is newly focused for Sonata which would cater through Quant Acquisition
(Sonata is not in such vertical earlier)
6. Expanding Digital & modernization solutions & Expanding other offerings of Microsoft like Data, Cloud & AI
(Sonata is not in such vertical earlier)
6. Expanding Digital & modernization solutions & Expanding other offerings of Microsoft like Data, Cloud & AI
7. Restructuring in US Organisation for better alignment & Investing in Sales & Marketing for better client mining(Recently sponsored MIW team)
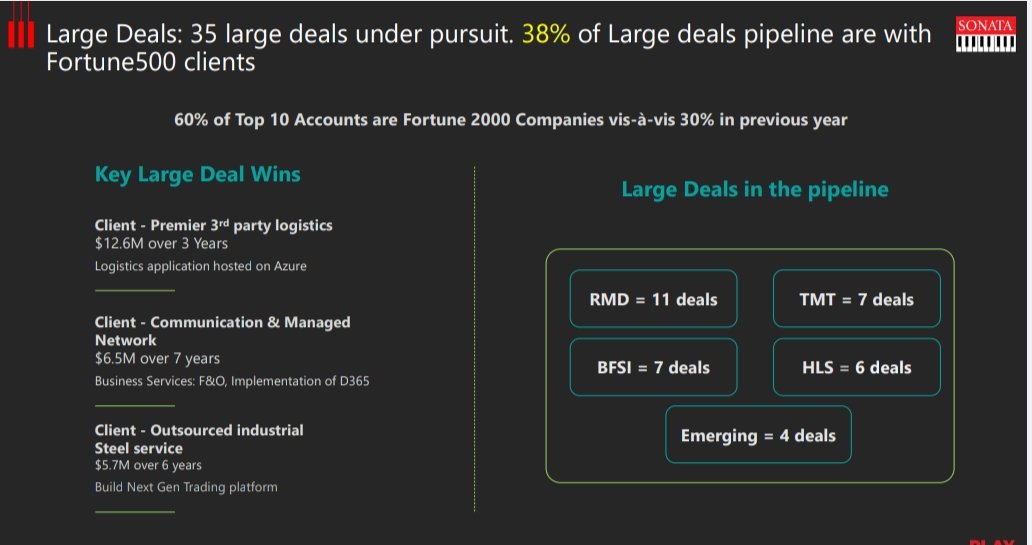
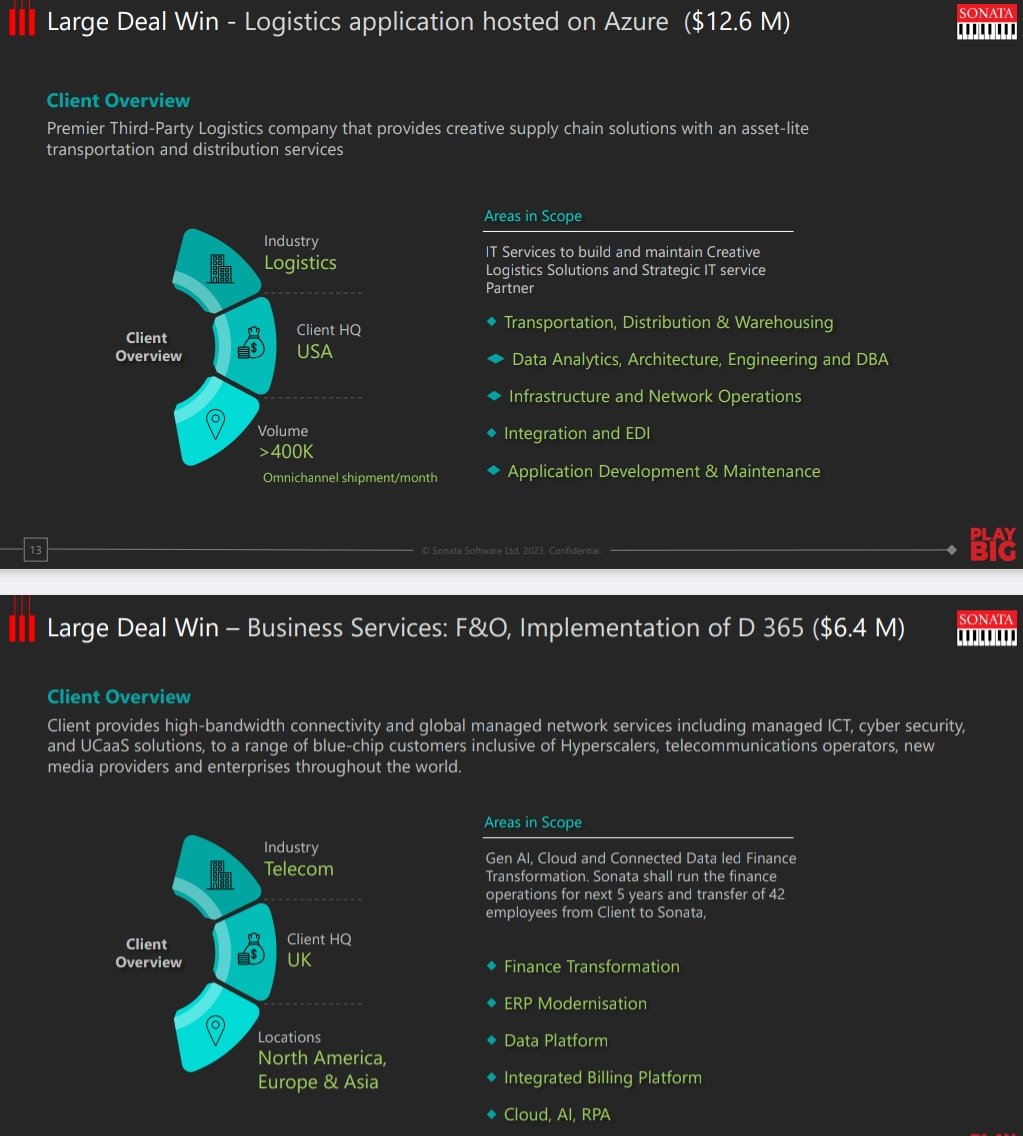
8. Large Deal Pipeline executions: Cloud & Data pipeline is 38% + 10 Large Deal win YTD
9. Geographical Exp. by entering new countrie
8. Large Deal Pipeline executions: Cloud & Data pipeline is 38% + 10 Large Deal win YTD
9. Geographical Exp. by entering new countrie
10. Investing in other Vertical through Cash Rich & High ROCE DPS Biz
11. Operating Leverage play(Currently playing out) which is leading to EBITDA Margin improvement
12. Inorganic Acquisition(Had a good past record of Acquisition)
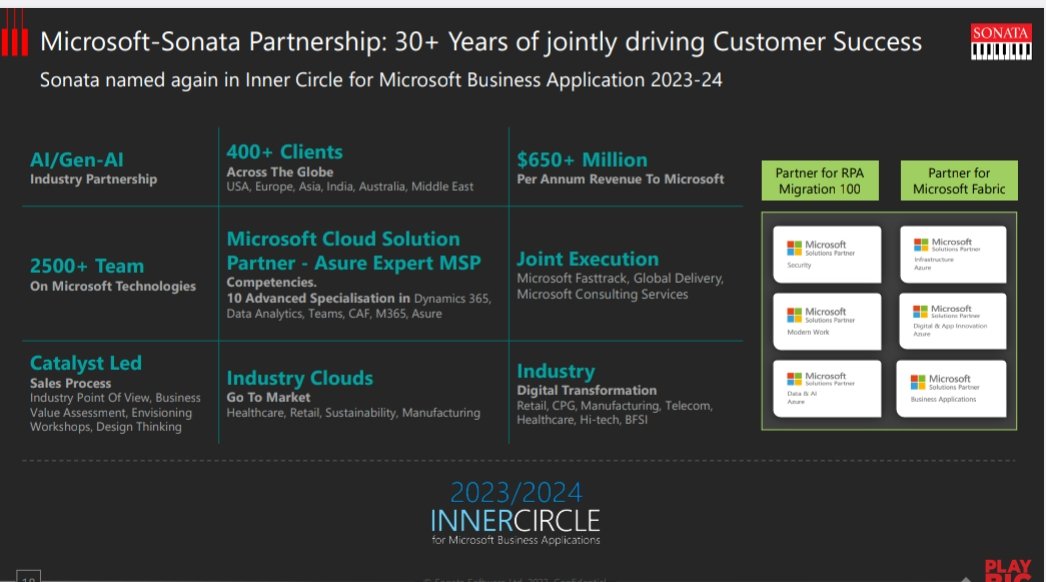
13. Microsoft Strong Innovative Partnership
11. Operating Leverage play(Currently playing out) which is leading to EBITDA Margin improvement
12. Inorganic Acquisition(Had a good past record of Acquisition)
13. Microsoft Strong Innovative Partnership
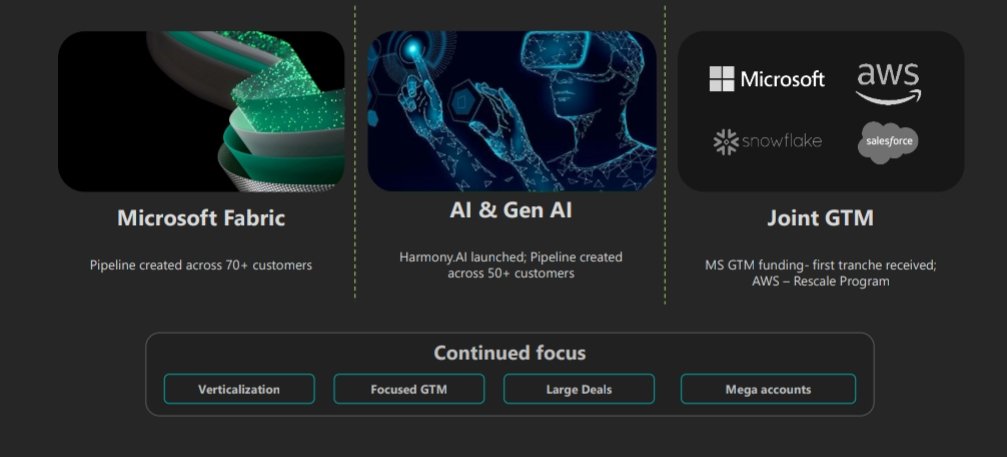
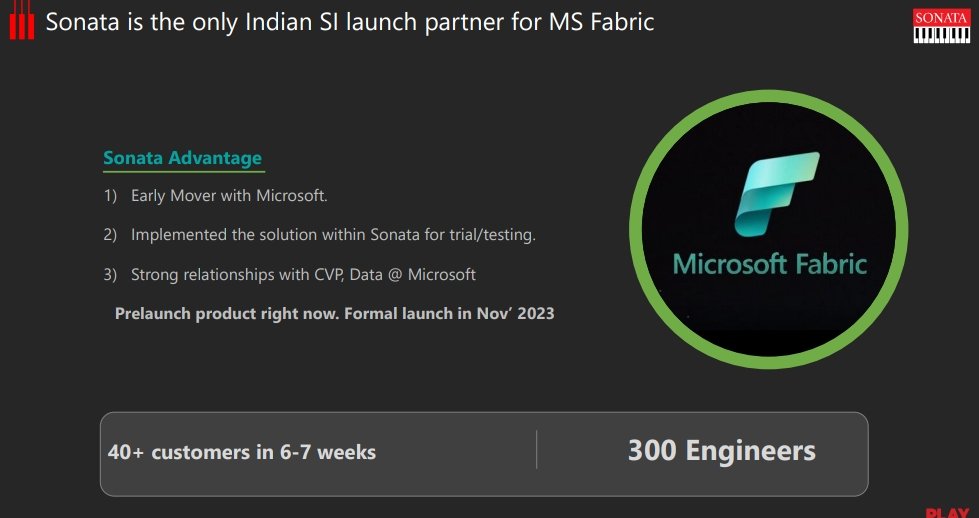
14. Key Future Bets like:
1. Microsoft Fabric
-Sonata is only Microsoft partner in Microsoft Fabric
2. AI & Gen AI
3. Joint Go to market software (Resale partner products with scale & new strategy)
15. Product Mix (From high DPS to IITS) improvement lead to margin Expansion
1. Microsoft Fabric
-Sonata is only Microsoft partner in Microsoft Fabric
2. AI & Gen AI
3. Joint Go to market software (Resale partner products with scale & new strategy)
15. Product Mix (From high DPS to IITS) improvement lead to margin Expansion
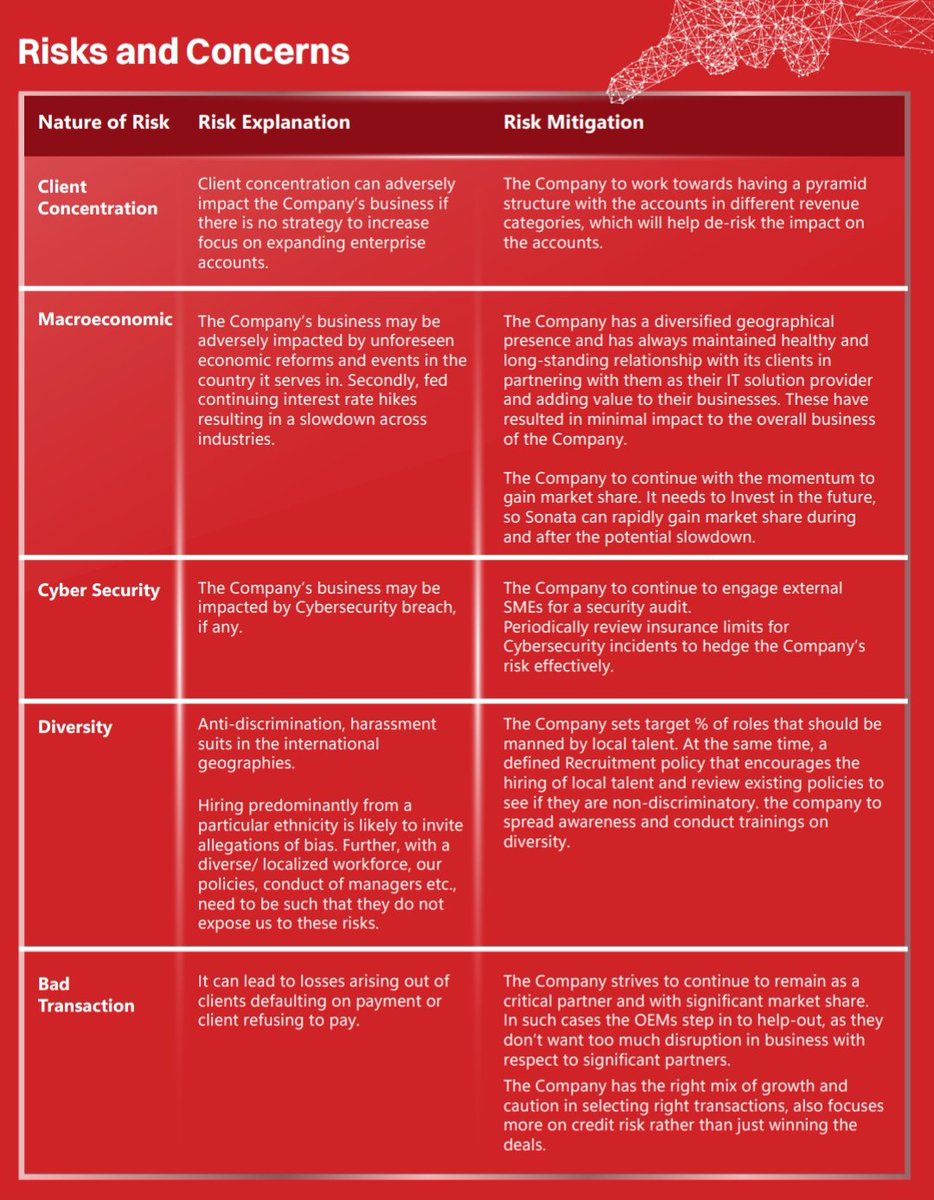
Risk:
-Dollar Revenue loss if INR Appreciate
-Pricing pressure in DPS Vertical
-Cyber security Risk
-Any large debt fund acquisition, which can hamper Profits
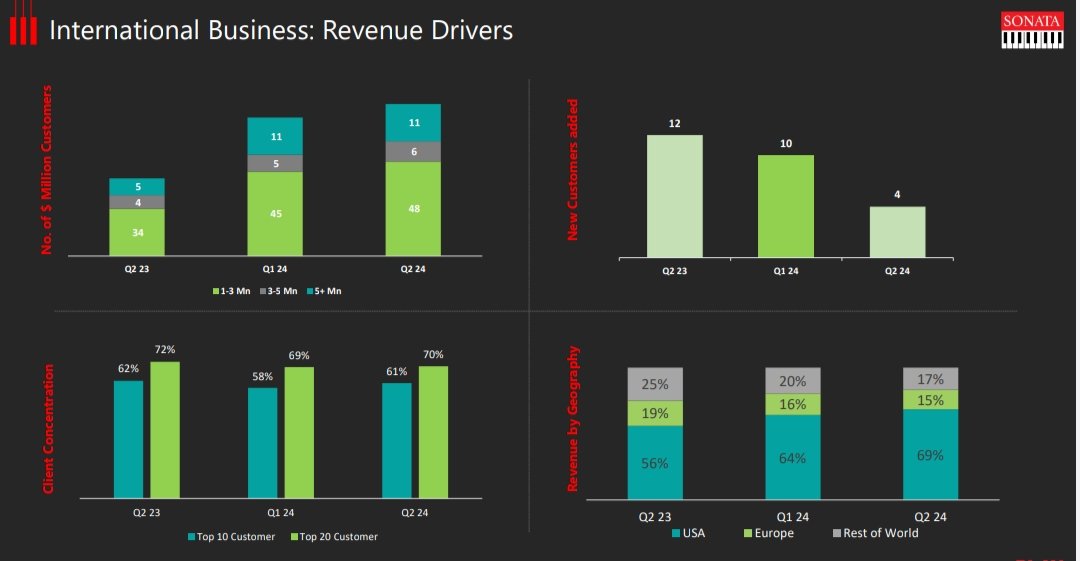
-High geographical/Client concentration
-Key customer loss risk
-Near term margin headwinds, due to Quant Acquisition v
-Dollar Revenue loss if INR Appreciate
-Pricing pressure in DPS Vertical
-Cyber security Risk
-Any large debt fund acquisition, which can hamper Profits
-High geographical/Client concentration
-Key customer loss risk
-Near term margin headwinds, due to Quant Acquisition v
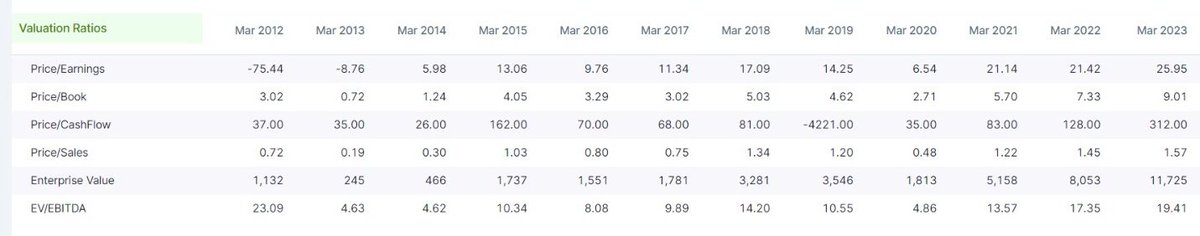
Valuations:
Current PE: 36x
3 Yr Median PE: 25x
EV/EBITDA: 22x
3 Yr Median EV/EBITDA: 15x
Trading at overvaluation territory compared to 3 Yr Avg. But Sonata strategy has been changed & now it is moving to become its Biz more structural & consistent compared to earlier
Current PE: 36x
3 Yr Median PE: 25x
EV/EBITDA: 22x
3 Yr Median EV/EBITDA: 15x
Trading at overvaluation territory compared to 3 Yr Avg. But Sonata strategy has been changed & now it is moving to become its Biz more structural & consistent compared to earlier
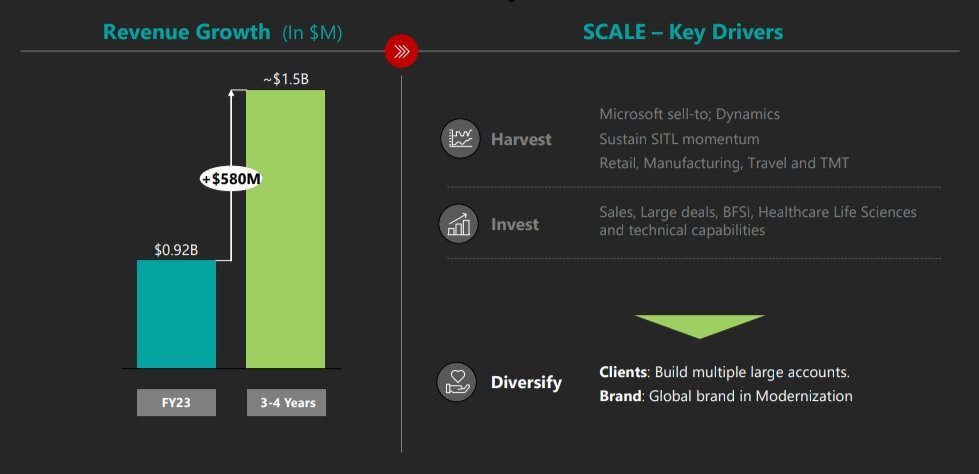
Guidance:
-Revenue Guidance of $1.5 BN by FY26
-Internation EBITDA will be in low 20s & Aim to have 50% Revenue contribution from IITS vertical
- Significant investment in Harmoni.AI platform, with a goal to have 25% of topline contribution from it in next 2-3 Yrs
-Revenue Guidance of $1.5 BN by FY26
-Internation EBITDA will be in low 20s & Aim to have 50% Revenue contribution from IITS vertical
- Significant investment in Harmoni.AI platform, with a goal to have 25% of topline contribution from it in next 2-3 Yrs
#Technical Analysis:
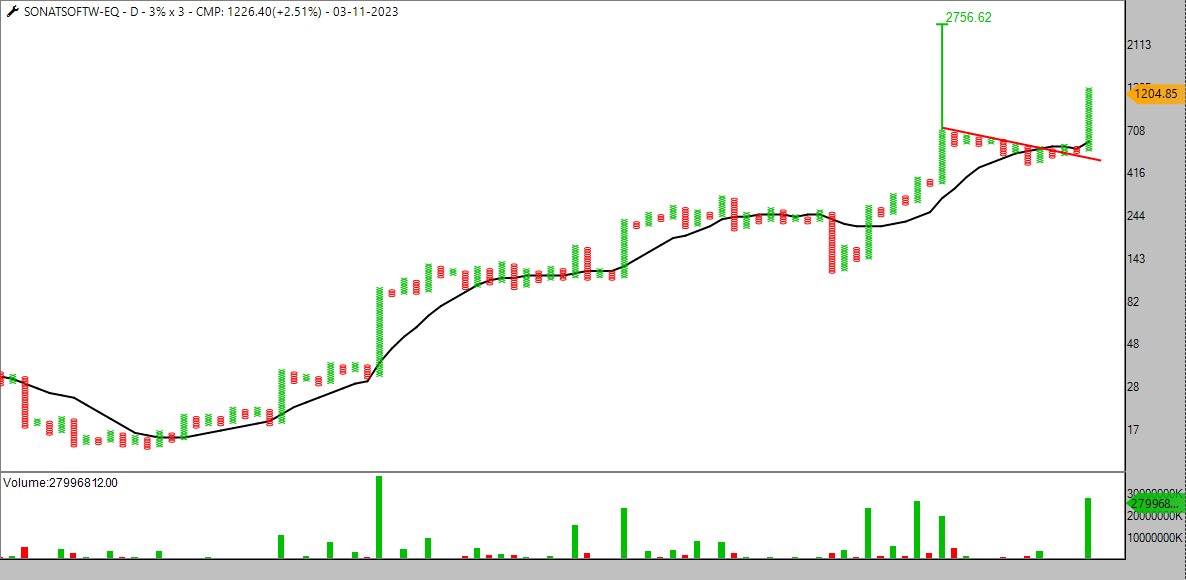
1. Point & Finger Chart
2. 3% x 3 Point & Finger Chart
3. Moving Avg. Observation
4. RSI Observation
5. Donchian Channel Observation
6. Bollinger Band Observation
7. Ichimoku Observation
1. Point & Finger Chart
2. 3% x 3 Point & Finger Chart
3. Moving Avg. Observation
4. RSI Observation
5. Donchian Channel Observation
6. Bollinger Band Observation
7. Ichimoku Observation
1. Strong purchasing interest & support is expected to continue the previous long "X" anchor column & stock will probably issue a Bear Trap Follow Through confirmation signal & will also continue to trade above the 10SMA, indicating its bullish momentum & potential for more gains

2. Stock is quite strong, shown in chart Anchor Follow through pattern is formed by the current trendline B/O & DTB at 1205, which is configured to prolong the previous long "X" anchor column also significant activity in this lengthy "X" column, indicating strong bullish momentum
3. Moving Average Observations:
The 200-day moving average is still above the price.
Price above moving averages of 50, 100, and 200 days.
Alignment of the moving average is positive. It's a bullish situation with an upswing.
The 200-day moving average is still above the price.
Price above moving averages of 50, 100, and 200 days.
Alignment of the moving average is positive. It's a bullish situation with an upswing.
4. The Daily RSI indicator has continued to be above 60. This area is bullish. The Daily RSI is currently reading 69.93.
-The Weekly RSI has stayed over 70. The Weekly RSI is at 75.08.
-In the current session, the Monthly RSI indicator crossed over 80. The monthly RSI is at 87.44
-The Weekly RSI has stayed over 70. The Weekly RSI is at 75.08.
-In the current session, the Monthly RSI indicator crossed over 80. The monthly RSI is at 87.44
5. Donchian Channel Observations:
-Price is above the middle of the Donchian channel (Bullish).
-Difference between bands is 20.33%
6. Bollinger Band Observations:
-Price is above Uper band Bollinger band (Bullish to over-brought)
Difference between bands is 20.32%
-Price is above the middle of the Donchian channel (Bullish).
-Difference between bands is 20.33%
6. Bollinger Band Observations:
-Price is above Uper band Bollinger band (Bullish to over-brought)
Difference between bands is 20.32%
7. Ichimoku Observations:
-Price above Ichimoku clouds.
-Clouds are bullish.
-Tenkan line is above Kijun line. Ichimoku setup is bullish.
-Price above Ichimoku clouds.
-Clouds are bullish.
-Tenkan line is above Kijun line. Ichimoku setup is bullish.
No Recommendation
This post is purely for #educational purposes
Hope, you guys will like it!! ✨
For more such detailed Techno-Funda Analysis follow:
@Mr_Maurya16 & @BansalSwapan
This post is purely for #educational purposes
Hope, you guys will like it!! ✨
For more such detailed Techno-Funda Analysis follow:
@Mr_Maurya16 & @BansalSwapan
Loading suggestions...