

Mastering Monitoring and Alerting with Prometheus!
A Thread providing an introductory overview of Prometheus & a step-by-step guide on how to install it👇
A Thread providing an introductory overview of Prometheus & a step-by-step guide on how to install it👇

What is Prometheus!
Prometheus is an open-source monitoring & alerting toolkit designed for reliability & scalability. It is used to collect, store, & query time-series data, allowing u to monitor & analyze the performance & health of various systems, applications, & services.
Prometheus is an open-source monitoring & alerting toolkit designed for reliability & scalability. It is used to collect, store, & query time-series data, allowing u to monitor & analyze the performance & health of various systems, applications, & services.
Key Features -
Time-Series Data Collection: It scrapes metrics from various sources (known as "jobs"), such as application endpoints, db's, & system-level metrics.
Metric Storage: It stores collected metrics in a time-series db, making historical data available for analysis.
Time-Series Data Collection: It scrapes metrics from various sources (known as "jobs"), such as application endpoints, db's, & system-level metrics.
Metric Storage: It stores collected metrics in a time-series db, making historical data available for analysis.
Query Language: It offers a powerful query language (PromQL) to filter, aggregate, & analyze collected metrics.
Alerting: It can be configured to generate alerts based on predefined rules & thresholds.
Alerting: It can be configured to generate alerts based on predefined rules & thresholds.
Exporters: Prometheus supports exporters, which are specific components to collect metrics from various services like databases, web servers, and more.
What is Alertmanager!
Alertmanager: 🚨 It is another open-source component of the Prometheus ecosystem, focused on handling & routing alerts generated by Prometheus. It helps manage & respond to alerts effectively.
Alertmanager: 🚨 It is another open-source component of the Prometheus ecosystem, focused on handling & routing alerts generated by Prometheus. It helps manage & respond to alerts effectively.
Key Features:
Alert Routing: Alertmanager routes alerts to appropriate receivers or notification channels, such as email, Slack, PagerDuty, and more.
Silence Alerts: It allows operators to silence, inhibit, or mute specific alerts temporarily, reducing notification noise.
Alert Routing: Alertmanager routes alerts to appropriate receivers or notification channels, such as email, Slack, PagerDuty, and more.
Silence Alerts: It allows operators to silence, inhibit, or mute specific alerts temporarily, reducing notification noise.
Grouping: Alertmanager can group similar alerts together, making it easier to manage related incidents.
Integrations: It offers integrations with various communication tools and services, facilitating alert notifications and incident management.
Integrations: It offers integrations with various communication tools and services, facilitating alert notifications and incident management.
Prometheus and Alertmanager Terminology 👇

1/6: Prometheus Terminology
Metric: A data point representing a measured value, like CPU usage or HTTP request duration.
Job: A target service or system that Prometheus scrapes for metrics. Examples: Node Exporter, HTTP endpoint.
Metric: A data point representing a measured value, like CPU usage or HTTP request duration.
Job: A target service or system that Prometheus scrapes for metrics. Examples: Node Exporter, HTTP endpoint.
2/6: Prometheus Terminology
Scrape Interval: How often Prometheus collects metrics from a job, defined in the configuration.
Scrape Target: The endpoint from which metrics are scraped (e.g., http://localhost:9090/metrics).
Scrape Interval: How often Prometheus collects metrics from a job, defined in the configuration.
Scrape Target: The endpoint from which metrics are scraped (e.g., http://localhost:9090/metrics).
3/6: Alertmanager Terminology
Now, let's dive into Alertmanager, which handles alert notifications:
Alert: A condition that indicates a problem, defined using PromQL.
Route: Specifies how alerts are processed, deciding where to send notifications.
Now, let's dive into Alertmanager, which handles alert notifications:
Alert: A condition that indicates a problem, defined using PromQL.
Route: Specifies how alerts are processed, deciding where to send notifications.
4/6: Alertmanager Terminology
Receiver: A notification destination (e.g., email, Slack, or custom webhook).
Inhibition: Prevents unwanted or redundant alerts by silencing other alerts during a critical event.
Receiver: A notification destination (e.g., email, Slack, or custom webhook).
Inhibition: Prevents unwanted or redundant alerts by silencing other alerts during a critical event.
5/6: Prometheus + Alertmanager
Prometheus and Alertmanager work together. Prometheus collects metrics, evaluates rules, and sends alerts to Alertmanager. Alertmanager then routes and dispatches notifications to various receivers.
Prometheus and Alertmanager work together. Prometheus collects metrics, evaluates rules, and sends alerts to Alertmanager. Alertmanager then routes and dispatches notifications to various receivers.
6/6: Conclusion
Understanding these terms is crucial for effectively using Prometheus and Alertmanager. They're key tools in the world of monitoring and alerting, helping ensure system reliability and performance. #Prometheus #Alertmanager #Monitoring 🚀
Understanding these terms is crucial for effectively using Prometheus and Alertmanager. They're key tools in the world of monitoring and alerting, helping ensure system reliability and performance. #Prometheus #Alertmanager #Monitoring 🚀
Installing Prometheus and Alertmanager on Ubuntu 👇
1/8: Installing Prometheus
To install Prometheus on Ubuntu, we'll use the official package. First, update your system:
To install Prometheus on Ubuntu, we'll use the official package. First, update your system:

2/8: Install Prometheus
Install Prometheus with APT:
Install Prometheus with APT:

3/8: Configuration
Edit the Prometheus configuration file:
Edit the Prometheus configuration file:

4/8: Prometheus Configuration
Here's a basic config snippet:
Here's a basic config snippet:

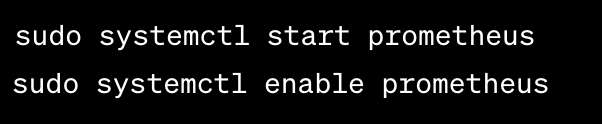
5/8: Start Prometheus
Start Prometheus service:
Start Prometheus service:
6/8: Installing Alertmanager
Install Alertmanager with APT:
Install Alertmanager with APT:

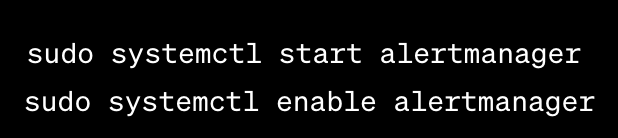
7/8: Start Alertmanager
Start Alertmanager service:
Start Alertmanager service:
8/8: Conclusion
That's it! You've installed Prometheus and Alertmanager on Ubuntu. You can now create alerting rules and configure Alertmanager to send notifications. Enjoy monitoring and alerting! #DevOps #Prometheus #Alertmanager #Linux #Cloud #Logging #Monitoring
That's it! You've installed Prometheus and Alertmanager on Ubuntu. You can now create alerting rules and configure Alertmanager to send notifications. Enjoy monitoring and alerting! #DevOps #Prometheus #Alertmanager #Linux #Cloud #Logging #Monitoring
Prometheus Jobs -
In the context of Prometheus, "jobs" refer to targets or services that Prometheus scrapes for metrics. Here are five different types of job examples:
In the context of Prometheus, "jobs" refer to targets or services that Prometheus scrapes for metrics. Here are five different types of job examples:
1/ Node Exporter Job:
The Node Exporter job is used to collect system-level metrics from a host machine. It provides information about CPU usage, memory usage, disk I/O, and network statistics.
The Node Exporter job is used to collect system-level metrics from a host machine. It provides information about CPU usage, memory usage, disk I/O, and network statistics.
2/ HTTP Endpoint Job:
This job is used to scrape metrics from an HTTP endpoint. For example, you can monitor the response times and error rates of a web application by configuring Prometheus to scrape metrics from the application's HTTP endpoint.
This job is used to scrape metrics from an HTTP endpoint. For example, you can monitor the response times and error rates of a web application by configuring Prometheus to scrape metrics from the application's HTTP endpoint.
3/ Database Exporter Job:
Database exporters like the PostgreSQL Exporter or MySQL Exporter allow you to collect metrics from database systems. You can monitor database query performance, connections, and other database-specific metrics.
Database exporters like the PostgreSQL Exporter or MySQL Exporter allow you to collect metrics from database systems. You can monitor database query performance, connections, and other database-specific metrics.
4/ Container Orchestration Job:
In containerized env's like Kubernetes, u can create jobs to monitor the performance of ur containers, pods, or services. For instance, u can use the Kubernetes State Metrics Exporter to scrape metrics related to ur cluster's health & workload.
In containerized env's like Kubernetes, u can create jobs to monitor the performance of ur containers, pods, or services. For instance, u can use the Kubernetes State Metrics Exporter to scrape metrics related to ur cluster's health & workload.
5/ Custom Application Job:
For custom applications, you can instrument your code to expose Prometheus-compatible metrics. Then, configure Prometheus to scrape these metrics. This allows you to monitor application-specific performance, error rates, and other relevant data.
For custom applications, you can instrument your code to expose Prometheus-compatible metrics. Then, configure Prometheus to scrape these metrics. This allows you to monitor application-specific performance, error rates, and other relevant data.
These are just a few examples, and Prometheus can be used to monitor a wide range of services and systems, making it a versatile tool for observability and monitoring.
Repost the thread if you find it useful. Thanks!
Loading suggestions...