

#Fundamental Analysis
MPS Ltd.
Market Cap: 3,000 Cr.
3-year Sales CAGR: 17%
3-year PAT CAGR: 22%
ROE: 25%
PE: 31x
MPS Ltd.
Market Cap: 3,000 Cr.
3-year Sales CAGR: 17%
3-year PAT CAGR: 22%
ROE: 25%
PE: 31x
#BusinessOverview: MPS is a premium B2B company that provides platforms, content&learning solutions for the digital world, was established as an Indian subsidiary of Macmillan Limited in 1970-MPS has 13 delivery centers across 3 continents-Average Client relationship of 20+ yrs
Segmental Analysis:
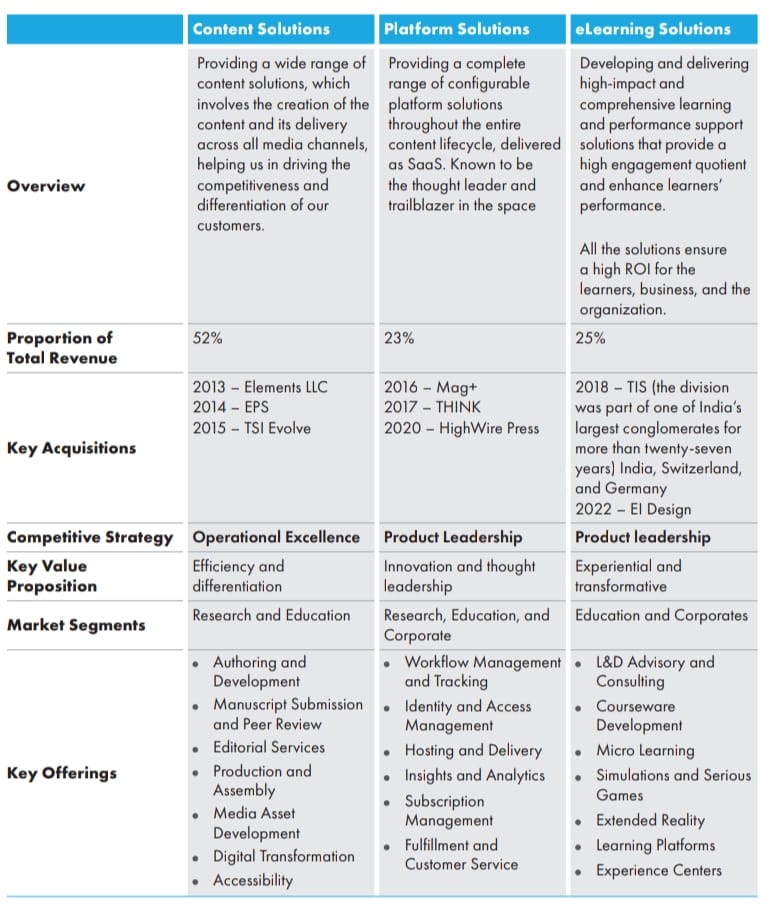
1. Content Solutions (Revenue Contribution: 52%)
-Providing comprehensive content Solutions like content Development, Assembly, transformation & Fulfillment
-Adopting machine learning & advanced analytics technology to reduce turnaround time & cost
1. Content Solutions (Revenue Contribution: 52%)
-Providing comprehensive content Solutions like content Development, Assembly, transformation & Fulfillment
-Adopting machine learning & advanced analytics technology to reduce turnaround time & cost
2. Platform solutions(Revenue Contribution: 23%)
-MPS provide customised platform solutions in this segment like usage analytics, order & subscription management, customer services & so on
-MPS provide customised platform solutions in this segment like usage analytics, order & subscription management, customer services & so on
-Growth opportunity: Cross selling different products to customers & inclusion of more customised offering
3. Learning Solutions
-Here MPS provides comprehensive learning & performance support solutions like Mobile Learning, Simulations,AR/VR/Mixed reality,serious gaming & so on
3. Learning Solutions
-Here MPS provides comprehensive learning & performance support solutions like Mobile Learning, Simulations,AR/VR/Mixed reality,serious gaming & so on
-Targeting Edtech sector for future growth
MPS Customers Includes: Publishers, Corporations, Universities & content aggregators
MPS Customers Includes: Publishers, Corporations, Universities & content aggregators
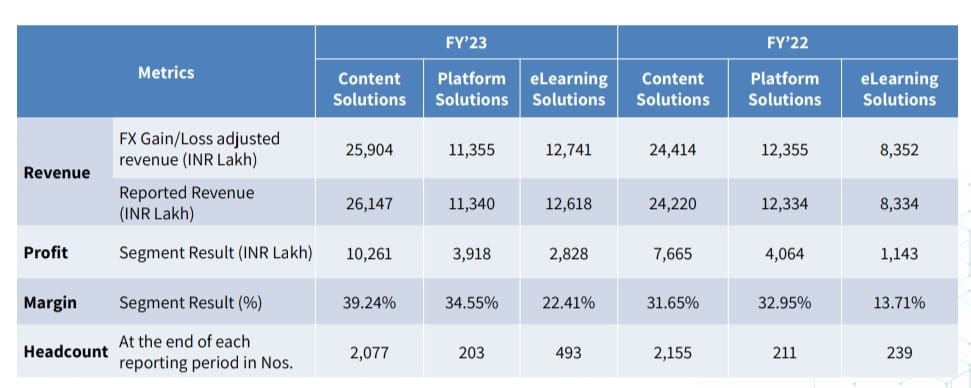
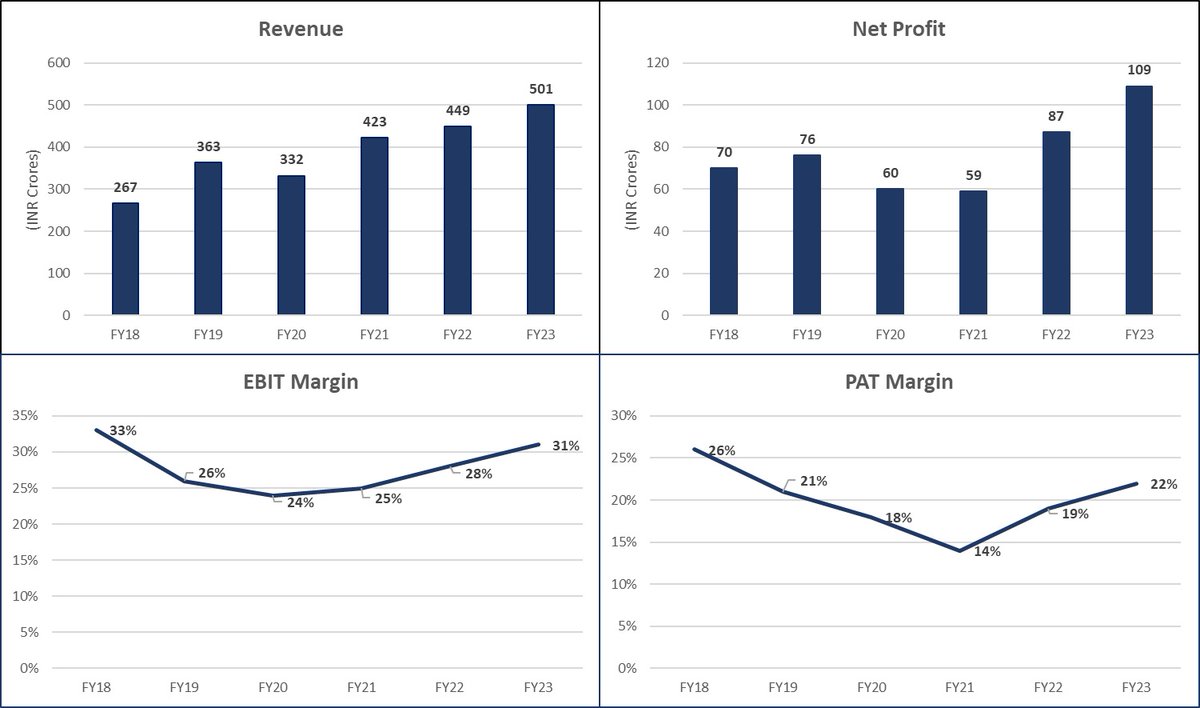
Financials
-Sales has grown from 224 to 298 Cr in 5 years (6% CAGR)
-OPM has expanded to 40%
-PAT has grown from 75 to 86 Cr in 5 years (8% CAGR)
-Sales has grown from 224 to 298 Cr in 5 years (6% CAGR)
-OPM has expanded to 40%
-PAT has grown from 75 to 86 Cr in 5 years (8% CAGR)
Ratios:
1. ROCE at 33.7%
2. ROE at 25.4%
3. D/E at 0.02
4. OPM at 40%
5. Net Profit Margin at 29%
1. ROCE at 33.7%
2. ROE at 25.4%
3. D/E at 0.02
4. OPM at 40%
5. Net Profit Margin at 29%
Opportunity
1-MPS has advanced into AI/ML recently
2-Rapid Growth in Digital consumptions
3-Expanding Footprints in other geographies
4-Cross-selling different products
5-Mobile base,Video base learnings trend (Demand for remote learnings)
6-Customer base of 700+
1-MPS has advanced into AI/ML recently
2-Rapid Growth in Digital consumptions
3-Expanding Footprints in other geographies
4-Cross-selling different products
5-Mobile base,Video base learnings trend (Demand for remote learnings)
6-Customer base of 700+
Risks
1-Industry risk: If Downturn in end users industry happen, it will directly impact MPS
2-Client Concentration risk: Top 10 customers contribute 46% of Revenue
3-Geographical concentration risk: 91% revenue contribution from North America & UK/Europe
1-Industry risk: If Downturn in end users industry happen, it will directly impact MPS
2-Client Concentration risk: Top 10 customers contribute 46% of Revenue
3-Geographical concentration risk: 91% revenue contribution from North America & UK/Europe
4-Competition: Highly Fragmented market with very small players
5-Currency risk: More than 90% revenue is from outside India
5-Currency risk: More than 90% revenue is from outside India
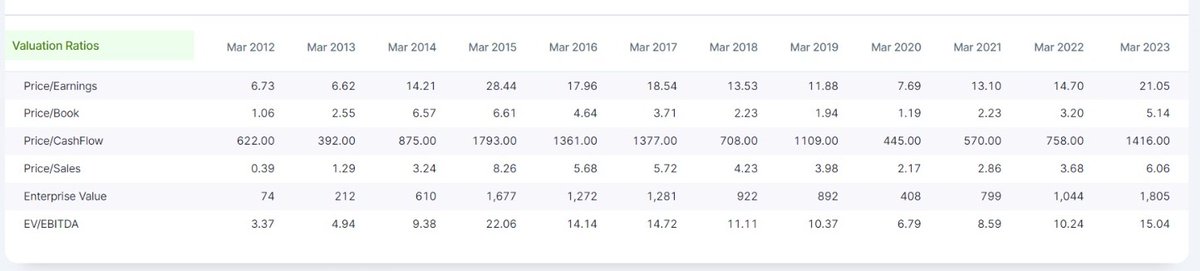
Valuations:
-Current P/E: 31x
-3 year Median P/E: 18x
-EV/EBITDA: 20x
-3 year Median EV/EBITDA: 10.7x
-Industry P/E: 40x
-Current P/E: 31x
-3 year Median P/E: 18x
-EV/EBITDA: 20x
-3 year Median EV/EBITDA: 10.7x
-Industry P/E: 40x
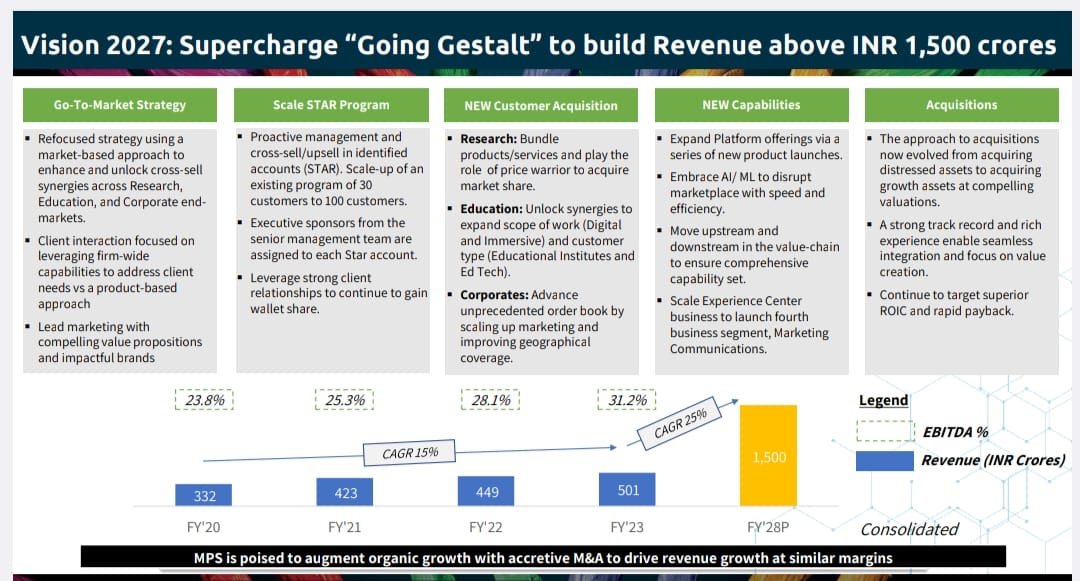
Guidance
-Revenue of 1500 Cr. by FY28 (25% CAGR)
-Targeting 60% inorganic & 40% organic growth to achieve FY28 guidance
-Stable margins are in range of 40-45%
-Revenue of 1500 Cr. by FY28 (25% CAGR)
-Targeting 60% inorganic & 40% organic growth to achieve FY28 guidance
-Stable margins are in range of 40-45%
Point-and-Figure (P&F) Chart
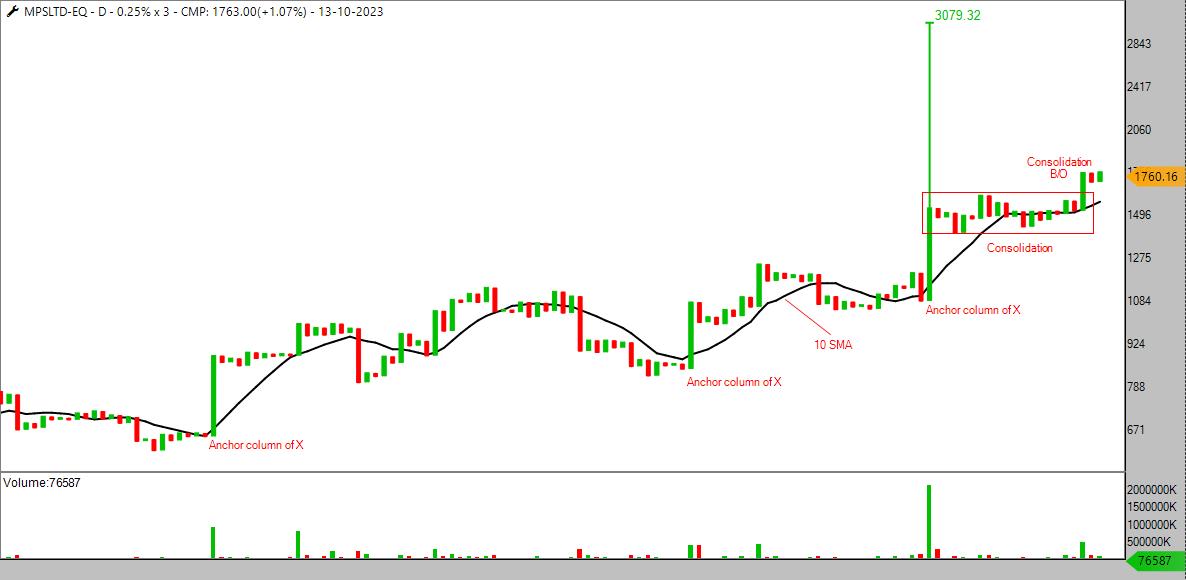
The stock chart of the company on the 0.25% x 3 PnF timeframe indicates a Strong configuration, with the stock maintaining its position above the 10SMA and B/O of consolidation phase.
The extended columns of X on the chart signify the dominance of the bulls which augurs well for potential future price fluctuations.Considering the favorable R:R stock price seems to present a promising entry point, with a particularly advantageous R:R of 1:4.5
Candlestick chart
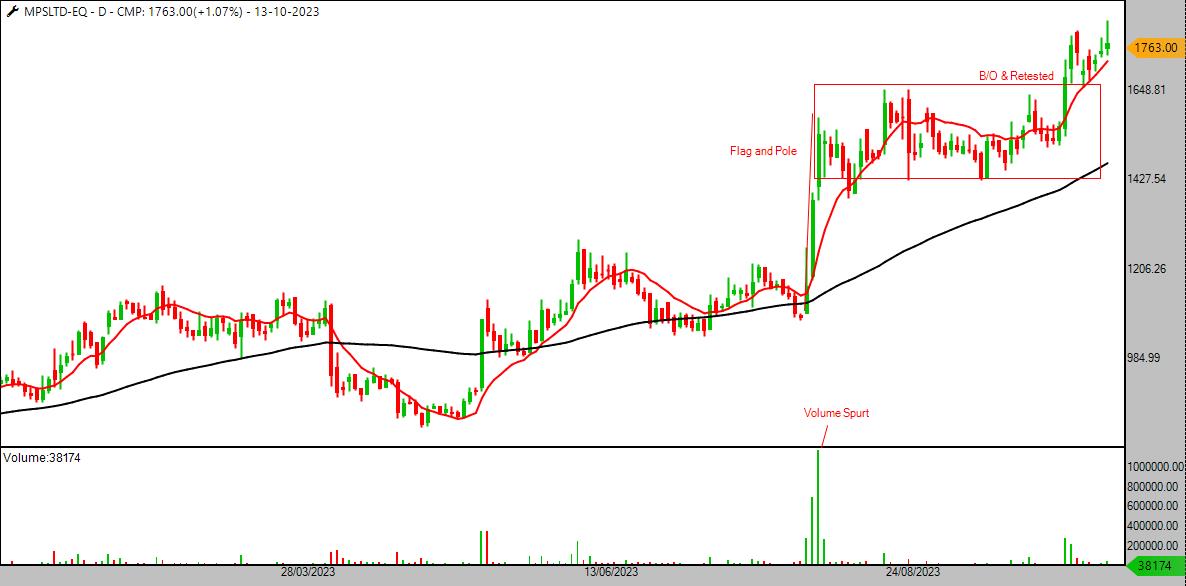
The B/O of the flag & pole pattern, which will result in a significant upward advance. Acc. to Flag & Pole pattern analysis, the company's predicted aim is 1970, which represents a big potential milestone for investors.
The stock is trading above 200DEMA, and has been continuously trading above the 21DEMA in recent times, indicating that the bullish momentum is continuing. Previous stock uptrends were marked by high volume bars, signifying strong market buying power.
Note : No Recommendation
This post is for educational purposes
For more such analysis follow @AsisMaurya16 & @BansalSwapan
This post is for educational purposes
For more such analysis follow @AsisMaurya16 & @BansalSwapan
Loading suggestions...