

Ever wondered how Moving Averages can guide your trades?
Buckle up for an interesting insight into Moving Averages and its usage.
Thread ⬇️
Buckle up for an interesting insight into Moving Averages and its usage.
Thread ⬇️
𝗠𝗼𝘃𝗶𝗻𝗴 𝗔𝘃𝗲𝗿𝗮𝗴𝗲𝘀
One of the most widely used yet least explored indicators:
In this thread, we will learn:
What are Moving Averages (MA)?
How to use them?
What is Mean reversion?
What is Disparity? With some examples
One of the most widely used yet least explored indicators:
In this thread, we will learn:
What are Moving Averages (MA)?
How to use them?
What is Mean reversion?
What is Disparity? With some examples
Moving Averages, simple yet profound. A smooth curve gives the direction of 'the trend'. Bullish or bearish? The answer lies in the slope and the price movement.
MA is a unique blend of statistical calculations, derived from the price. In Technical Analysis, MA is the knight that smoothens the price action data, creating an ever-updating average price.
'Moving' indicates the constant data change and 'Average' is the sum of all data points divided by their total number.
The word "Moving" means when a new data point is entered into the calculation, an old data point is removed from the calculation. "Average" is the summation of all the data points divided by the number of Data Points.
By calculating this price action data as an average, we essentially reduce the impact of short-term and random price fluctuations of price over a specified timeframe. There are three popularly used MAs.
1. Simple MA.
2. Exponential MA.
3. Weighted MA.
1. Simple MA.
2. Exponential MA.
3. Weighted MA.
𝗦𝗶𝗺𝗽𝗹𝗲 𝗮𝗻𝗱 𝗘𝘅𝗽𝗼𝗻𝗲𝗻𝘁𝗶𝗮𝗹. Think of them as the tortoise and the hare. The latter reacts faster to price changes. Pick as per your trade pace.
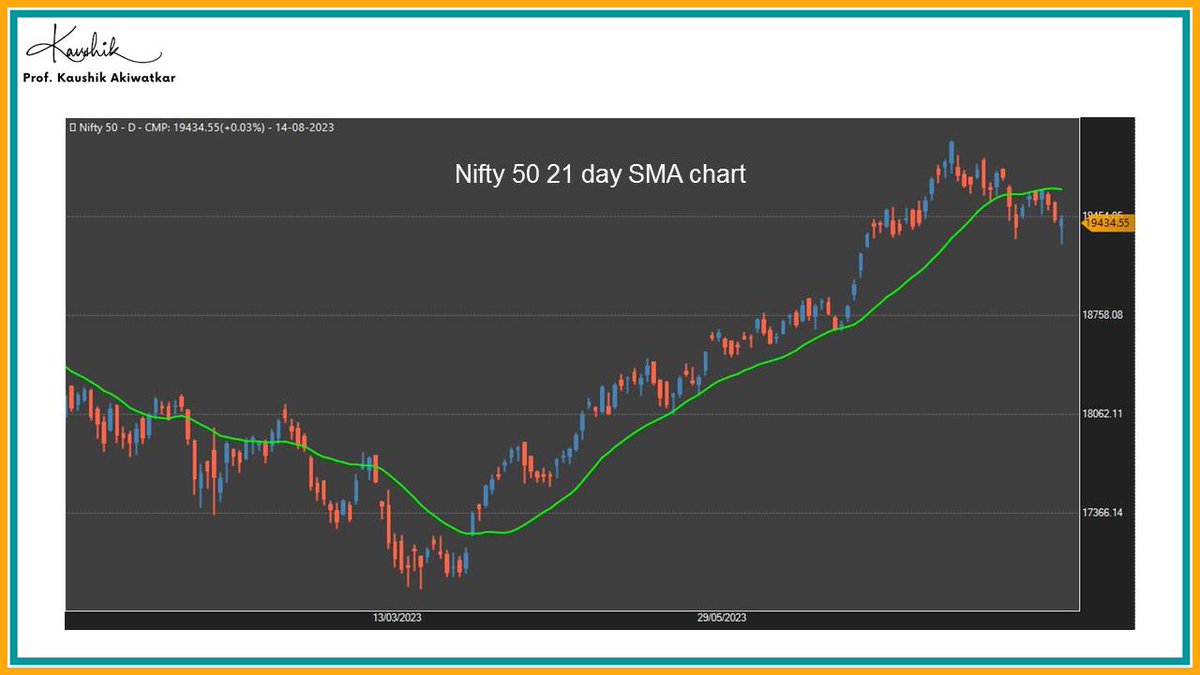
𝗦𝗶𝗺𝗽𝗹𝗲 𝗠𝗔 is simply the Average of the closing prices over a specific number of periods. For example, 21 days Simple MA = (p1+p2+......+p21)/21. Here, p(n) is the closing price of the asset previous "n"th candle from today.
𝗘𝘅𝗽𝗼𝗻𝗲𝗻𝘁𝗶𝗮𝗹 𝗠𝗔 (𝗘𝗠𝗔) is a moving average calculated similarly to Simple MA. However, the difference in calculation is that EMA gives more weight to the most recent data point and less weight to the old data point.
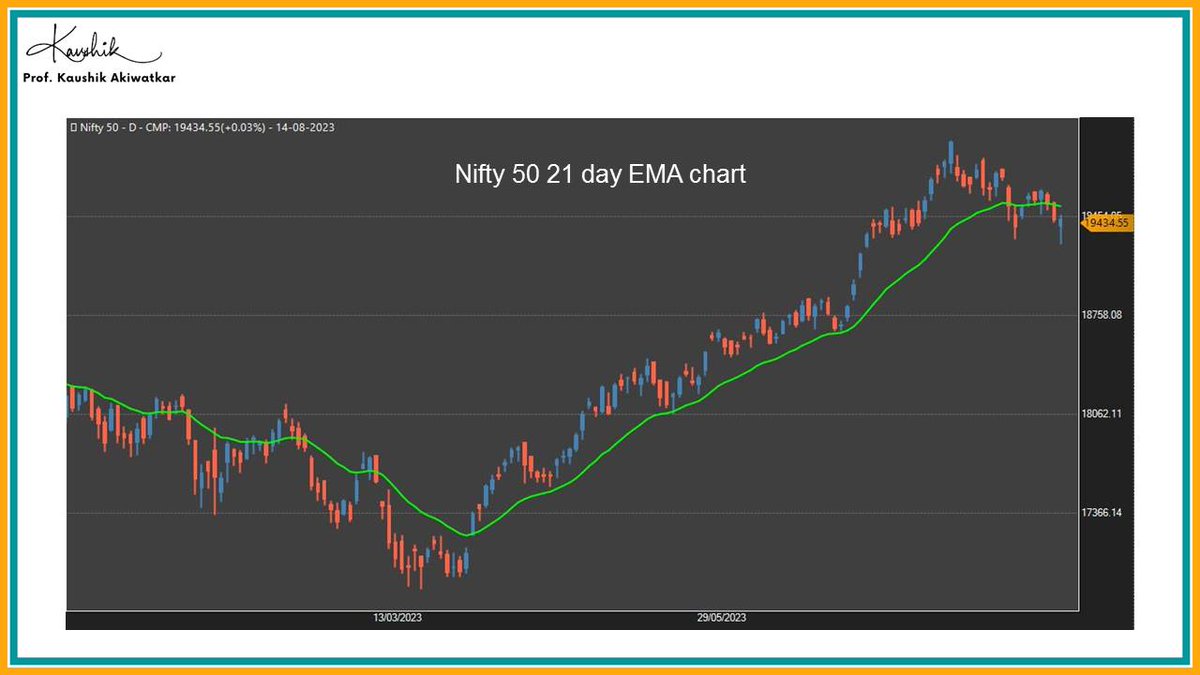
EMA smoothens the Simple MA to incorporate new information and to give more importance to new and recent information. Simple MA moves at a slower pace relative to EMA when reacting to the price change.
𝗪𝗼𝗻𝗱𝗲𝗿𝗶𝗻𝗴 𝗵𝗼𝘄 𝘁𝗼 𝘂𝘀𝗲 𝗠𝗔?
Here is how I am using EMA:
i. As a Trend filter
ii. As a Trend Channel
iii. As an Area of value, and
iv. As a supply and demand zone
Here is how I am using EMA:
i. As a Trend filter
ii. As a Trend Channel
iii. As an Area of value, and
iv. As a supply and demand zone
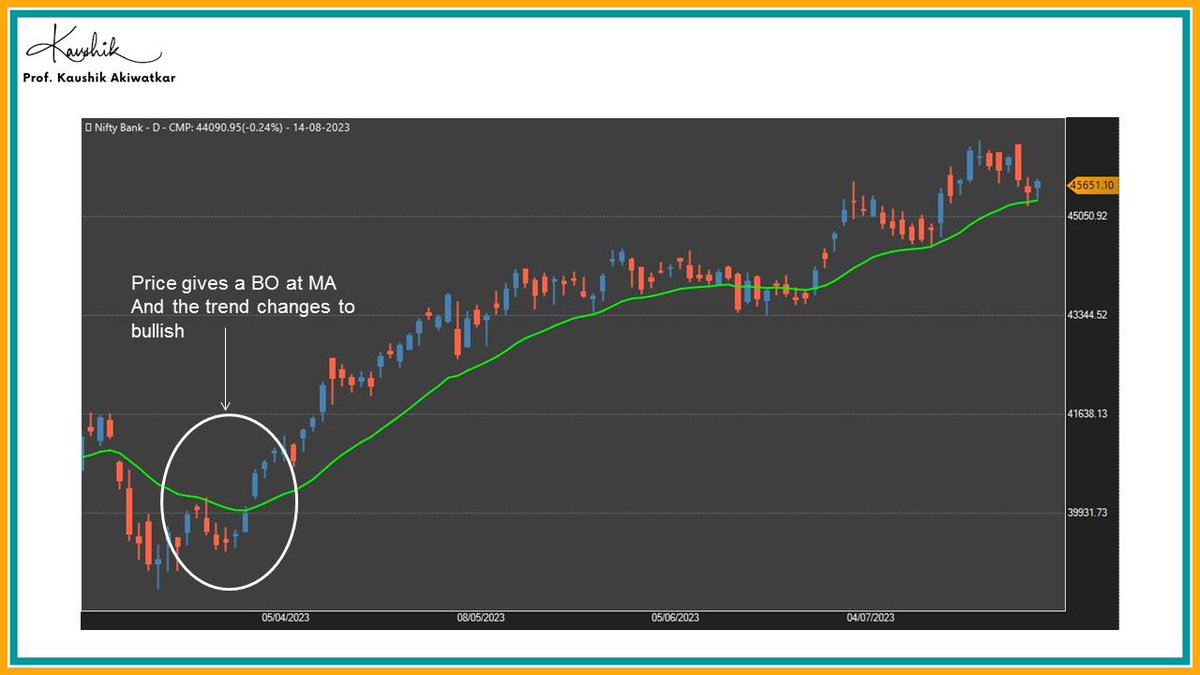
𝗧𝗿𝗲𝗻𝗱 𝗳𝗶𝗹𝘁𝗲𝗿:
When the price is trading above the EMA, we can say that the trend is an uptrend and when the price is trading below the EMA, we can say that the trend is a downtrend.
When the price is trading above the EMA, we can say that the trend is an uptrend and when the price is trading below the EMA, we can say that the trend is a downtrend.
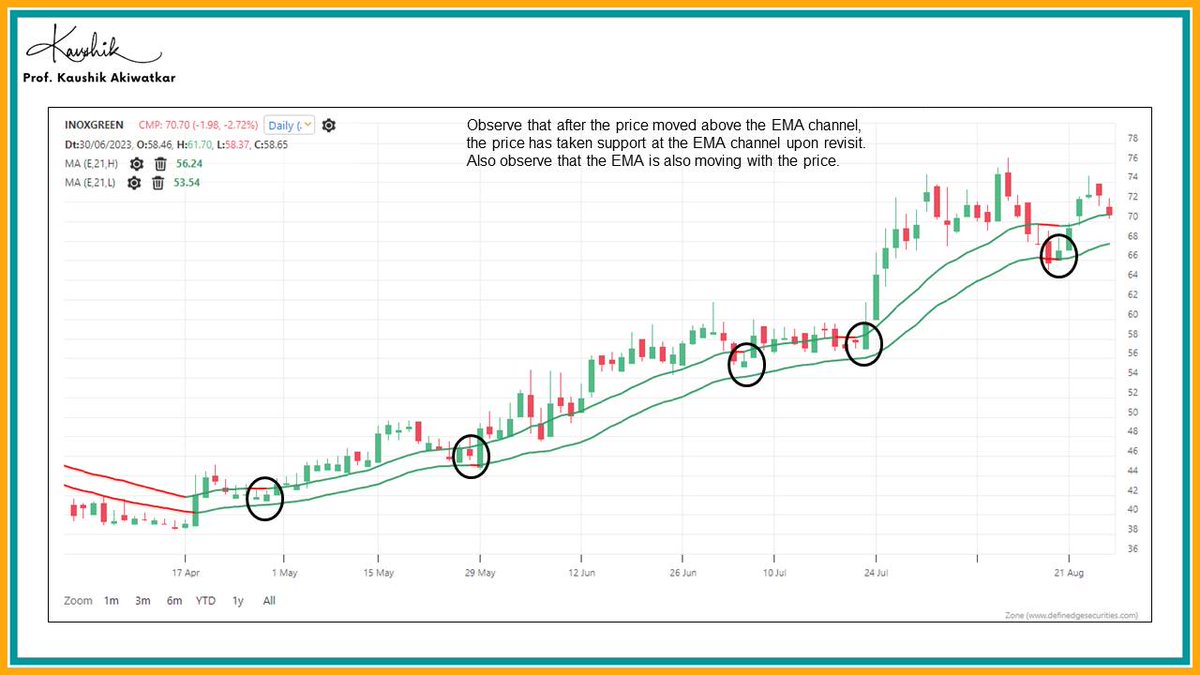
𝗧𝗿𝗲𝗻𝗱 𝗖𝗵𝗮𝗻𝗻𝗲𝗹:
Although we use only closing prices as our input for calculation, we can plot two separate moving average lines based on either high and low or open and close to create a trend channel. This channel can also act as a trend filter.
Although we use only closing prices as our input for calculation, we can plot two separate moving average lines based on either high and low or open and close to create a trend channel. This channel can also act as a trend filter.
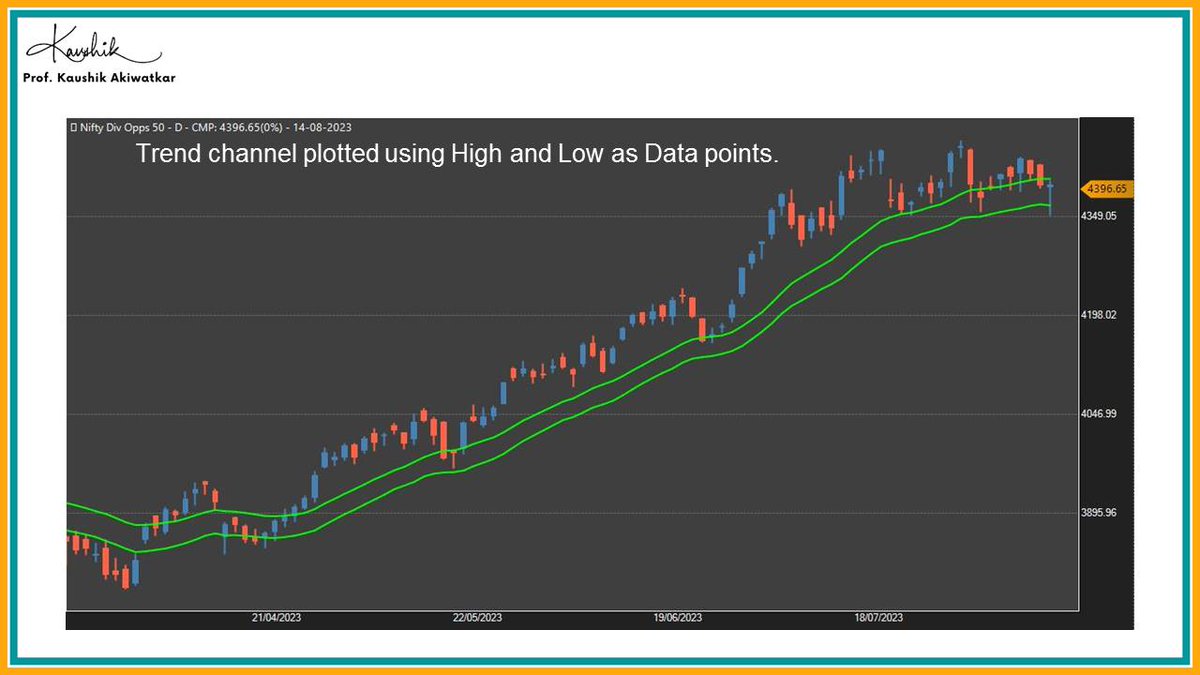
One more example on Trend Channel
𝗔𝗿𝗲𝗮 𝗼𝗳 𝘃𝗮𝗹𝘂𝗲:
Moving averages are the averages of the closing prices and therefore act as areas of value. This means that significant price action can take place near the MA. When the price visits the MA, we can build a trade set-up based on the price action.
Moving averages are the averages of the closing prices and therefore act as areas of value. This means that significant price action can take place near the MA. When the price visits the MA, we can build a trade set-up based on the price action.
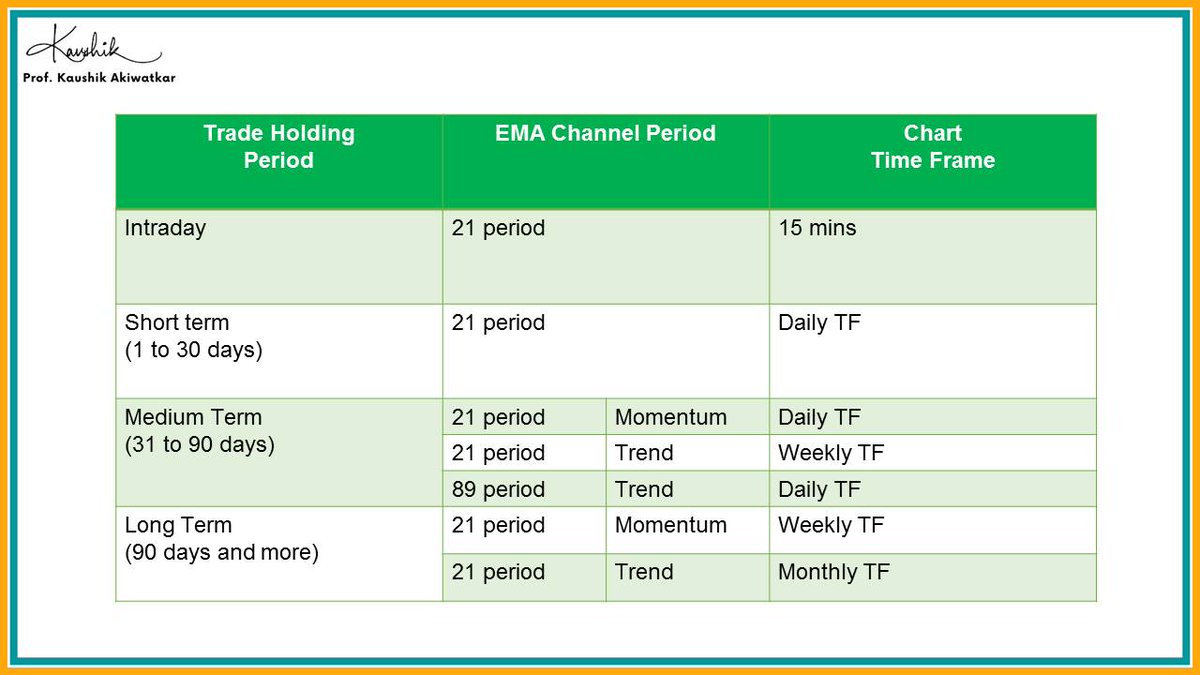
The time frame we use also has an impact on the MA. As a rule of thumb, I use 21 EMA on 15 mins TF for intraday analysis, and 21 EMA on the daily timeframe for a 1 to 30 days holding period.
I also use 21-period EMA on weekly TF to analyze the trend for a 31 to 90-day holding period. 21-period EMA on weekly or monthly TF is also used for momentum or trend analysis for long-term investment respectively.
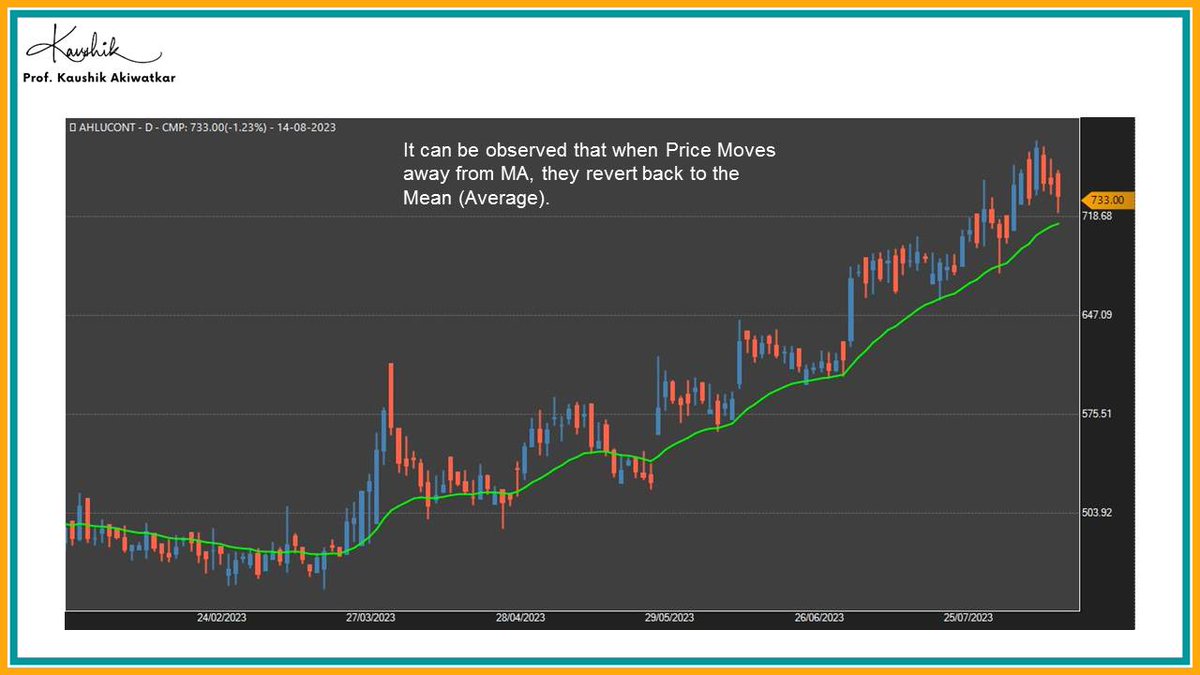
The concept of 𝗠𝗲𝗮𝗻 𝗥𝗲𝘃𝗲𝗿𝘀𝗶𝗼𝗻 is very interesting. Mean reversion is a financial term that assumes that the asset price will eventually tend to converge to the mean (average) price. Therefore, no matter how far the price moves away from MA, it will revert back to it.
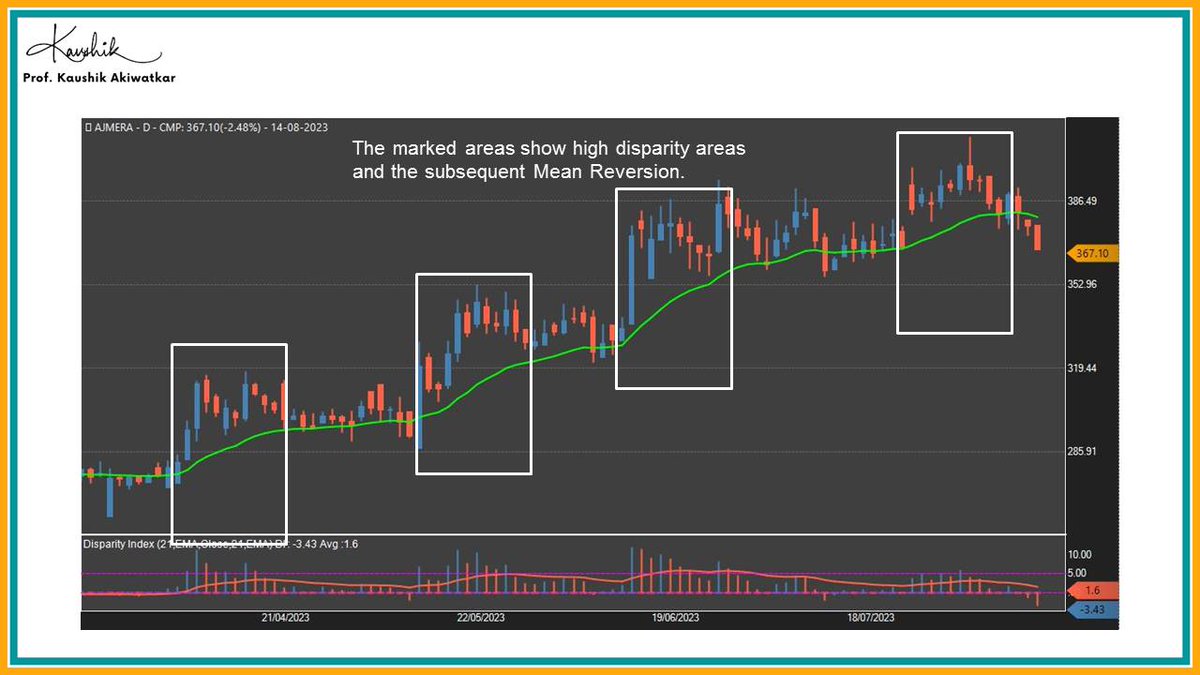
The concept of Disparty is very interesting and important for analysis. It helps us understand how the instrument will behave at a certain point.
𝗧𝗵𝗲 𝗱𝗶𝘀𝗽𝗮𝗿𝗶𝘁𝘆 𝗶𝗻𝗱𝗲𝘅 is a technical indicator that measures the relative position of an asset's most recent closing price to a selected MA and reports the values as a percentage.
If the price is trading away from the MA, the disparity is high and has a higher chance of reverting back.
If the price is trading near the MA, the disparity is low, and has a higher chance of moving away from the MA.
If the price is trading near the MA, the disparity is low, and has a higher chance of moving away from the MA.
We can develop good trading and investing setups using the concepts of Dispartiy, Mean Reversion, and different periods of MAs
I have explained the concept in much detail in this video
youtube.com
youtube.com

If this thread helped you, please re-tweet and help others in their learning curve.
If you like my content, follow me on @kaushikaki
If you like my content, follow me on @kaushikaki
Loading suggestions...