

Most Essential Stock Chart Patterns
1. Ascending triangle
2. Descending triangle
3. Symmetrical triangle
4. Pennant
5. Flag
6. Wedge
7. Double bottom
8. Double top
9. Head and shoulders
10. Rounding top or bottom
11. Cup and handle
1. Ascending triangle
2. Descending triangle
3. Symmetrical triangle
4. Pennant
5. Flag
6. Wedge
7. Double bottom
8. Double top
9. Head and shoulders
10. Rounding top or bottom
11. Cup and handle
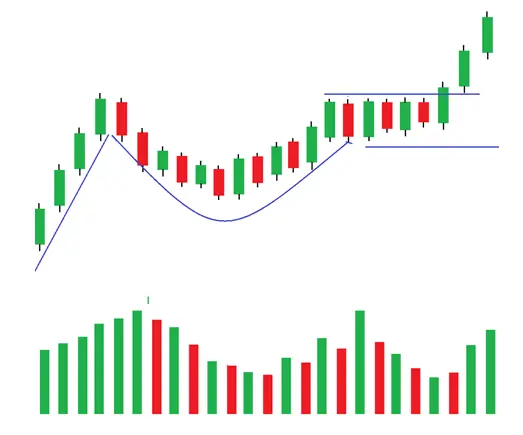
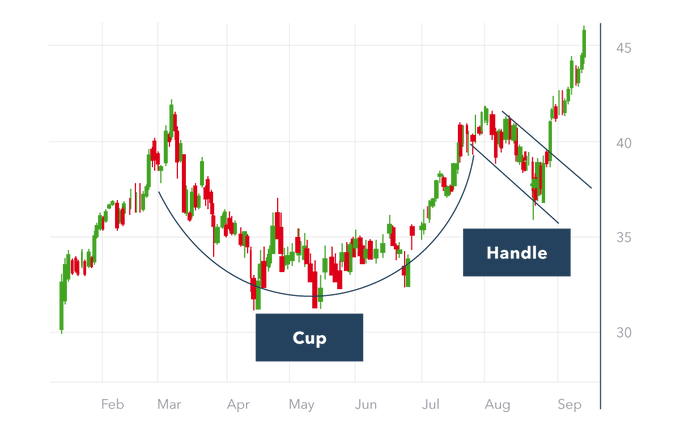
Cup and handle:
The cup and handle is a well-known continuation stock chart pattern that signals a bullish market trend. The cup appears similar to a rounding bottom chart pattern, and the handle is similar to a wedge pattern
@mystock_myview
@GarvModi70
@cakunalshah1983
The cup and handle is a well-known continuation stock chart pattern that signals a bullish market trend. The cup appears similar to a rounding bottom chart pattern, and the handle is similar to a wedge pattern
@mystock_myview
@GarvModi70
@cakunalshah1983
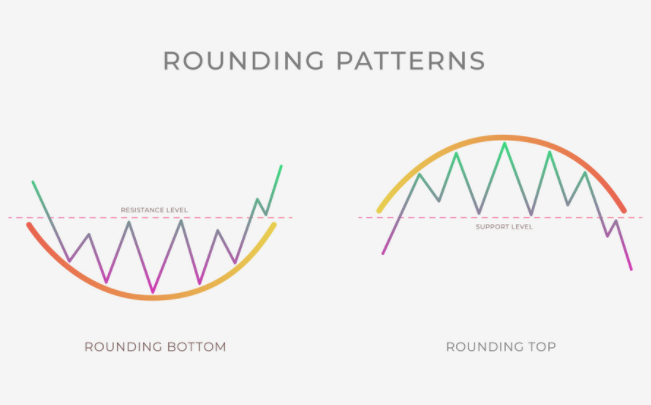
Rounding top/bottom:
The rounded top and bottom are reversal patterns designed to catch the end of a trend and signal a potential reversal point on a price chart.
@MeghaTrader_MT
@Breakoutrade94
@STOCKBAGGER1
@BakuSarman
The rounded top and bottom are reversal patterns designed to catch the end of a trend and signal a potential reversal point on a price chart.
@MeghaTrader_MT
@Breakoutrade94
@STOCKBAGGER1
@BakuSarman
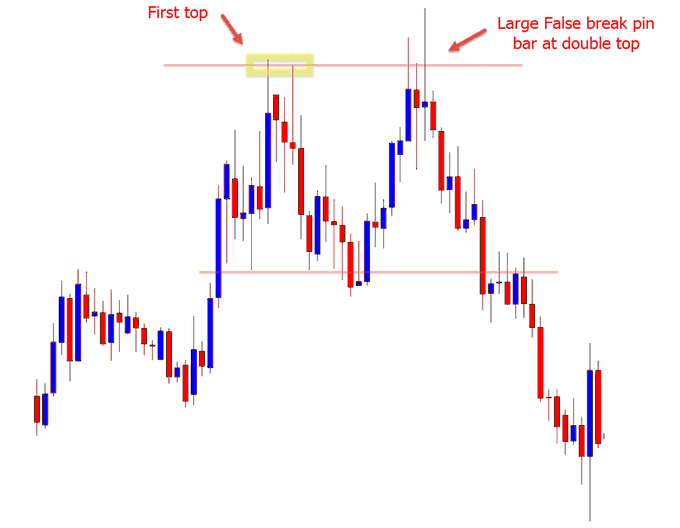
Double top:
A double top looks much like the letter M. An asset’s price will experience a peak, before retracing back to a level of support. It will then climb up once more before reversing back more permanently against the prevailing trend.
@WaveFinancial
@Ishan_Narayan_
A double top looks much like the letter M. An asset’s price will experience a peak, before retracing back to a level of support. It will then climb up once more before reversing back more permanently against the prevailing trend.
@WaveFinancial
@Ishan_Narayan_
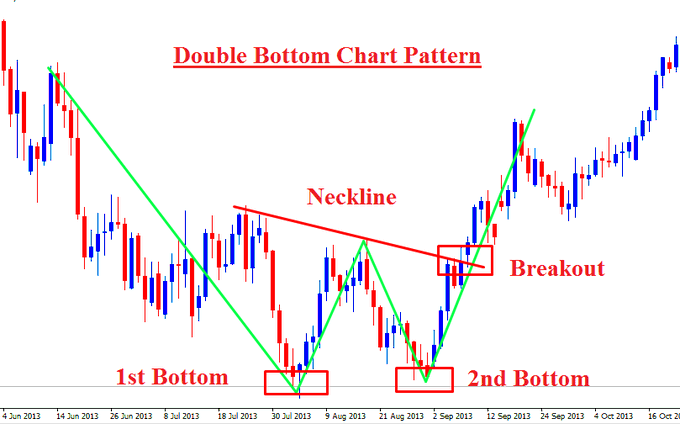
Double bottom:
A double bottom looks similar to the letter W and indicates when the price has made two unsuccessful attempts at breaking through the support level. It is a reversal chart pattern as it highlights a trend reversal.
@GirishAnchanWMA
@me__kaushik
@RICHADICT
A double bottom looks similar to the letter W and indicates when the price has made two unsuccessful attempts at breaking through the support level. It is a reversal chart pattern as it highlights a trend reversal.
@GirishAnchanWMA
@me__kaushik
@RICHADICT
Wedge:
A wedge pattern represents a tightening price movement between the support and resistance lines. There are two types of wedge: rising and falling.
@TechnoChartist
@Addition_Singh
@Niteish_14
A wedge pattern represents a tightening price movement between the support and resistance lines. There are two types of wedge: rising and falling.
@TechnoChartist
@Addition_Singh
@Niteish_14

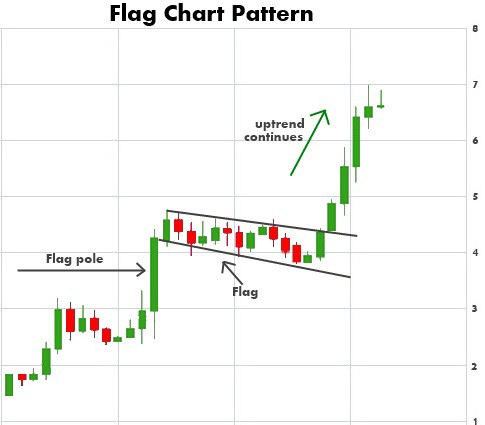
Flag stock chart pattern:
A flag chart pattern is formed when the market consolidates in a narrow range after a sharp move.
@Earner_Sanjeev
@sonaliktalreja
@ent_wala
A flag chart pattern is formed when the market consolidates in a narrow range after a sharp move.
@Earner_Sanjeev
@sonaliktalreja
@ent_wala
Loading suggestions...