

📚An example of 100% unbiased trading step by step.
1) Identifying the higher timeframe trend [no bias]
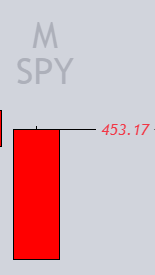
On the month we are bright red, this means that the monthly participation group has decided to "sell, slam the bid & do it this month".
That can NOT be refuted.
1) Identifying the higher timeframe trend [no bias]
On the month we are bright red, this means that the monthly participation group has decided to "sell, slam the bid & do it this month".
That can NOT be refuted.
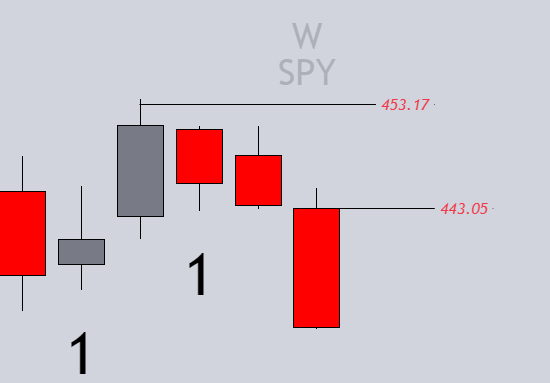
1.b) The weekly participation group when under the weekly open has decided to "sell, hit the bid & do it this week"
We have also seen a multi-week consolidation breakout. Two bars inside to the mother bar & then broken lower.
This can not be refuted.
We have also seen a multi-week consolidation breakout. Two bars inside to the mother bar & then broken lower.
This can not be refuted.
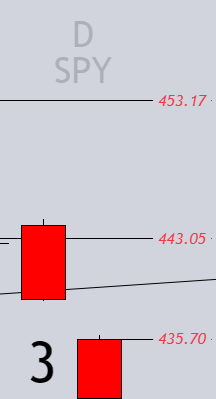
1.c) On the daily, under the daily open the participants have decided to
"Sell, hit the bid and do it today"
"Sell, hit the bid and do it today"
2) Now how do we trade this?
Since the prior day was bright red it can be expected that any longs were absolutely decimated. Those who shorted, could have stayed short as it went out on the lows.
Therefore, some corrective activity would help speed things up today.
Since the prior day was bright red it can be expected that any longs were absolutely decimated. Those who shorted, could have stayed short as it went out on the lows.
Therefore, some corrective activity would help speed things up today.
2.b) Corrective activity is simply understanding that the D W M are bright red and anytime the 60min is green there is 60min participants buying while the other 3 known participation groups are selling.
This means those people are in 'ill timed' long positions.
This means those people are in 'ill timed' long positions.
2.c) We also know people put their stops at obvious pivots or where they got in. This is useful for a couple reasons.
[next tweet]
[next tweet]
1) We know if they're buying it occurs during a green 60min candle
2) We know their stops will be at obvious pivots or where they got in
3) When we trade back through their stops they will be forced to sell, thus taking liquidity from the other aggressive sellers...
2) We know their stops will be at obvious pivots or where they got in
3) When we trade back through their stops they will be forced to sell, thus taking liquidity from the other aggressive sellers...
...that we have identified on the day week & month timeframes.
This is what causes prices to speed up. People getting stopped out & aggressive participation from the other timeframes.
This is what causes prices to speed up. People getting stopped out & aggressive participation from the other timeframes.
3) So what do we look for Alex?
We look for candles going up. I know it's super simple but watch.
We look for candles going up. I know it's super simple but watch.
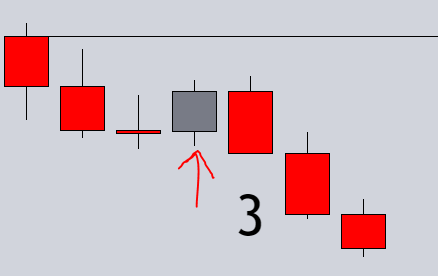
3.b) Anyone who has bought within that candle has a stop at an obvious pivot [shown on the m5 here] or at where they got in.
Therefore when the new 60minute opens and we have the 60 day week month timeframes all selling [below their opens] those people will be forced to sell.
Therefore when the new 60minute opens and we have the 60 day week month timeframes all selling [below their opens] those people will be forced to sell.
![3.b) Anyone who has bought within that candle has a stop at an obvious pivot [shown on the m5 here]...](https://pbs.twimg.com/media/F6k3DicWEAAHAhL.png)
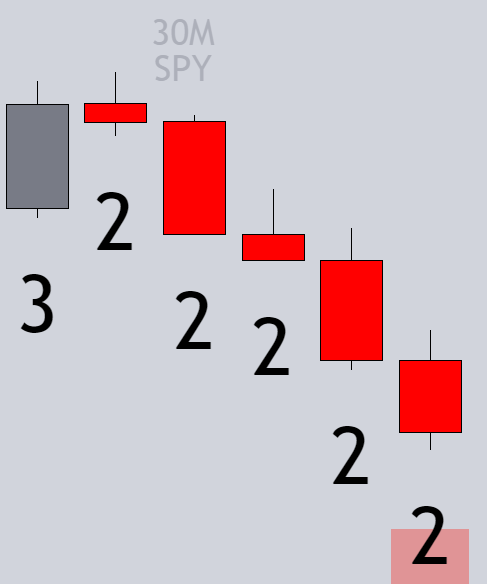
3.c) What you'll notice is once we take LOD things speed up. This is because we created a broadening formation & expanded it in the direction of full timeframe continuity. Aka the 4 major timeframes day week month 60 being in agreeance.
In this case red.
In this case red.
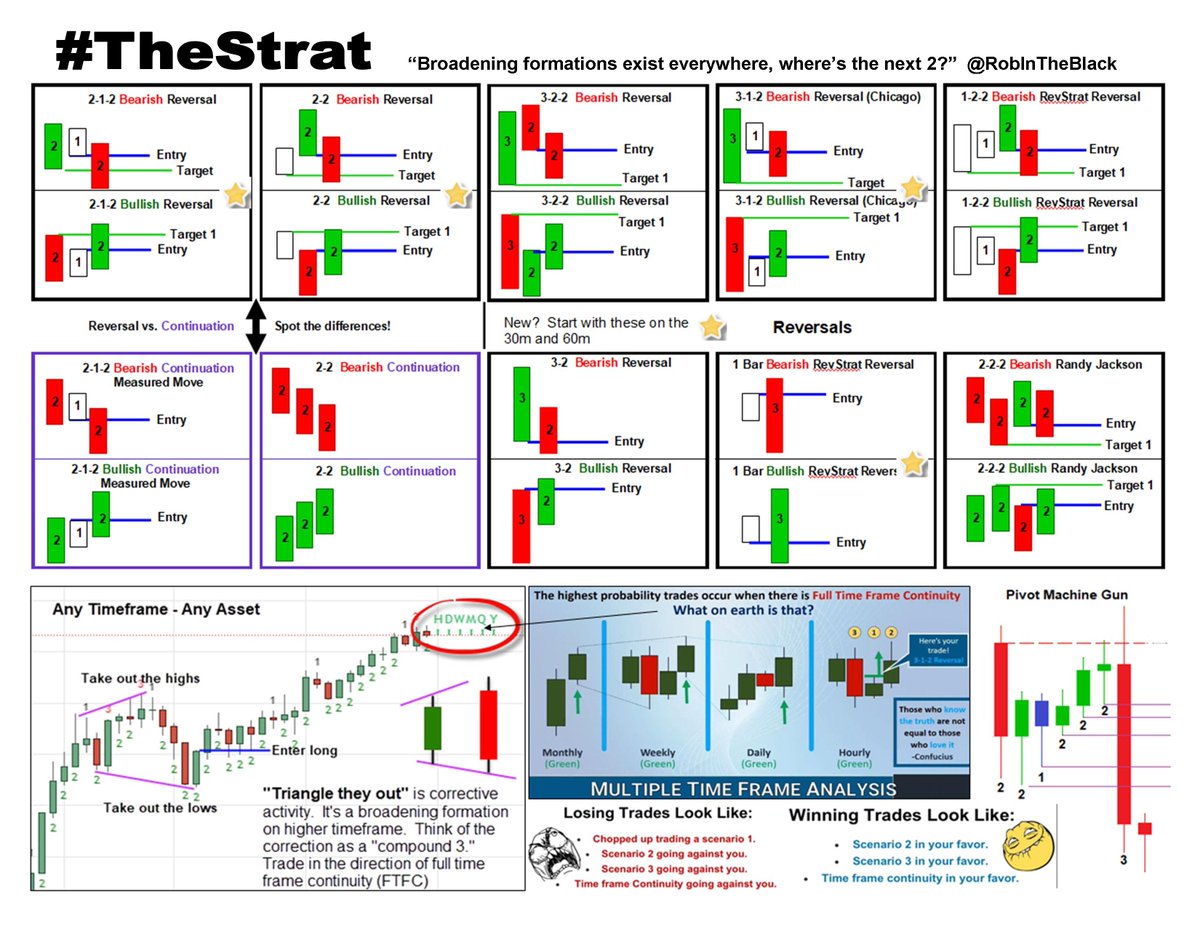
The way we enter on this is using any of these signals here. The broadening formation is denoted as a 3 on the higher timeframe so we traded the 3-2-2 on the 30min timeframe!
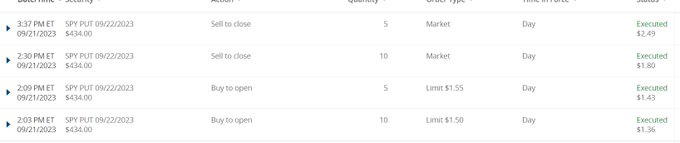
And as for the fills. You'll notice we add to winners. I took some off at LOD and set an alert to trail the rest further.
Not bad for just getting up from a nap.
I can do that because I have nothing to analyze I have no bias I have no work. Just identify FTFC & take signals.
Not bad for just getting up from a nap.
I can do that because I have nothing to analyze I have no bias I have no work. Just identify FTFC & take signals.
The indicator used can be found on tradingview under the name of "Timeframe Continuity" by TFO.
If you'd like to learn more about #TheStrat I do have a series where I put out a video a week. You can go into the description to find the original videos!
If you'd like to learn more about #TheStrat I do have a series where I put out a video a week. You can go into the description to find the original videos!
We also do have a free discord of traders trading the same strategy. And since it's unbiased and objective it's easy to converse about! If you'd like to check it out can do so here👇
stratalerts.com
Please share if you'd like to see more!
stratalerts.com
Please share if you'd like to see more!

Loading suggestions...