

🚨 Unlocking Trading Strategies: Discovering Key Levels + SUPPLY/DEMAND Zones with These Easy Techniques! 📈📉
This thread 🧵will go over how I plot my fresh S/D Zones every day including insights that make me profitable with trading in the Stock Market! 👇
$SPY $QQQ $IWM $TSLA
This thread 🧵will go over how I plot my fresh S/D Zones every day including insights that make me profitable with trading in the Stock Market! 👇
$SPY $QQQ $IWM $TSLA


My strategy is very simple, you'll learn more about it below 👇
I'll also dive into the Basics/Techniques I use to identify fresh daily Supply/Demand zones with Trade Examples 📊
Discover how these strategies have helped me stay consistently profitable in the stock market!
🧵:
I'll also dive into the Basics/Techniques I use to identify fresh daily Supply/Demand zones with Trade Examples 📊
Discover how these strategies have helped me stay consistently profitable in the stock market!
🧵:
If you're new to the concepts, don't worry, I've simplified it to help all levels of understanding 📚
Learn how Supply and Demand influence prices and gain valuable insights into market dynamics below 👇
Learn how Supply and Demand influence prices and gain valuable insights into market dynamics below 👇
Markets are governed by Laws of Supply/Demand
S/D Zones are pricing levels where unfulfilled orders wait to be met & are created by banks & other such institutions 🏦
Traders must precisely pinpoint these Zones in order to master the concepts of Supply/Demand...
Cont:⬇️
S/D Zones are pricing levels where unfulfilled orders wait to be met & are created by banks & other such institutions 🏦
Traders must precisely pinpoint these Zones in order to master the concepts of Supply/Demand...
Cont:⬇️
First off, let's dive into the basics and understand what/how you can use these concepts to trade: 👇
Speed is the key to understanding supply and demand (the rate of change in price)
Rapid pricing changes indicate institutional activity and slow price changes result in chop 📈
Speed is the key to understanding supply and demand (the rate of change in price)
Rapid pricing changes indicate institutional activity and slow price changes result in chop 📈
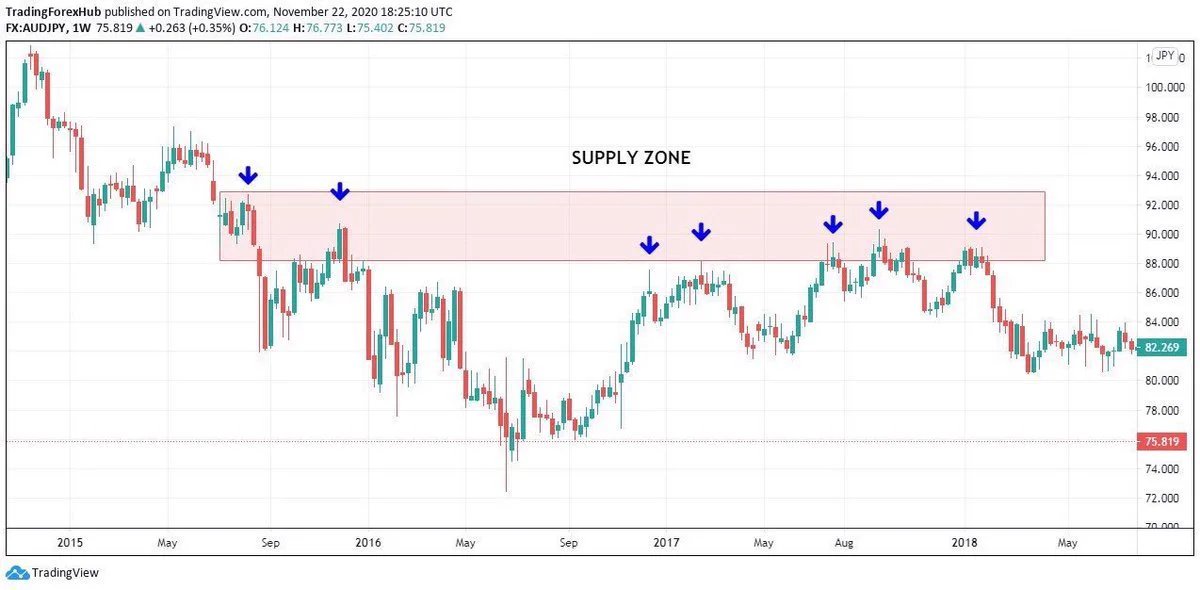
Supply Zones: 📚
Supply zones are critical levels where selling intensifies due to a surplus of sell orders
This imbalance between supply and demand creates downward pressure on the price, potentially leading to reversals or declines
Example:
Supply zones are critical levels where selling intensifies due to a surplus of sell orders
This imbalance between supply and demand creates downward pressure on the price, potentially leading to reversals or declines
Example:
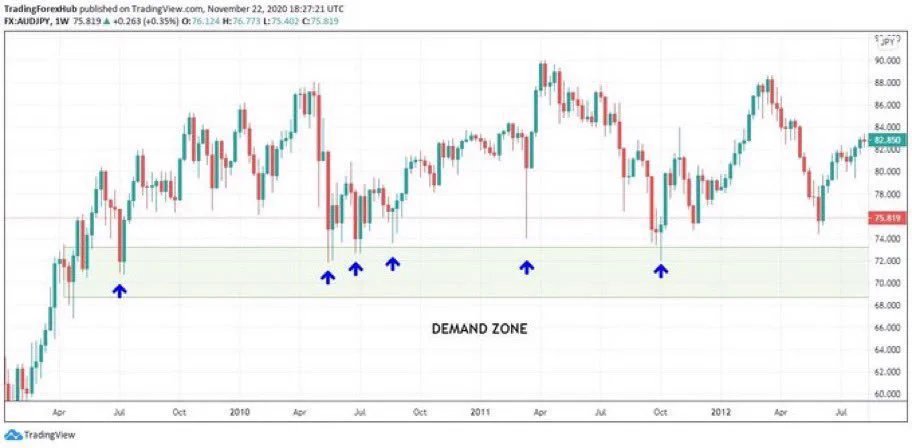
Demand Zones: 📚
In simple terms, a demand zone is a price range where traders prefer to buy. It's located below the current price and indicates high buying interest
Demand Zones attract buyers due to the presence of numerous buying orders at that level
Example:
In simple terms, a demand zone is a price range where traders prefer to buy. It's located below the current price and indicates high buying interest
Demand Zones attract buyers due to the presence of numerous buying orders at that level
Example:
Supply/Demand Dynamics: 📊
Supply represents the quantity of an instrument available for sale, while Demand signifies the quantity that buyers actively seek
Price determination hinges on these two forces:
📈 Excess Demand → Prices Rise
📉 Excess Supply → Prices Fall
Supply represents the quantity of an instrument available for sale, while Demand signifies the quantity that buyers actively seek
Price determination hinges on these two forces:
📈 Excess Demand → Prices Rise
📉 Excess Supply → Prices Fall
To execute trades effectively using Supply/Demand, watch for price action near these zones📉📈
If the price reaches Supply, it may be an opportunity to sell or consider short positions
If the price hits a Demand, it could be a signal to buy or consider long positions
If the price reaches Supply, it may be an opportunity to sell or consider short positions
If the price hits a Demand, it could be a signal to buy or consider long positions
Keep in mind that Supply/Demand dynamics are influenced by various factors, including market sentiment, economic indicators, and news events 🧐
Continuously analyzing and adapting to changing conditions will sharpen your trading skills and increase your chances of success ✅
Continuously analyzing and adapting to changing conditions will sharpen your trading skills and increase your chances of success ✅
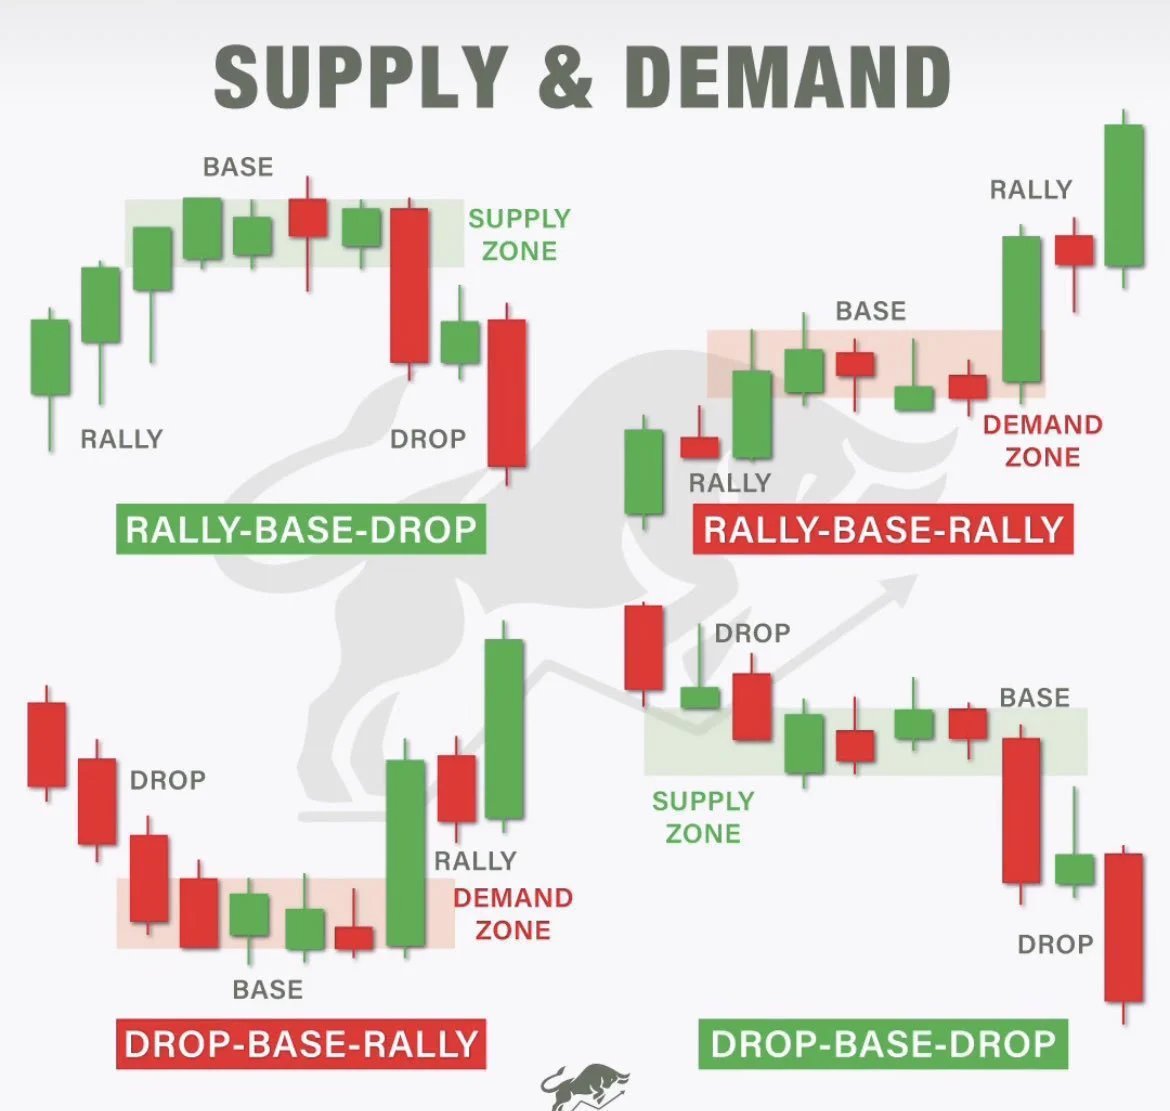
🚨 Successful traders understand that drawing Supply/Demand Zones isn't a one size fits all:
- Rally-Base-Drop
- Rally-Base-Rally
- Drop-Base-Rally
- Drop-Base-Drop
Here's a CHEAT Sheet featuring FOUR essential charting techniques to draw your Zones 👇
- Rally-Base-Drop
- Rally-Base-Rally
- Drop-Base-Rally
- Drop-Base-Drop
Here's a CHEAT Sheet featuring FOUR essential charting techniques to draw your Zones 👇
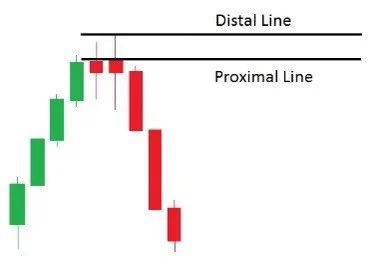
Trading is all about lessening your risk, this is why I use the low-risk method to draw my zones ✍️
TF: 15/30 min
When drawing Supply I use the top of body/upper wick and for Demand, I use the bottom of body/lower wick
If you want less risk, draw your Zones like this👇
TF: 15/30 min
When drawing Supply I use the top of body/upper wick and for Demand, I use the bottom of body/lower wick
If you want less risk, draw your Zones like this👇
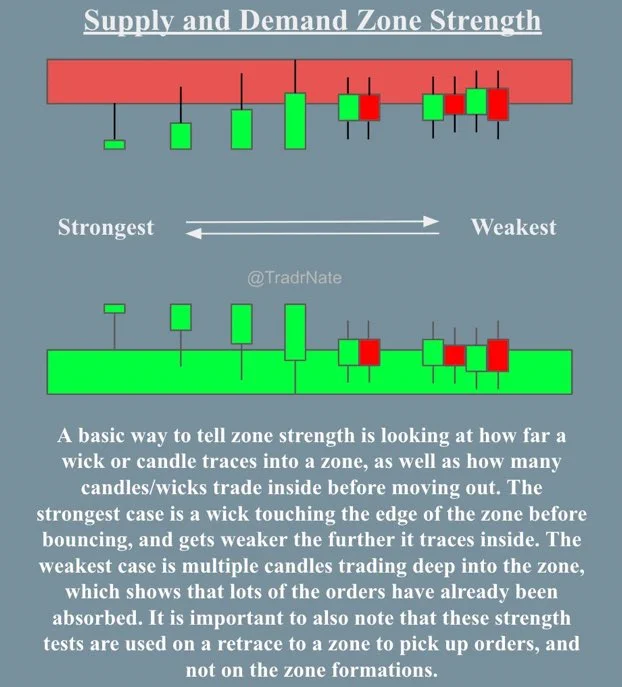
What methods can be used to gauge the strength of a S/D Zone? 👇
@TradrNate shared an excellent visual representation of supply and demand zone strength ✅
@TradrNate shared an excellent visual representation of supply and demand zone strength ✅
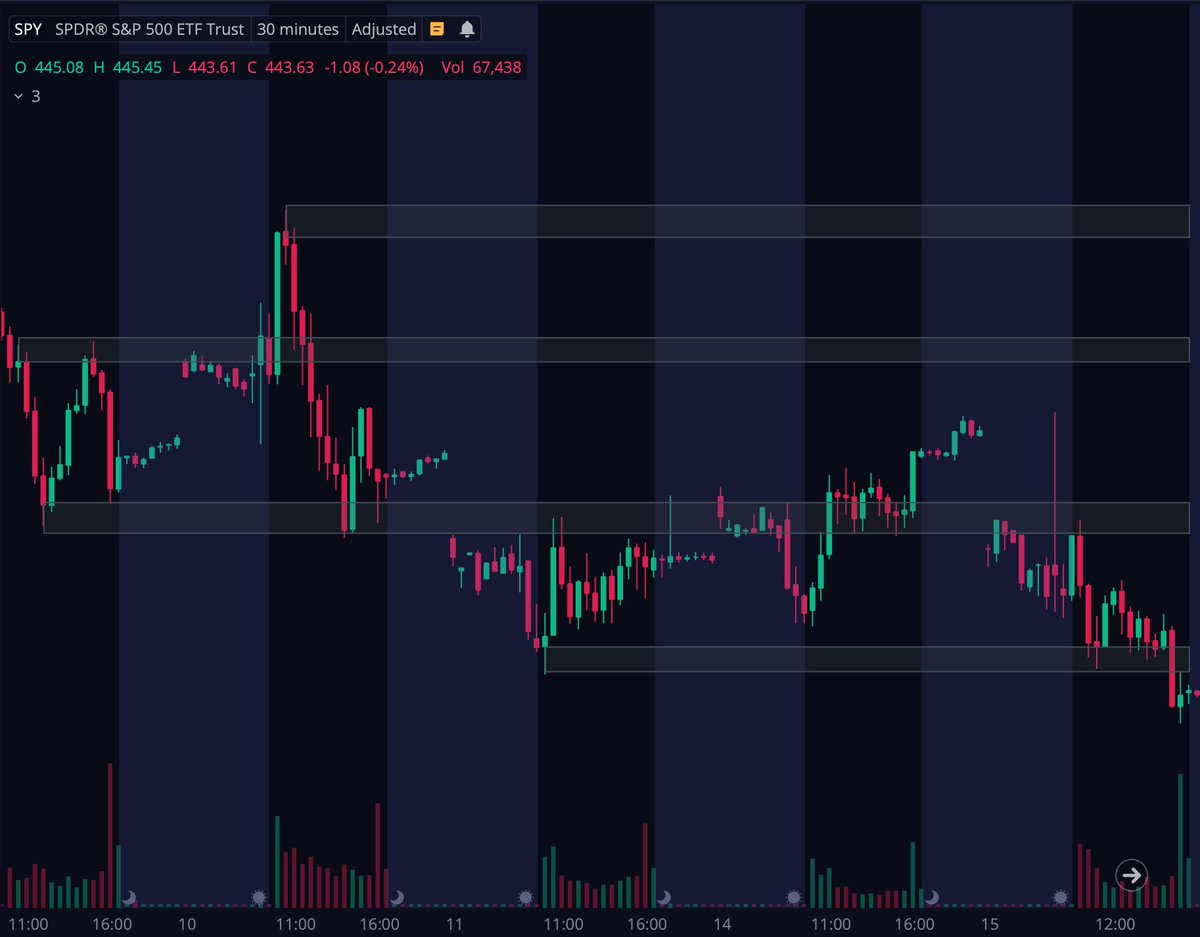
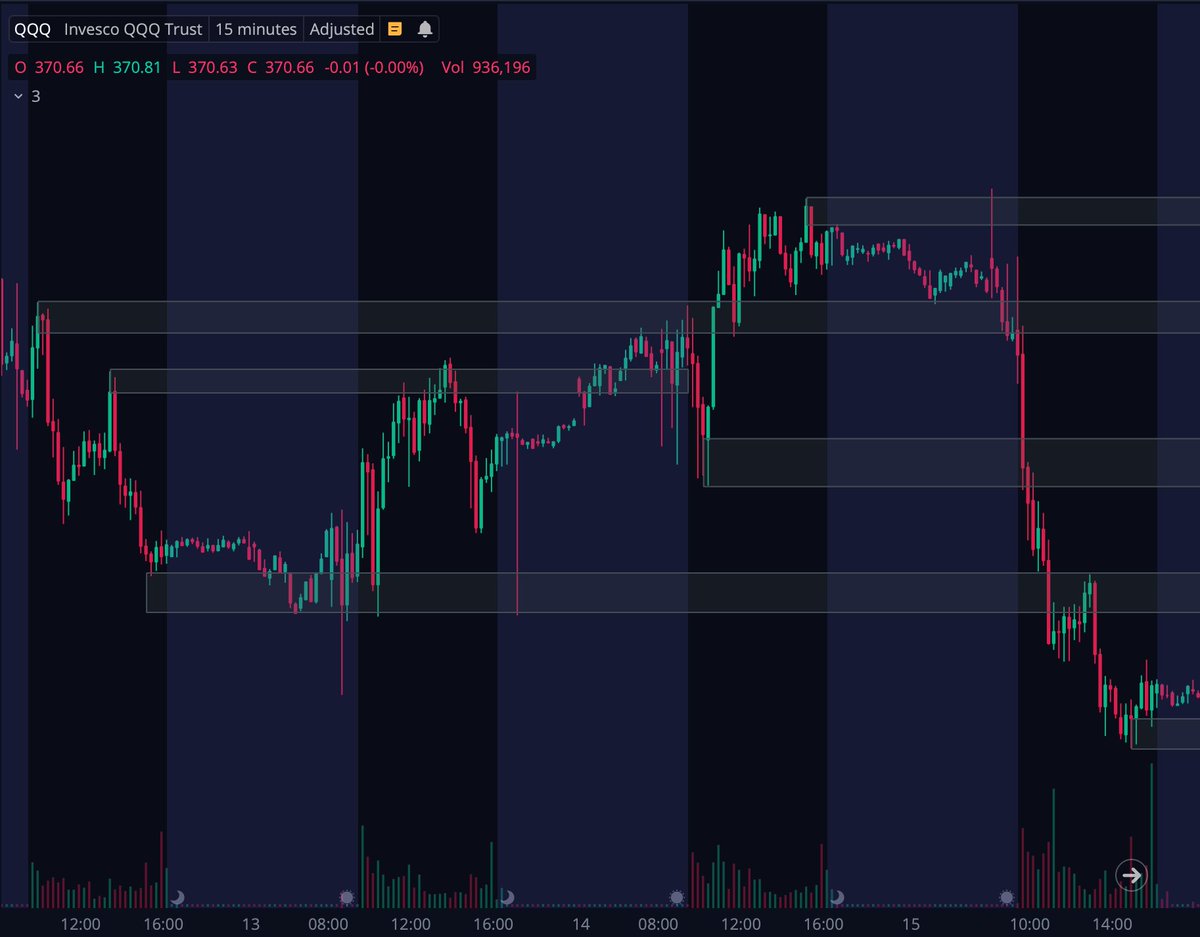
When trading I use FRESH Zones (Liquidity), I look at the past week & draw zones using the previous day's highs/lows to determine the areas I want to watch over the upcoming week 📝
These zones are great for day trading, as you can determine which way price will go 👇
Ex: $SPY
These zones are great for day trading, as you can determine which way price will go 👇
Ex: $SPY
Look at the past two weeks, prioritize fresh Supply/Demand zones for peak trading performance!
✔️ Fresh zones mean high liquidity, smoother execution, reduced clutter, & higher probability setups
Markets evolve, & fresh zones adapt, ensuring you stay on top of current sentiment
✔️ Fresh zones mean high liquidity, smoother execution, reduced clutter, & higher probability setups
Markets evolve, & fresh zones adapt, ensuring you stay on top of current sentiment
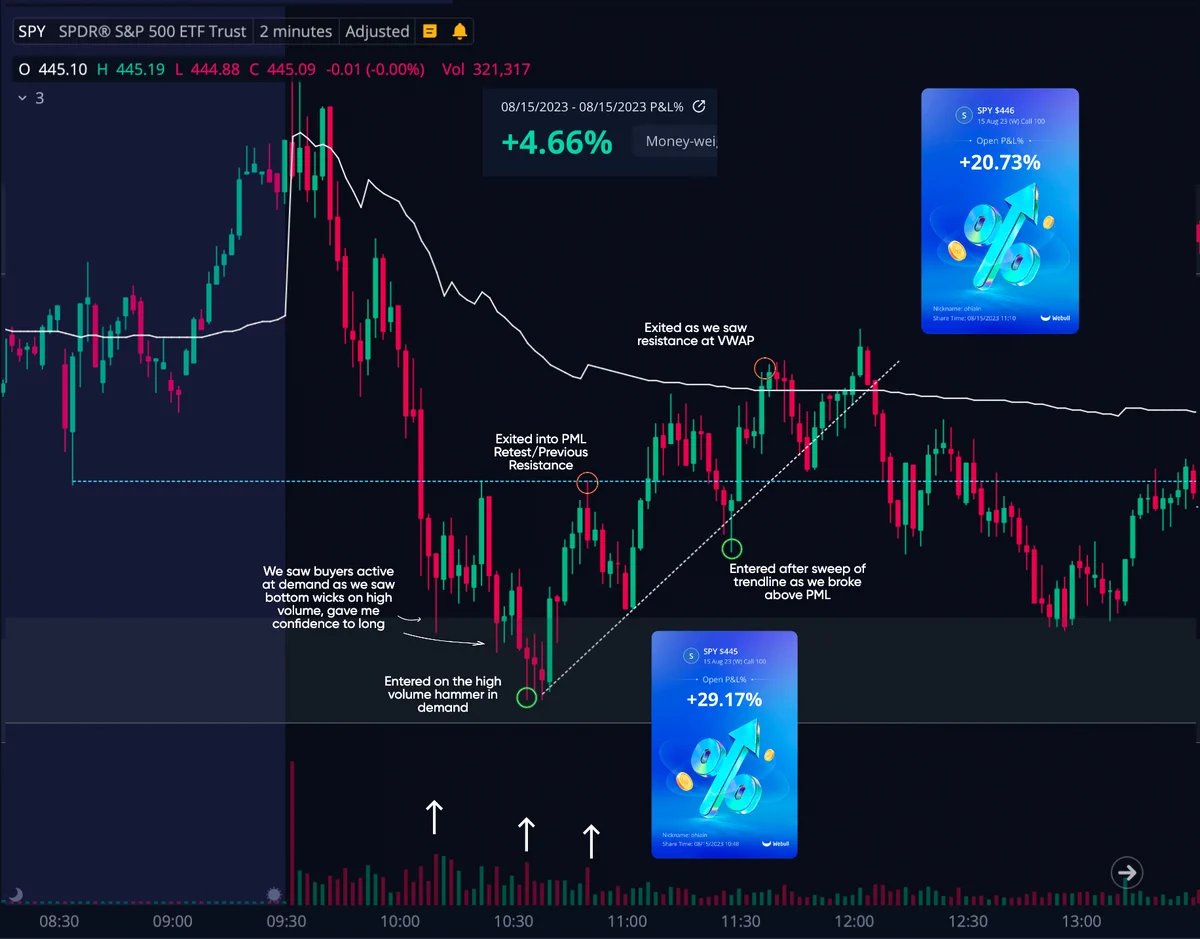
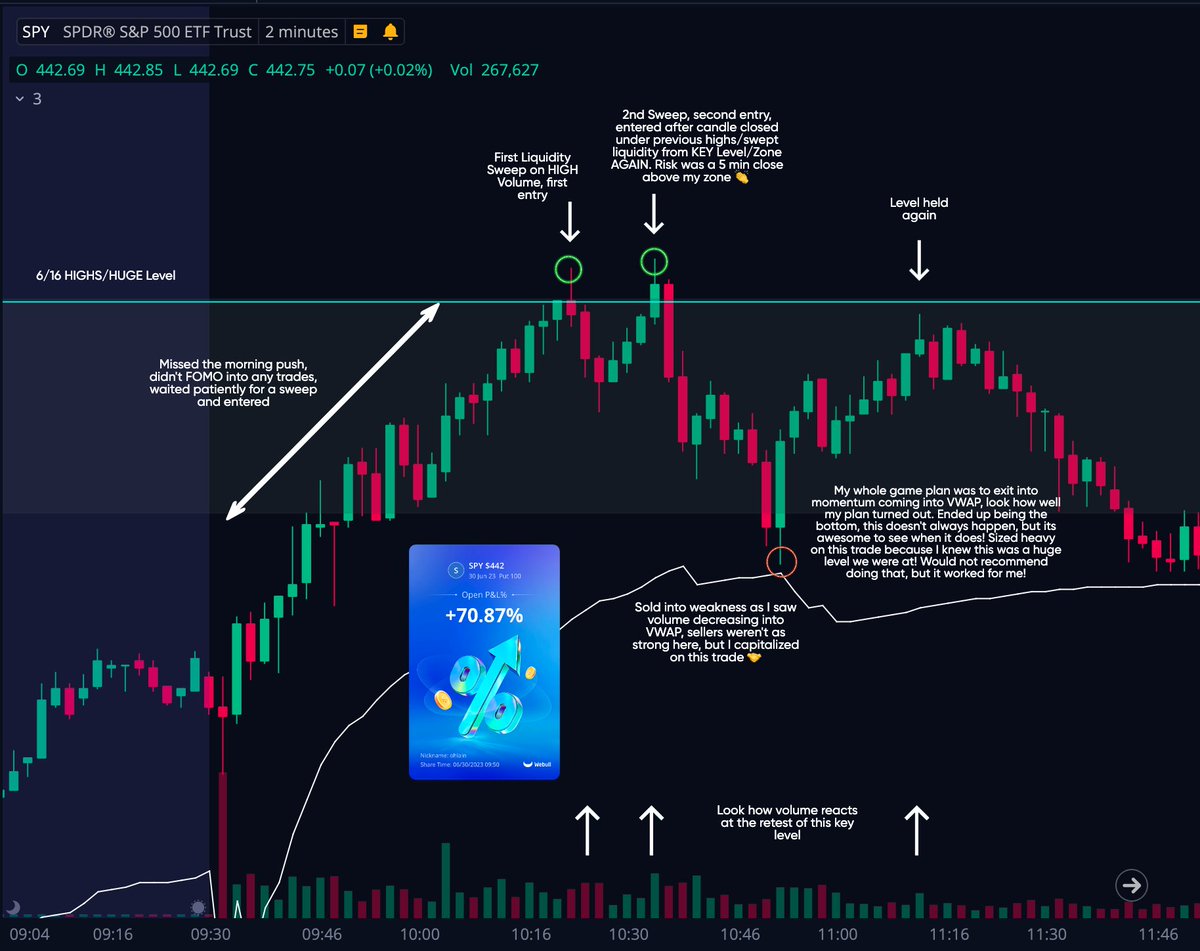
It's fairly simple if we break above/below these zones, I wait for a pullback and use VOLUME to gauge if buyers or sellers are active still
📈 Break Above = long/continuation
📉 Break Below = short/continuation
If we stay in the zone, I sit on my hands protecting my capital 👇
📈 Break Above = long/continuation
📉 Break Below = short/continuation
If we stay in the zone, I sit on my hands protecting my capital 👇
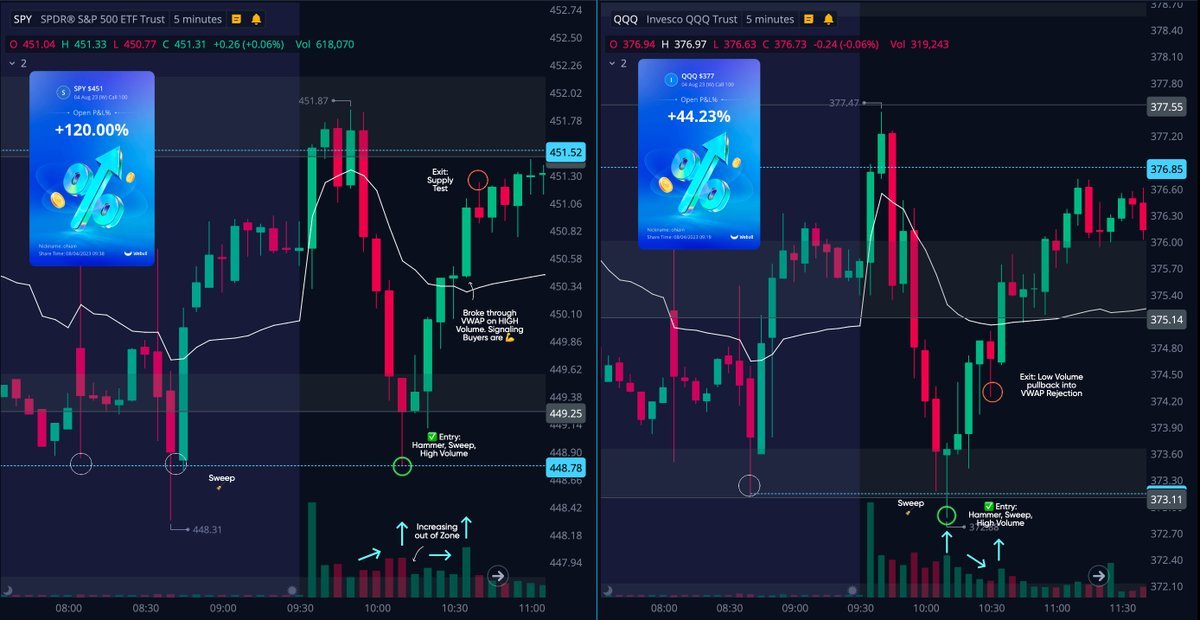
Let's look at how these Zones played out on $SPY and $QQQ this week 🔍
We can see how effective these zones can be if you understand the concepts behind how to draw and identify these zones of interest! 🙌
We can see how effective these zones can be if you understand the concepts behind how to draw and identify these zones of interest! 🙌
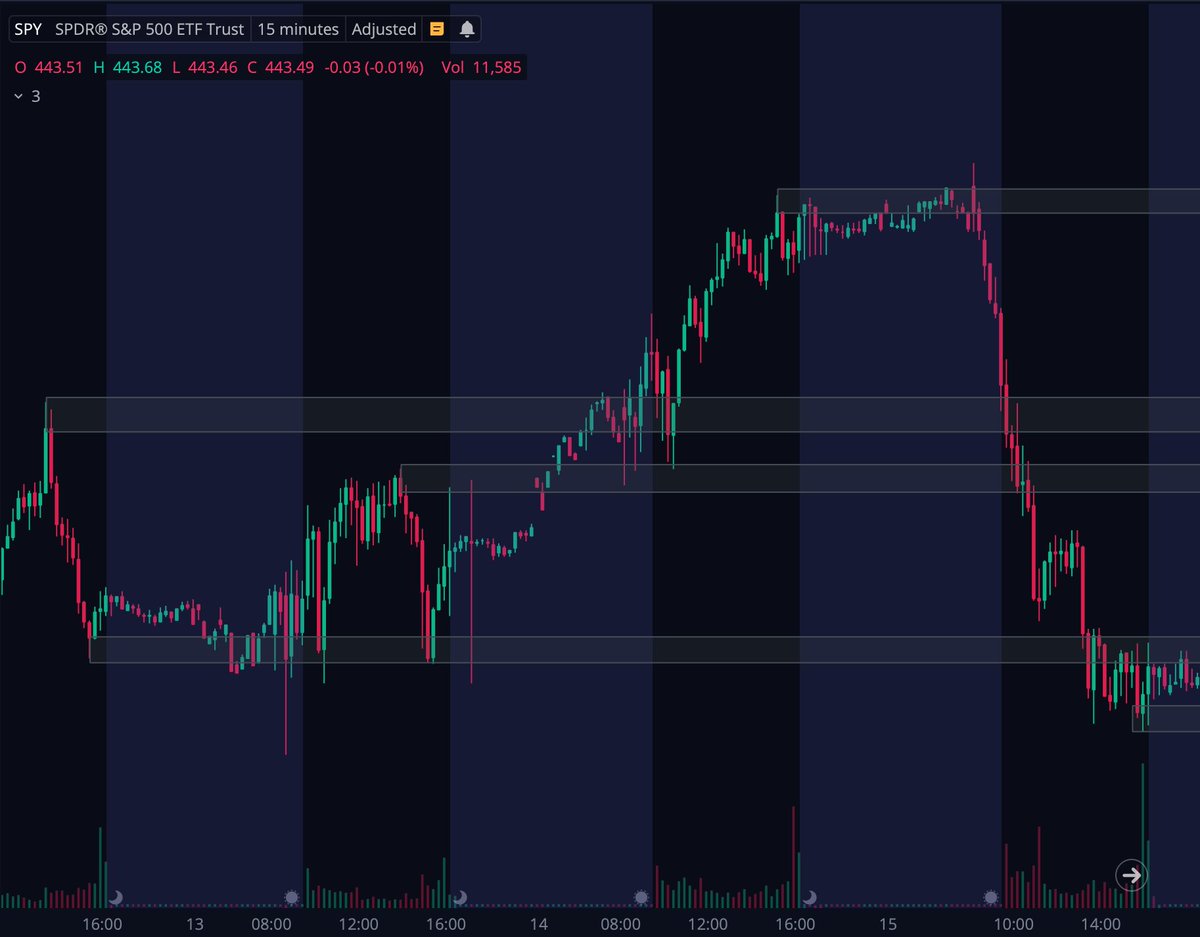
These are a few trading examples of how I have used these zones in the past!
Although there is more that goes into my entries and exits, these zones play a huge role with trading tickers such as $SPY $QQQ and $IWM 🙌
Although there is more that goes into my entries and exits, these zones play a huge role with trading tickers such as $SPY $QQQ and $IWM 🙌
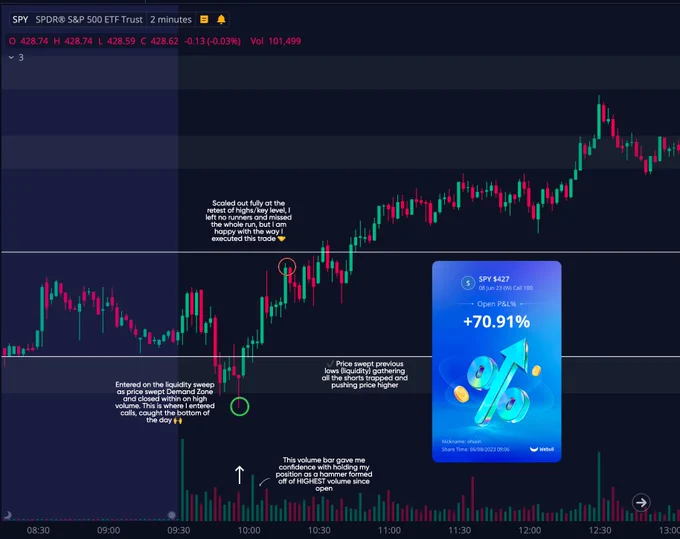

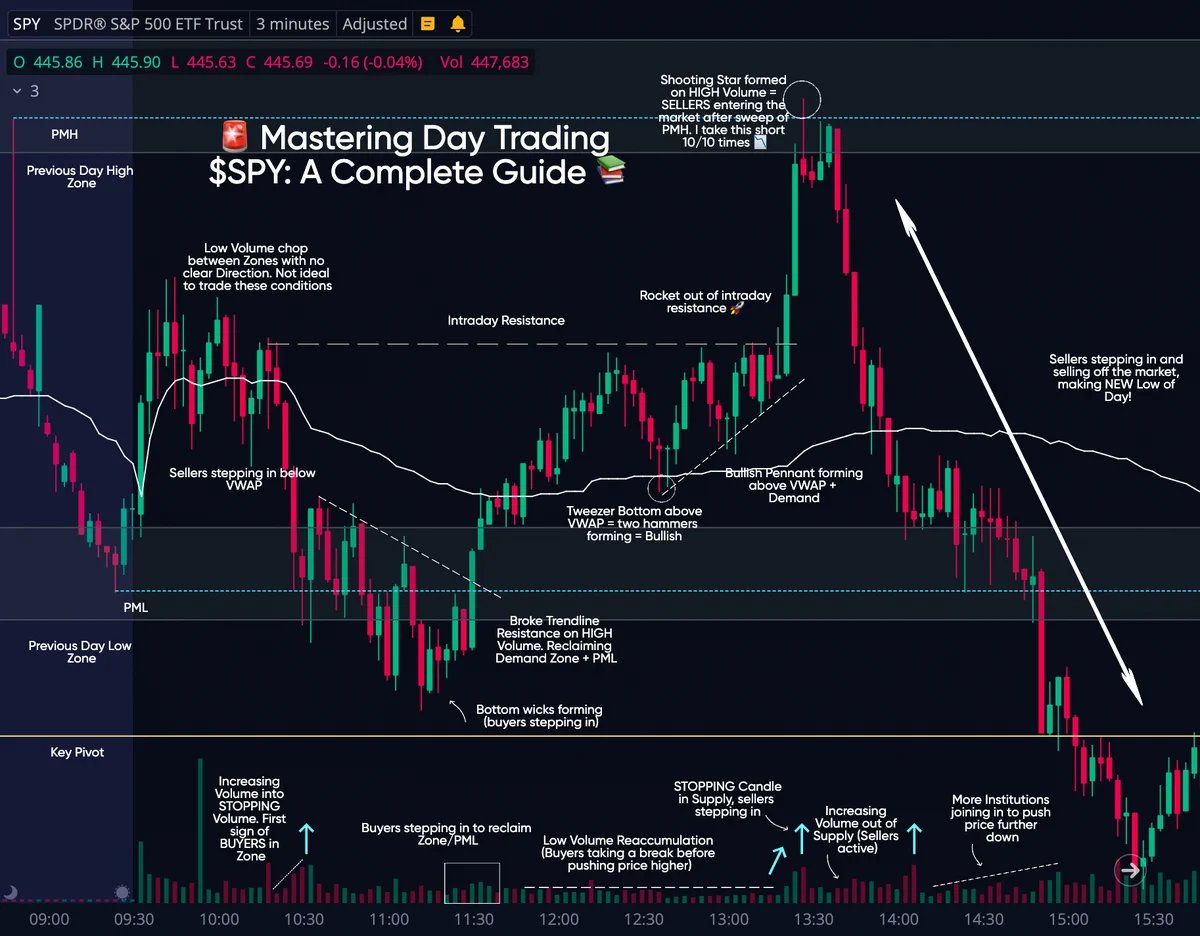
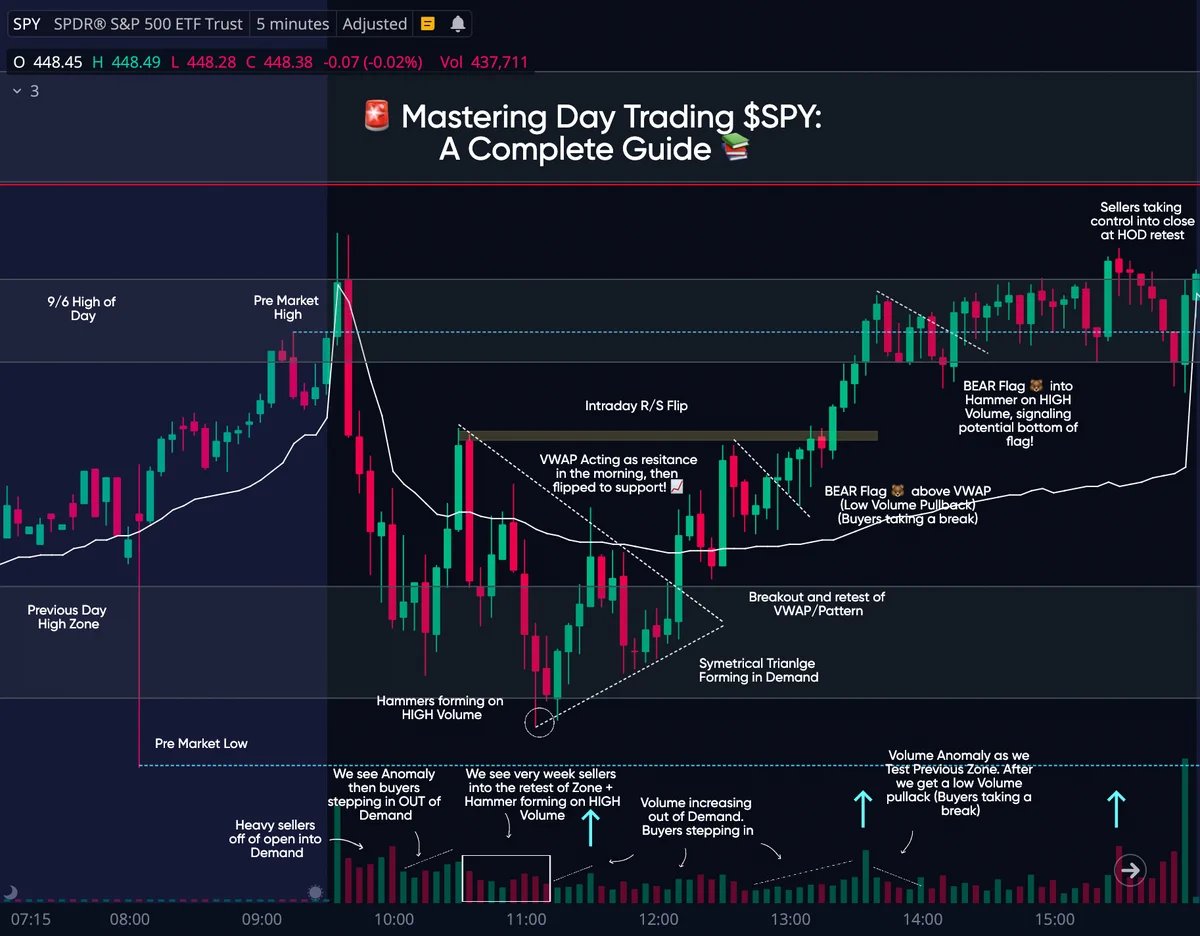
Below I have attached my comprehensive annotations on how I trade $SPY using these Zones from the past week!
I hope you find value in my approach to trading #VPA 👇
I hope you find value in my approach to trading #VPA 👇

Remember, the choice of which technique to use depends on market context, trend analysis, and your overall trading strategy!
These techniques are tools in your trading arsenal, providing valuable guidance for identifying optimal entry and exit points 🎯
These techniques are tools in your trading arsenal, providing valuable guidance for identifying optimal entry and exit points 🎯
Mastering the art of drawing Supply/Demand Zones requires practice, pattern recognition, and an understanding of market psychology 🧠
By incorporating these techniques into your trading strategy, you can increase your probability of making better trading decisions 👇
By incorporating these techniques into your trading strategy, you can increase your probability of making better trading decisions 👇
If you found value, consider sharing to extend its reach and help assist others 🙌
I invest considerable effort in simplifying these ideas, and your support is a driving force, inspiring me to continue to deliver educational content!
I appreciate each and every one of you 🙏
I invest considerable effort in simplifying these ideas, and your support is a driving force, inspiring me to continue to deliver educational content!
I appreciate each and every one of you 🙏
That's a wrap!
📚 This was a simple thread going over how I trade the indices using simple S/D concepts 📊
I hope this thread helped someone, RT or like if useful, it is much appreciated 😎
Follow for more FREE educational posts and please don't hesitate to ask questions! 🙌
📚 This was a simple thread going over how I trade the indices using simple S/D concepts 📊
I hope this thread helped someone, RT or like if useful, it is much appreciated 😎
Follow for more FREE educational posts and please don't hesitate to ask questions! 🙌
As always, to end this thread, I will leave you with a few follow suggestions:
@DBookTrading: Volume
@fabiansoss: Volume
@notmrmanziel: Edu
@Jake__Wujastyk: Edu
@Strat_Trades: Edu
@cs_tradess: Edu
@Braczyy: Edu
@TSDR_Trading: Edu
@SpencerParsons0: Charts
LMK if I missed any!
@DBookTrading: Volume
@fabiansoss: Volume
@notmrmanziel: Edu
@Jake__Wujastyk: Edu
@Strat_Trades: Edu
@cs_tradess: Edu
@Braczyy: Edu
@TSDR_Trading: Edu
@SpencerParsons0: Charts
LMK if I missed any!
جاري تحميل الاقتراحات...