

Reading the Market with Volume Profiles: A Beginner's Guide 📚
What is a Volume Profile?: 🧵⬇️
$SPY
What is a Volume Profile?: 🧵⬇️
$SPY

Volume Profiles are an essential tool for traders seeking to identify key support and potential price acceleration zones 📊
In this thread 🧵, I'll explain what they are and how you can use them effectively 👇
In this thread 🧵, I'll explain what they are and how you can use them effectively 👇
Basics: What is it? 💭
📊 Volume profiles are a powerful tool that traders can use to analyze the trading activity of a stock
Volume Profiles provide a visual representation of the amount of trading activity that has occurred at each price level over a given time period
📊 Volume profiles are a powerful tool that traders can use to analyze the trading activity of a stock
Volume Profiles provide a visual representation of the amount of trading activity that has occurred at each price level over a given time period
Volume Profiles Uses: ✅
✔️ Identify Key Support and Resistance Levels for Setups
✔️ Determine Logical Take Profits and Stop Losses
✔️ Identify Balanced vs. Imbalanced Markets
✔️ Determine the Strength of Trends
Volume Profile's are great to use on ALL time frames!
✔️ Identify Key Support and Resistance Levels for Setups
✔️ Determine Logical Take Profits and Stop Losses
✔️ Identify Balanced vs. Imbalanced Markets
✔️ Determine the Strength of Trends
Volume Profile's are great to use on ALL time frames!
1) A 'launchpad' effect can occur when a potential technical breakout surpasses a significant resistance level on a shelf with a substantial trading volume, causing an upward price movement 📈
Volume Profiles can act as key S/R Levels
📉 Supply = Resistance
📈 Demand = Support
Volume Profiles can act as key S/R Levels
📉 Supply = Resistance
📈 Demand = Support

1) Continued...
Let's start with support/resistance levels:
When you see a sharp spike in volume at a particular price level, it indicates strong buying/selling interest
This can act as a s/r zone, as buyers/sellers are likely to step in again if the price revisits that level
Let's start with support/resistance levels:
When you see a sharp spike in volume at a particular price level, it indicates strong buying/selling interest
This can act as a s/r zone, as buyers/sellers are likely to step in again if the price revisits that level
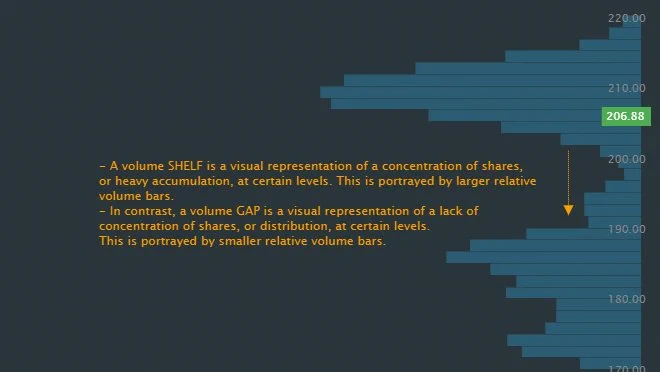
2) A Volume Gap represents an area where there is a significant contrast in trading volume between two price levels
They usually occur when there is a sudden change in supply & demand balance, resulting in a shift in price action
📍 Gaps = price-vulnerable areas/moves fast
They usually occur when there is a sudden change in supply & demand balance, resulting in a shift in price action
📍 Gaps = price-vulnerable areas/moves fast
2) Continued...
Let's talk about price acceleration zones:
When there's a low-volume area between two volume peaks, it's often referred to as a "low-volume node."
Price can move rapidly through these zones as there's less trading activity to act as resistance
Let's talk about price acceleration zones:
When there's a low-volume area between two volume peaks, it's often referred to as a "low-volume node."
Price can move rapidly through these zones as there's less trading activity to act as resistance
Volume Gap ⬇️ Resistance:
Implies a lack of selling interest, traders may interpret this as a bullish signal, suggesting potential price inclines
We can see the price cut smoothly like butter from shelf to shelf (Volume Gaps) 👇
Implies a lack of selling interest, traders may interpret this as a bullish signal, suggesting potential price inclines
We can see the price cut smoothly like butter from shelf to shelf (Volume Gaps) 👇
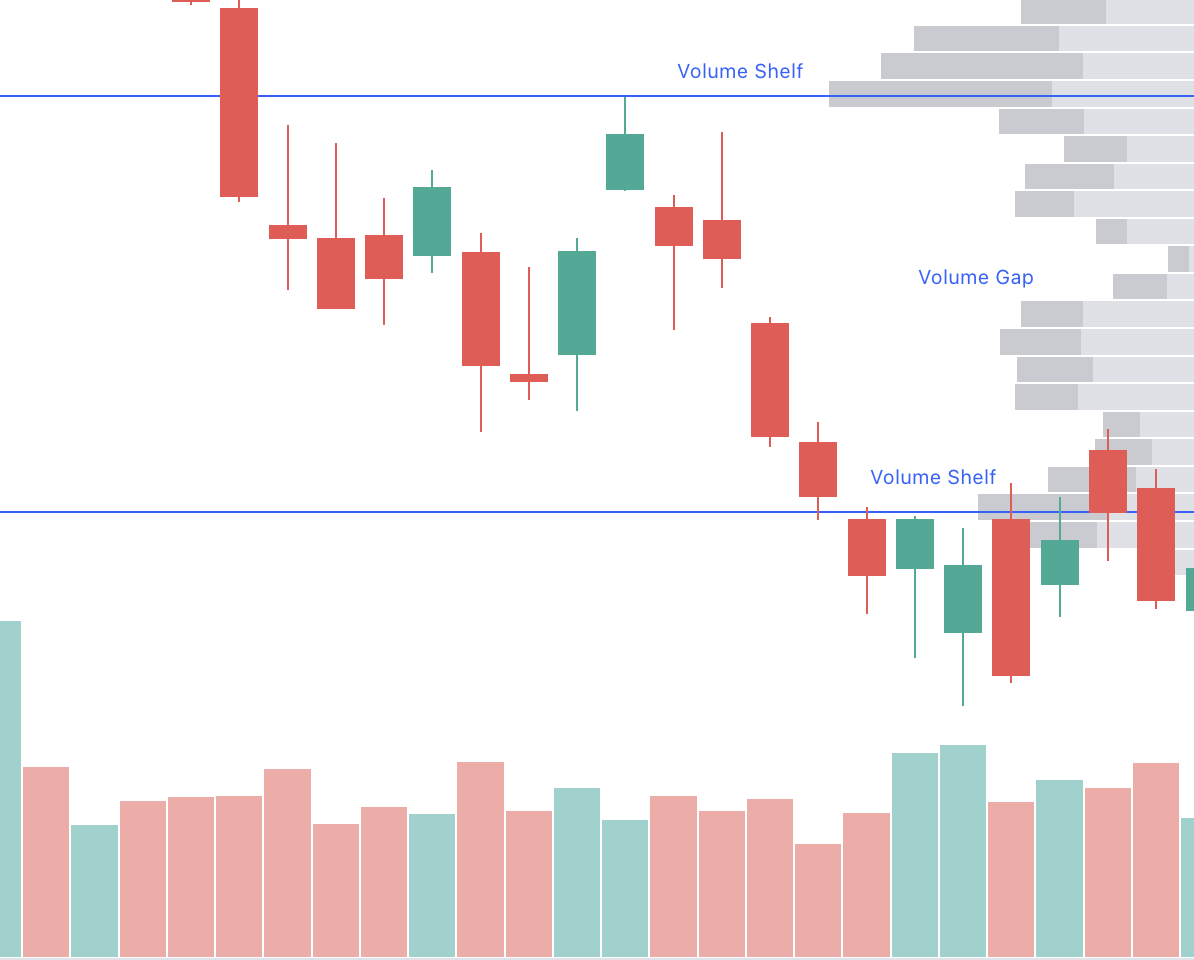
Volume Gap ⬇️ Support:
Implies a lack of buying interest, traders may interpret this as a bearish signal, suggesting potential price declines
We can see the price cut smoothly like butter from shelf to shelf (Volume Gaps) 👇
Implies a lack of buying interest, traders may interpret this as a bearish signal, suggesting potential price declines
We can see the price cut smoothly like butter from shelf to shelf (Volume Gaps) 👇
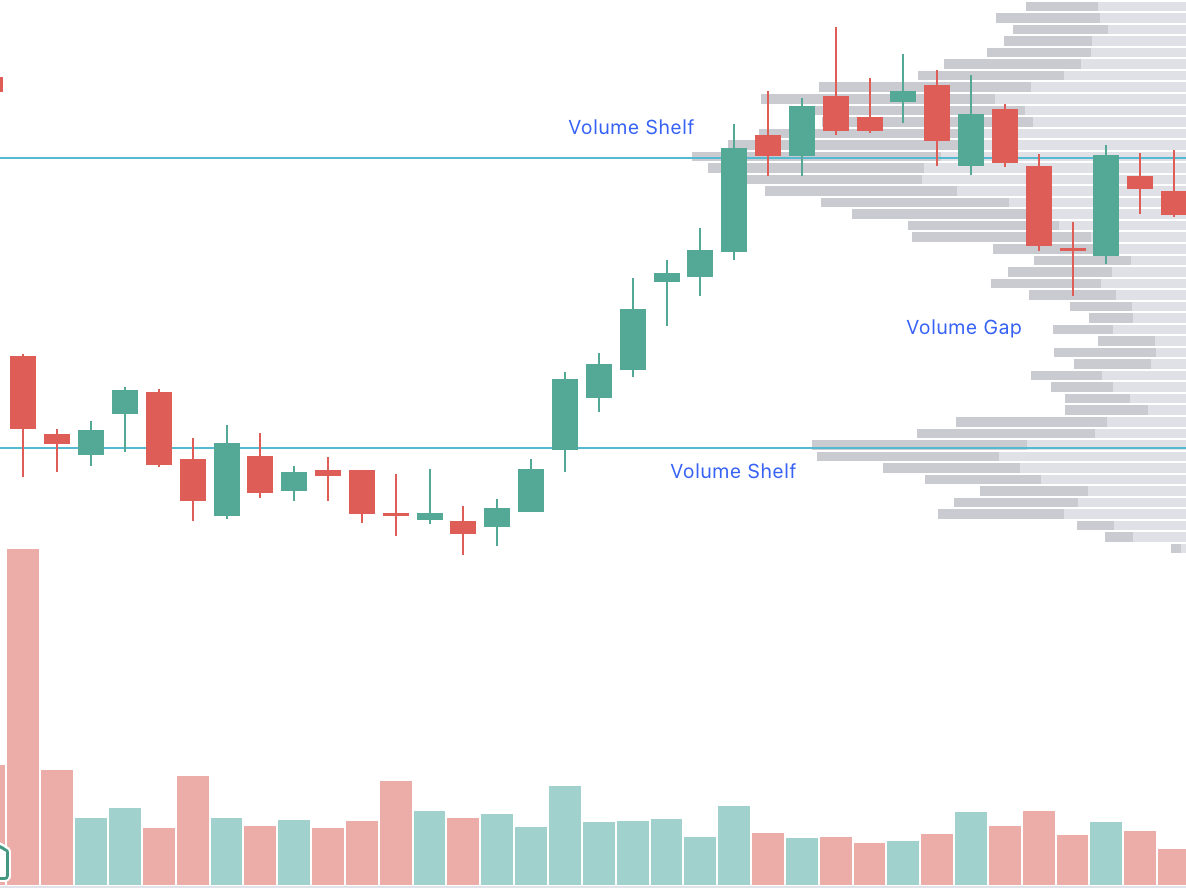
If price is in between Volume Shelves (Gaps) we see price cut smoothly to the next level
Personally, I like to use VP levels to gauge whether price could move fast or chop in between my levels
Look how price reacts to Large Volume Shelfs & Volume Gaps: ⬇️
Personally, I like to use VP levels to gauge whether price could move fast or chop in between my levels
Look how price reacts to Large Volume Shelfs & Volume Gaps: ⬇️

Combining volume profiles with other technical indicators can enhance your trading decisions
Look for confluence with support/resistance levels, trendlines, and candlestick patterns for more accurate entries and exits 🙌
Look for confluence with support/resistance levels, trendlines, and candlestick patterns for more accurate entries and exits 🙌
Volume Profiles are a powerful tool to identify support levels & price acceleration zones
By understanding where traders are most active, you can make more informed trading decisions
Remember, volume profiles are not foolproof
They are just one tool in your trading arsenal 🛡️
By understanding where traders are most active, you can make more informed trading decisions
Remember, volume profiles are not foolproof
They are just one tool in your trading arsenal 🛡️
This 🧵 was very basic, if the people want a more in-depth thread on how I use it day to day within my own system comment down below 👇
That's a wrap!
Volume Profiles should be used as confluence, not to directly trade-off of!
I hope this simple thread helped someone, RT or like if useful, it is much appreciated 😎
Follow for more FREE educational posts and please don't hesitate to ask questions! 🙌
Volume Profiles should be used as confluence, not to directly trade-off of!
I hope this simple thread helped someone, RT or like if useful, it is much appreciated 😎
Follow for more FREE educational posts and please don't hesitate to ask questions! 🙌
As always, to end this thread, I will leave you with a few follow suggestions: ✔️
@DBookTrading: Volume
@ThiccTeddy: Volume
@fabiansoss: Volume
@notmrmanziel: Edu
@StratonOak: Edu
@RockyBTrades: Edu
@Braczyy: Edu
@TSDR_Trading: Edu
@SpencerParsons0: Edu
LMK if I missed any!
@DBookTrading: Volume
@ThiccTeddy: Volume
@fabiansoss: Volume
@notmrmanziel: Edu
@StratonOak: Edu
@RockyBTrades: Edu
@Braczyy: Edu
@TSDR_Trading: Edu
@SpencerParsons0: Edu
LMK if I missed any!
Loading suggestions...