


What is FR?
FR levels are lines indicating potential support and resistance on price charts
They are derived from Fibonacci ratios: 23.6%, 38.2%, 61.8%, and 78.6%
FR levels are lines indicating potential support and resistance on price charts
They are derived from Fibonacci ratios: 23.6%, 38.2%, 61.8%, and 78.6%

Why Does it work?
FR works due to traders' collective actions on these levels, reflecting natural human behaviors and patterns seen in nature.
It's commonly used, so markets often react as expected.
FR works due to traders' collective actions on these levels, reflecting natural human behaviors and patterns seen in nature.
It's commonly used, so markets often react as expected.
When to use
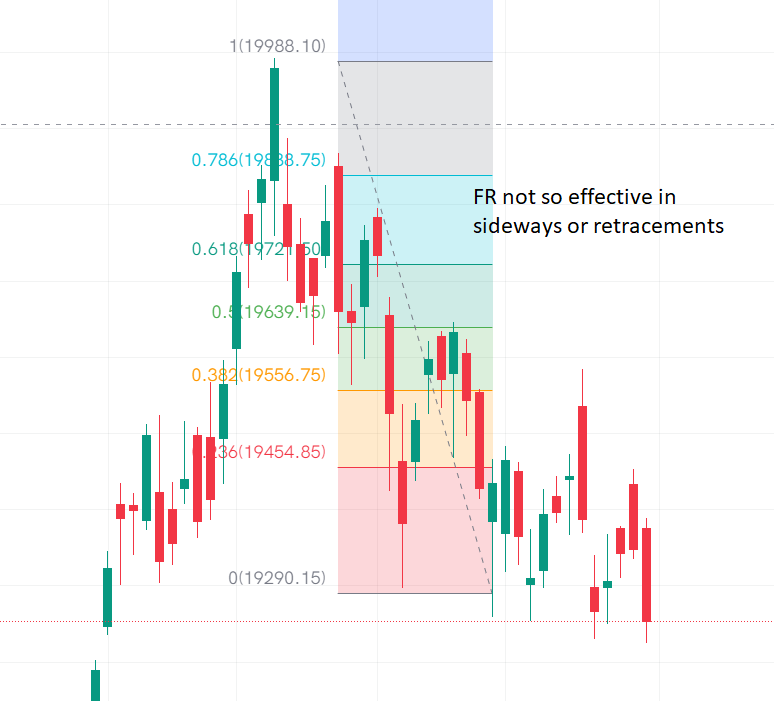
FR levels work well in trending markets.
Not in ranges, consolidations, corrections, and sideways movements.
It is bcoz in sideways markets prices respond more to tops & bottoms than to Fib ratios.
FR levels work well in trending markets.
Not in ranges, consolidations, corrections, and sideways movements.
It is bcoz in sideways markets prices respond more to tops & bottoms than to Fib ratios.
How to draw levels:
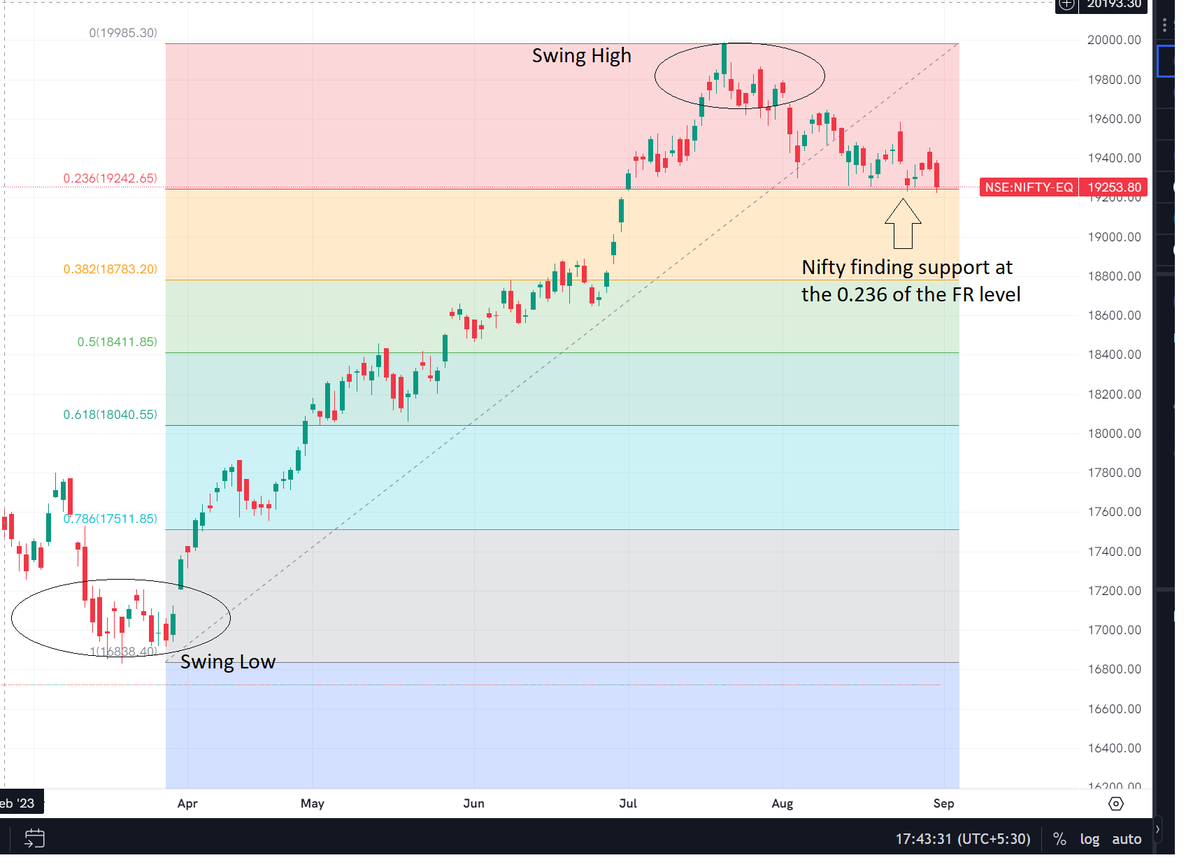
Identify key swing high & low. Use chart's Fib tool.
Drag from low to high (uptrend) or vice versa.
You can clearly see the 0.236 FR level supporting Nifty at 19250.
Identify key swing high & low. Use chart's Fib tool.
Drag from low to high (uptrend) or vice versa.
You can clearly see the 0.236 FR level supporting Nifty at 19250.
Entry
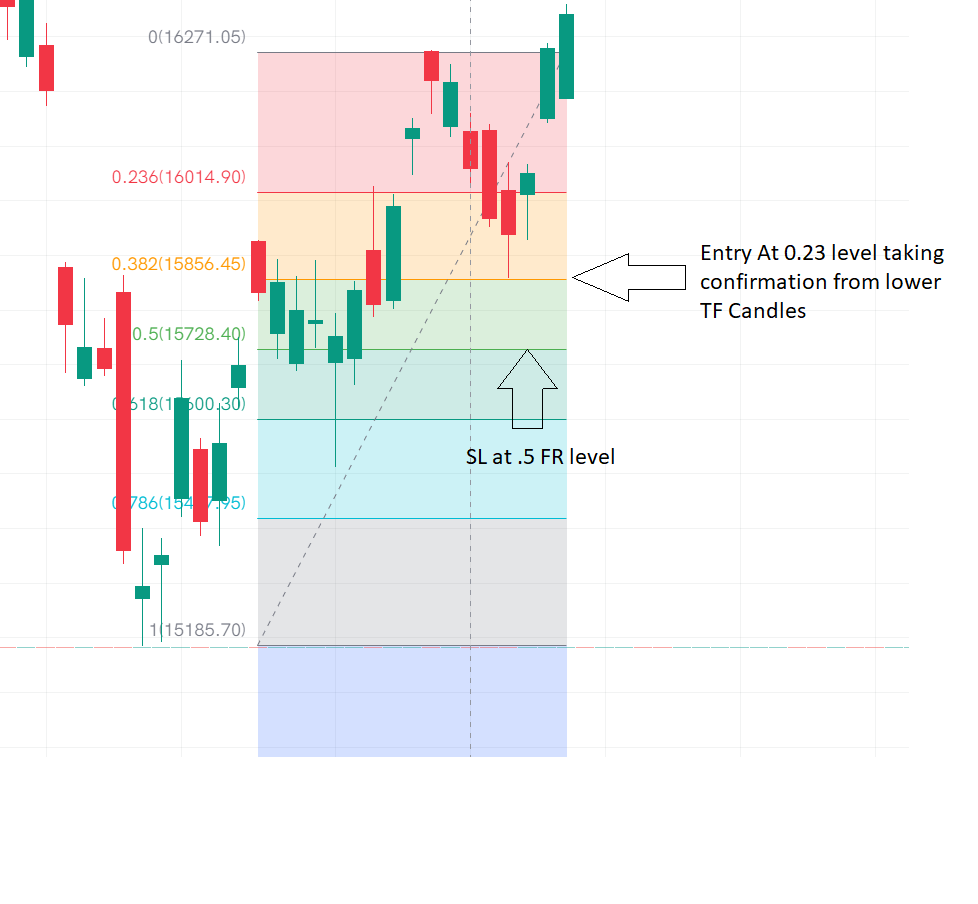
Enter near a Fib level (buy near support in uptrend, sell near resistance in downtrend).
Stop-loss can be the next FR level.
Always ensure confluence with other indicators/signals. Risk management is crucial
Enter near a Fib level (buy near support in uptrend, sell near resistance in downtrend).
Stop-loss can be the next FR level.
Always ensure confluence with other indicators/signals. Risk management is crucial
Exit:
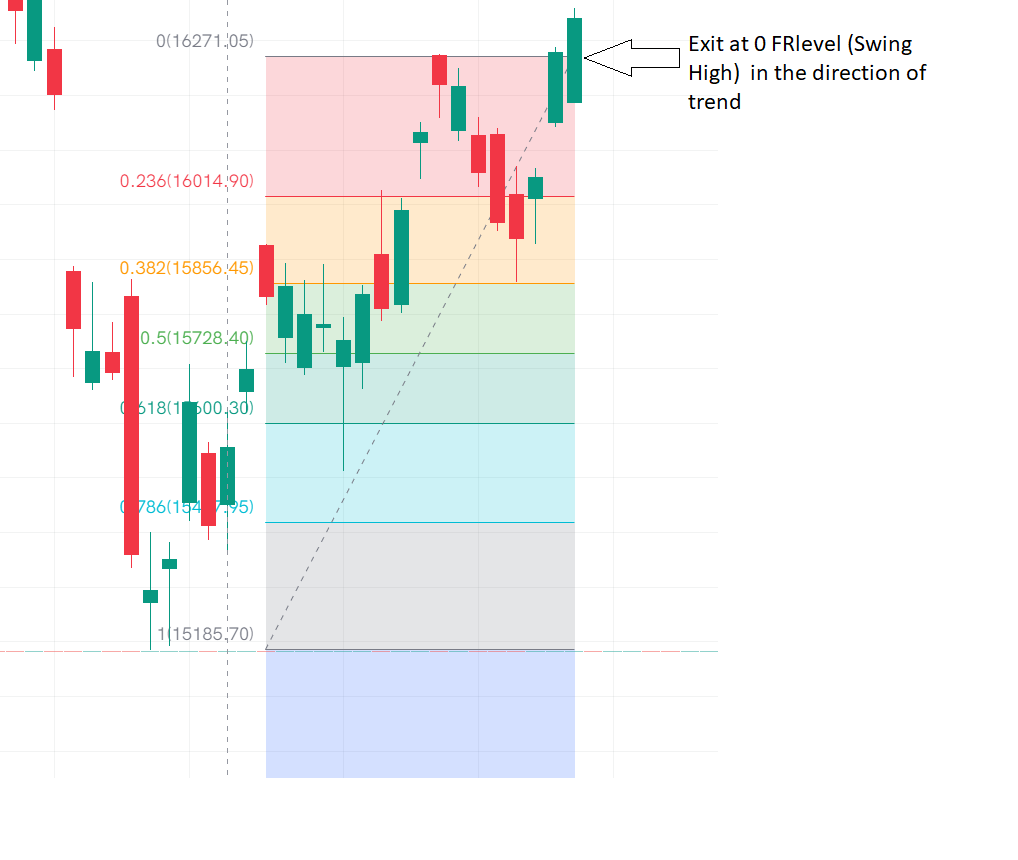
Exit should be swing high/low in the direction of trend.
For best results, this strategy should be used in trending market.
Exit should be swing high/low in the direction of trend.
For best results, this strategy should be used in trending market.
Please Follow @_AsthaTrade for more such content
please RT, Like and share the first tweet.
Comment below with your queries.
We will be happy to help.
please RT, Like and share the first tweet.
Comment below with your queries.
We will be happy to help.
جاري تحميل الاقتراحات...