

#RSI is the best tool to identify trend Reversal & Trend Weakness
This learning thread would be on
"MASTER THE RSI DIVERGENCE"
Like👍 & Retweet🔄 for wider reach and for more such thread
Intraday "RSI DIVERGENCE STRATEGY" With Chartink Screener
This learning thread would be on
"MASTER THE RSI DIVERGENCE"
Like👍 & Retweet🔄 for wider reach and for more such thread
Intraday "RSI DIVERGENCE STRATEGY" With Chartink Screener
What is RSI DIVERGENGE?
RSI divergence refers to a situation in technical analysis where there is a disagreement or mismatch between the price movements of a stock and the Relative Strength Index (RSI) indicator
RSI divergence refers to a situation in technical analysis where there is a disagreement or mismatch between the price movements of a stock and the Relative Strength Index (RSI) indicator
Types of Divergence:-
1. Bullish Divergence
2. Bearish Divergence
Divergence is used for Trend Weakness & Trend Reversal
1. Bullish Divergence
2. Bearish Divergence
Divergence is used for Trend Weakness & Trend Reversal
Bullish Divergence:
Condition-
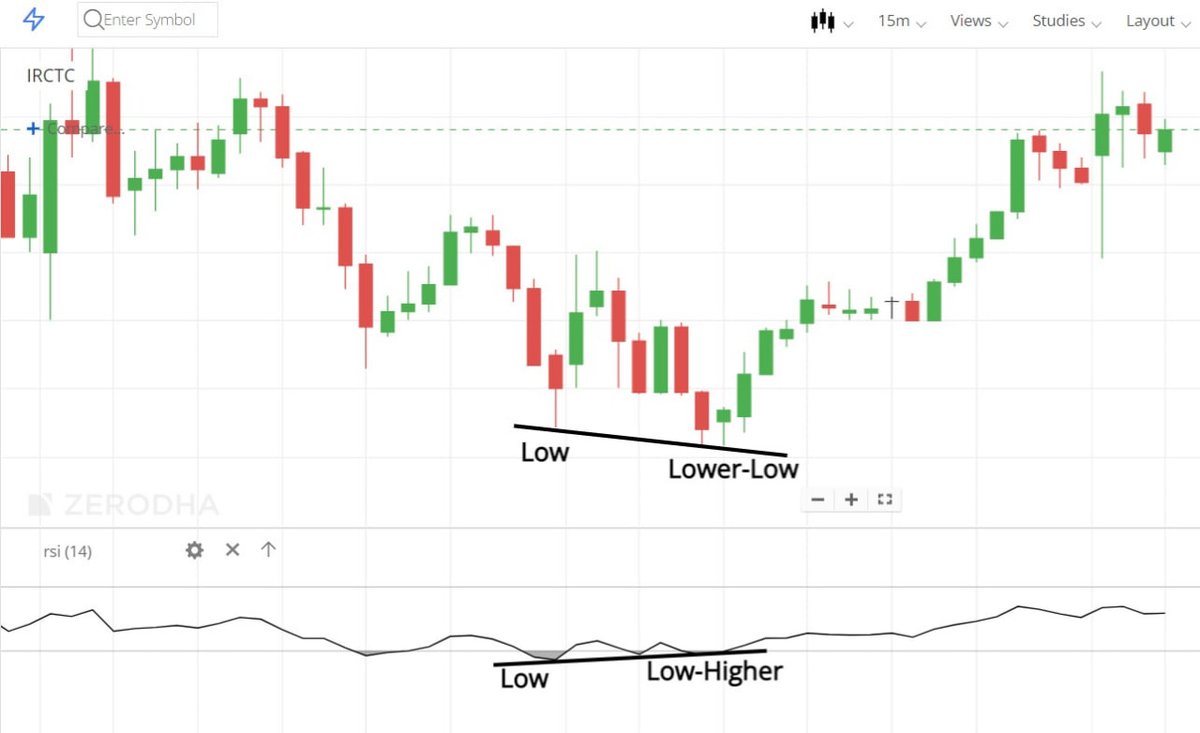
1. Price should form lower lows
2. RSI should form higher lows and is below 30
Bullish RSI Divergence:- chartink.com
Condition-
1. Price should form lower lows
2. RSI should form higher lows and is below 30
Bullish RSI Divergence:- chartink.com

IRCTC 15 MIN CHART:-
IRCTC makes a clean bullish divergence & give a good move with a good Risk & reward Ratio
Give clean 2% returns in just one Trading Session
IRCTC makes a clean bullish divergence & give a good move with a good Risk & reward Ratio
Give clean 2% returns in just one Trading Session
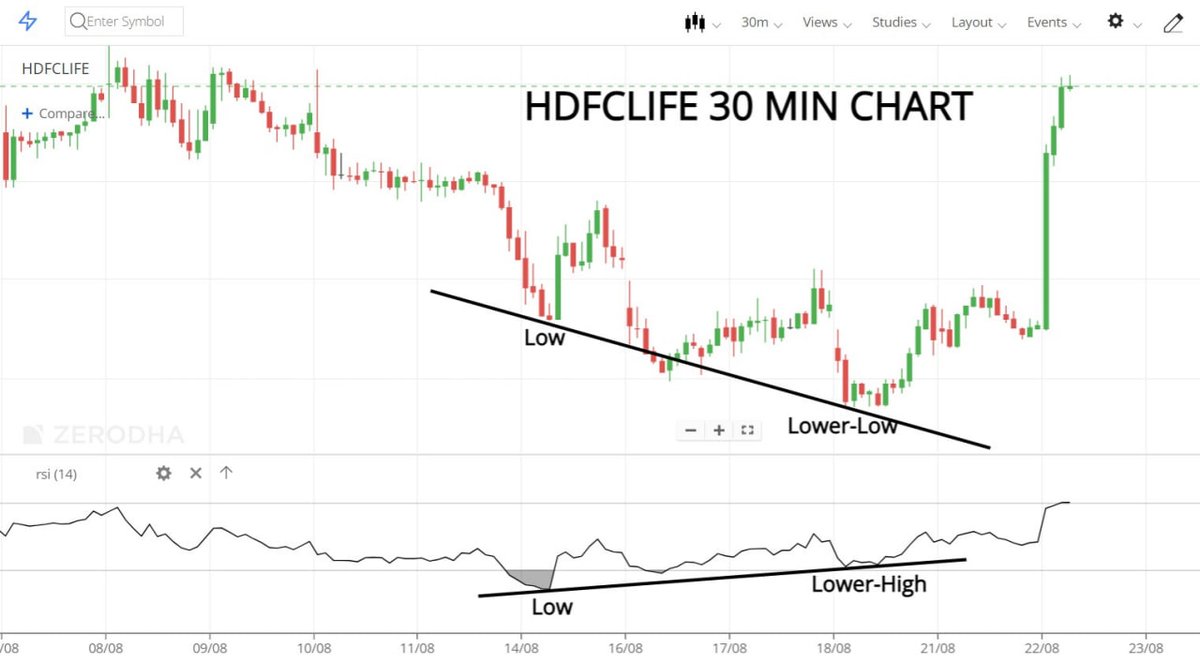
HDFC LIFE 30 MIN CHART:-
HDFCLIFE makes a clean bullish divergence & gives a good move with a good Risk & reward Ratio
Give clean 5% returns in just 2-3 Trading Sessions
HDFCLIFE makes a clean bullish divergence & gives a good move with a good Risk & reward Ratio
Give clean 5% returns in just 2-3 Trading Sessions
Bearish Divergence:
Condition-
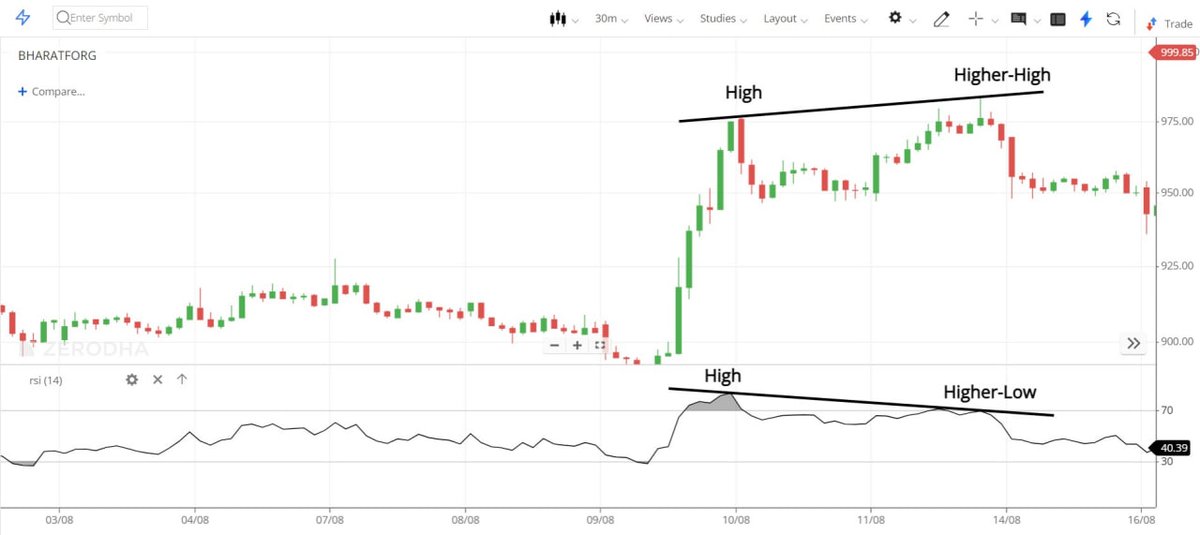
1. Price should form higher highs
2. RSI should form lower highs and is above 70
Bearish RSI Divergence:- chartink.com
Condition-
1. Price should form higher highs
2. RSI should form lower highs and is above 70
Bearish RSI Divergence:- chartink.com
HAPPSTMNDS 30 MIN CHART:-
HAPPSTMNDS makes a clean bearish divergence & gives a good move with a good Risk & reward Ratio
Give clean 4% returns in just 2-3 Trading Sessions
HAPPSTMNDS makes a clean bearish divergence & gives a good move with a good Risk & reward Ratio
Give clean 4% returns in just 2-3 Trading Sessions

BHARATFORG 30 MIN CHART:-
BHARATFORG makes a clean bearish divergence & gives a good move with a good Risk & reward Ratio
Give clean 3% returns in just 2 Trading Sessions
BHARATFORG makes a clean bearish divergence & gives a good move with a good Risk & reward Ratio
Give clean 3% returns in just 2 Trading Sessions
For Practice this setup follow your Free Telegram Group
✅ Trading Day Intraday Chart
✅ Weekend Swing Trading Chart
✅ 1% Weekly Income Trades Continuously 16 Trades Profit
✅ Weekly Positional Option Trade
✅ Nifty, BankNifty & Stocks S&R
JoinII t.me
✅ Trading Day Intraday Chart
✅ Weekend Swing Trading Chart
✅ 1% Weekly Income Trades Continuously 16 Trades Profit
✅ Weekly Positional Option Trade
✅ Nifty, BankNifty & Stocks S&R
JoinII t.me

Loading suggestions...