

Inferential Statistics in #DataScience 📊
It is a branch of #statistics that involves making inferences or conclusions about a population based on a sample of data from that population
Source - Prudhvi Vardhan
🧵
It is a branch of #statistics that involves making inferences or conclusions about a population based on a sample of data from that population
Source - Prudhvi Vardhan
🧵

It plays a crucial role in #datascience by helping #analysts and researchers draw meaningful insights from #data and make predictions or generalizations about larger populations.
The main goals of inferential statistics in data science include:
The main goals of inferential statistics in data science include:

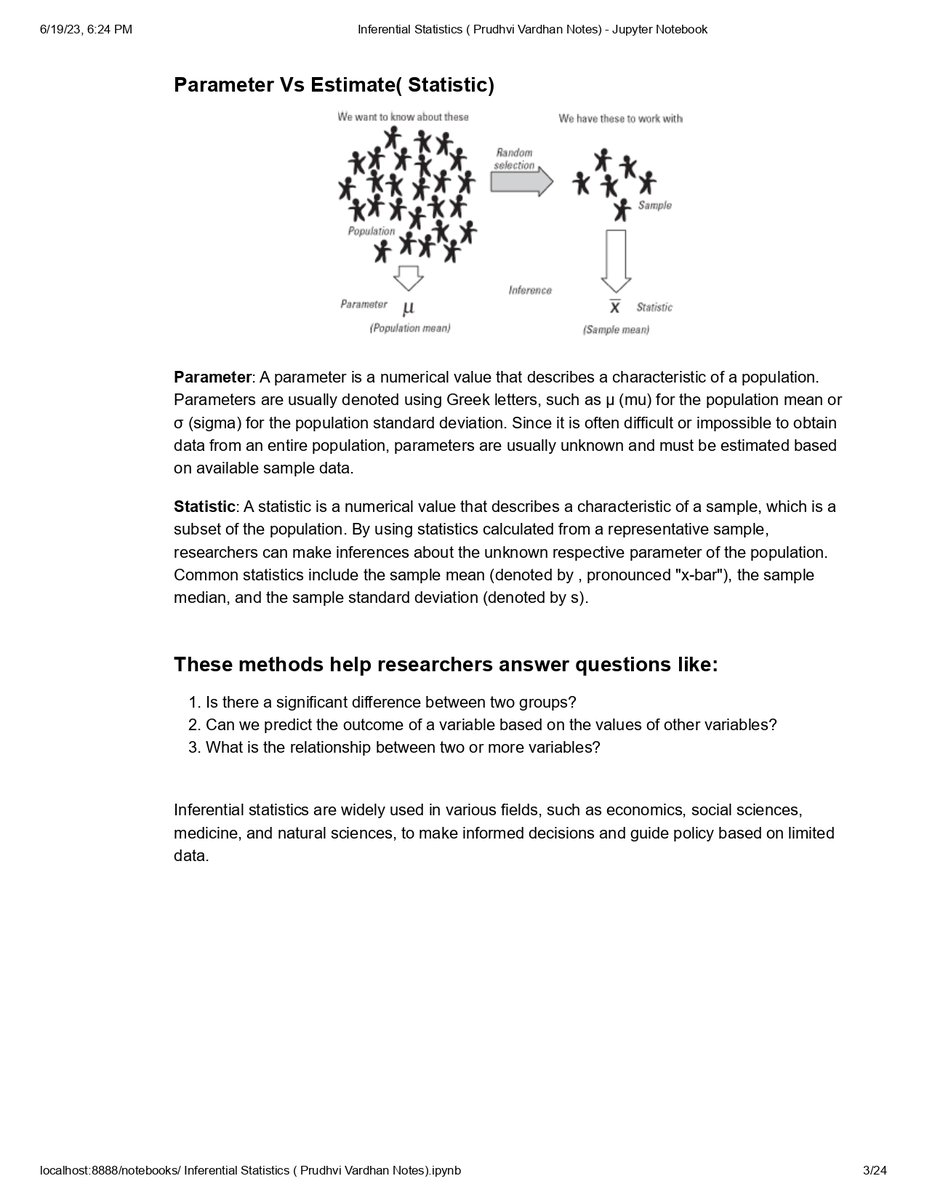

Estimation: #Inferentialstatistics allows you to estimate population parameters (such as means, proportions, variances) based on sample data. For example, you might estimate the average income of a population based on a sample survey.
Hypothesis Testing: IS helps you test #hypothesis and make decisions about population characteristics. You formulate a null hypothesis (usually representing no effect or no difference) & alternative hypothesis, then use sample #data to determine whether there enough evidence

Prediction & Generalization: Inferential #statistics enables you to generalize findings from sample to larger population allowing u to make predictions or draw conclusions about population as whole This especially important when it's not feasible to collect #data from entire pop
Relationship and Causation: Inferential #statistics helps you assess relationships between variables and determine if there is evidence of a causal connection. It can provide #insights into whether changes in one variable are associated with changes in another.
Common methods and #techniques used in inferential statistics within the realm of #datascience include:
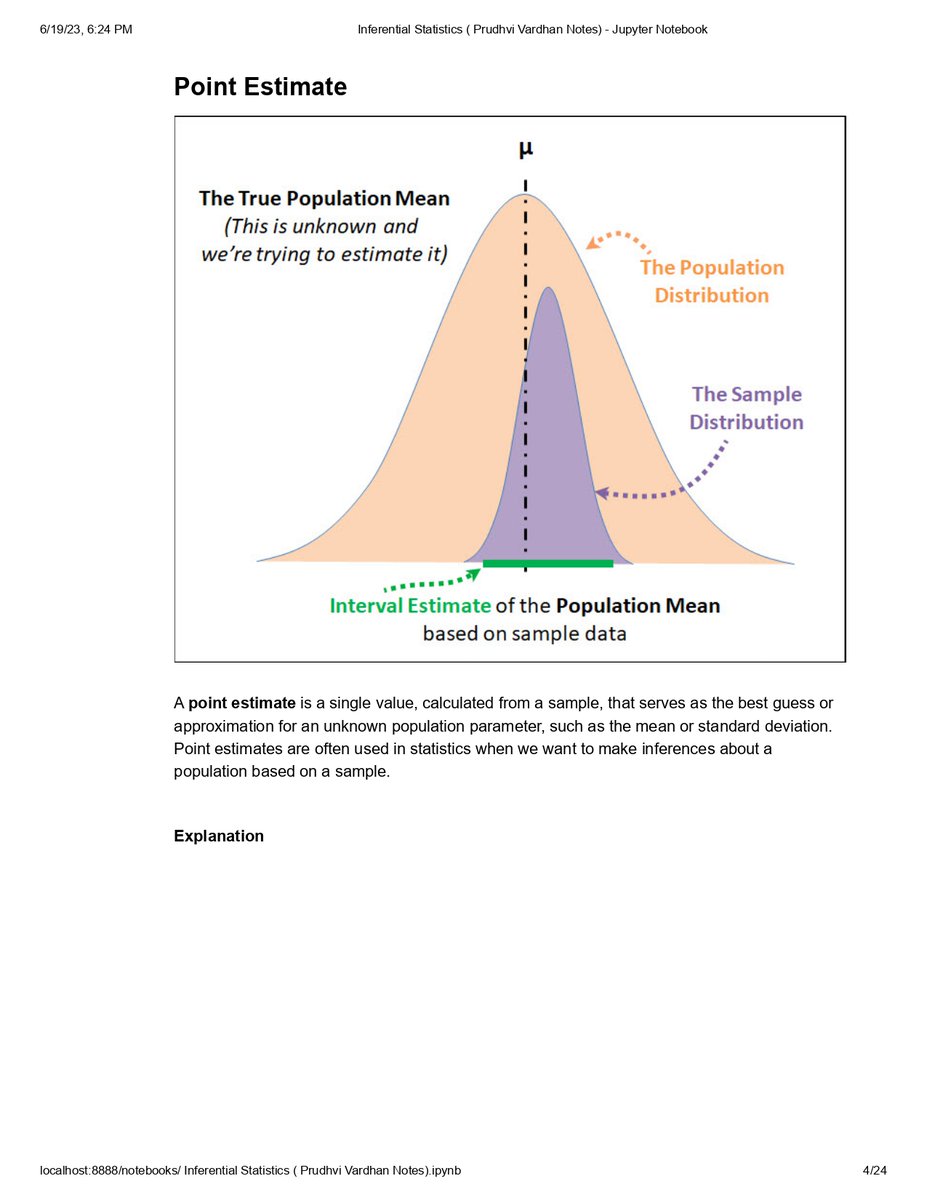
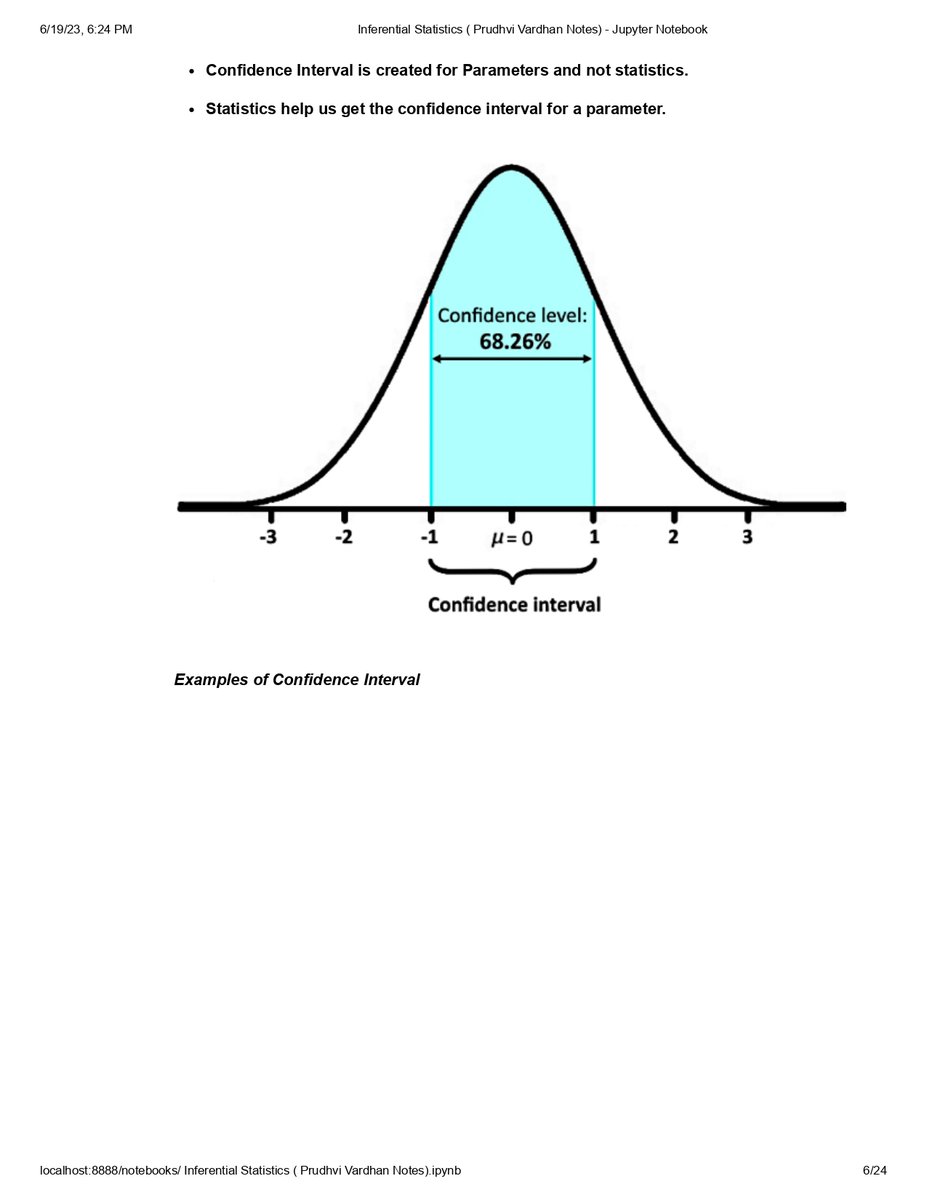
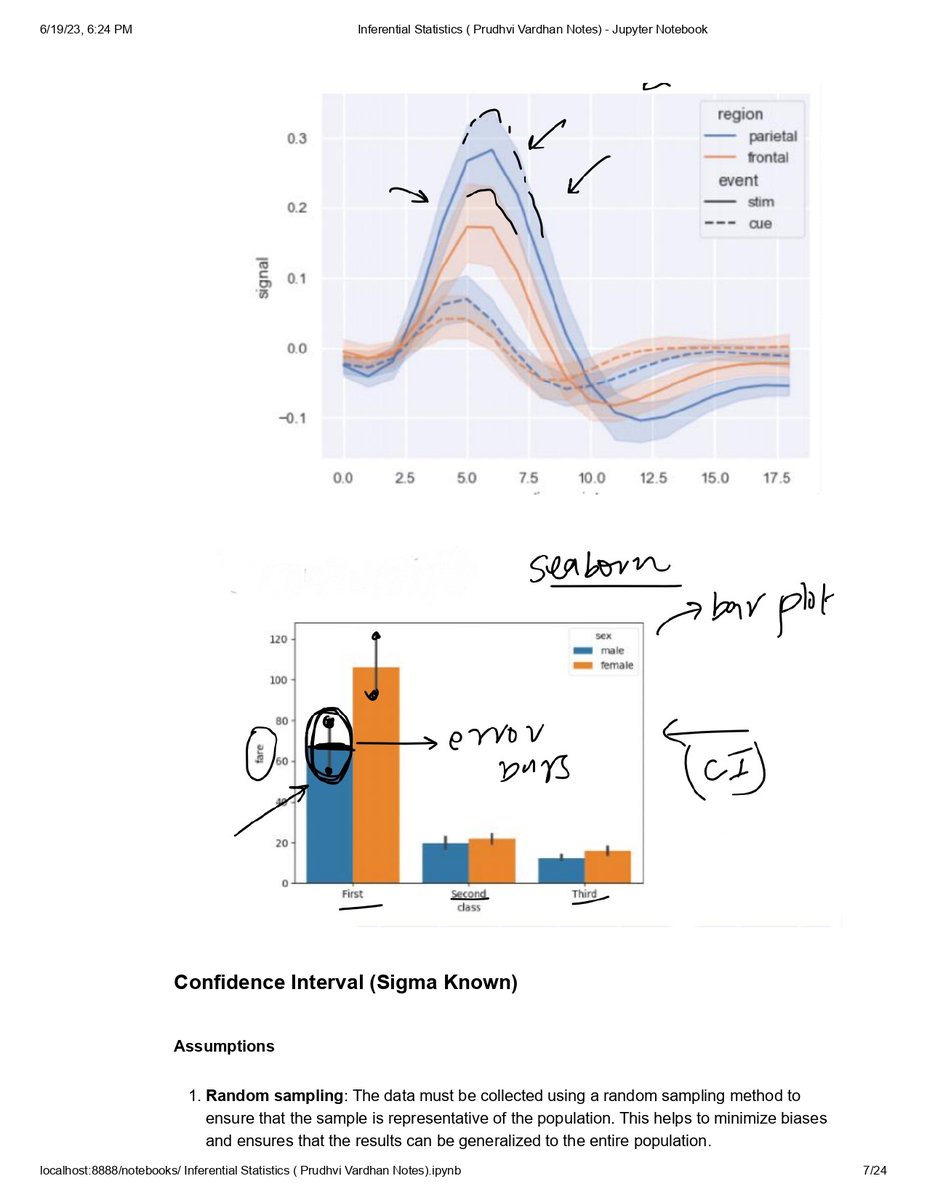
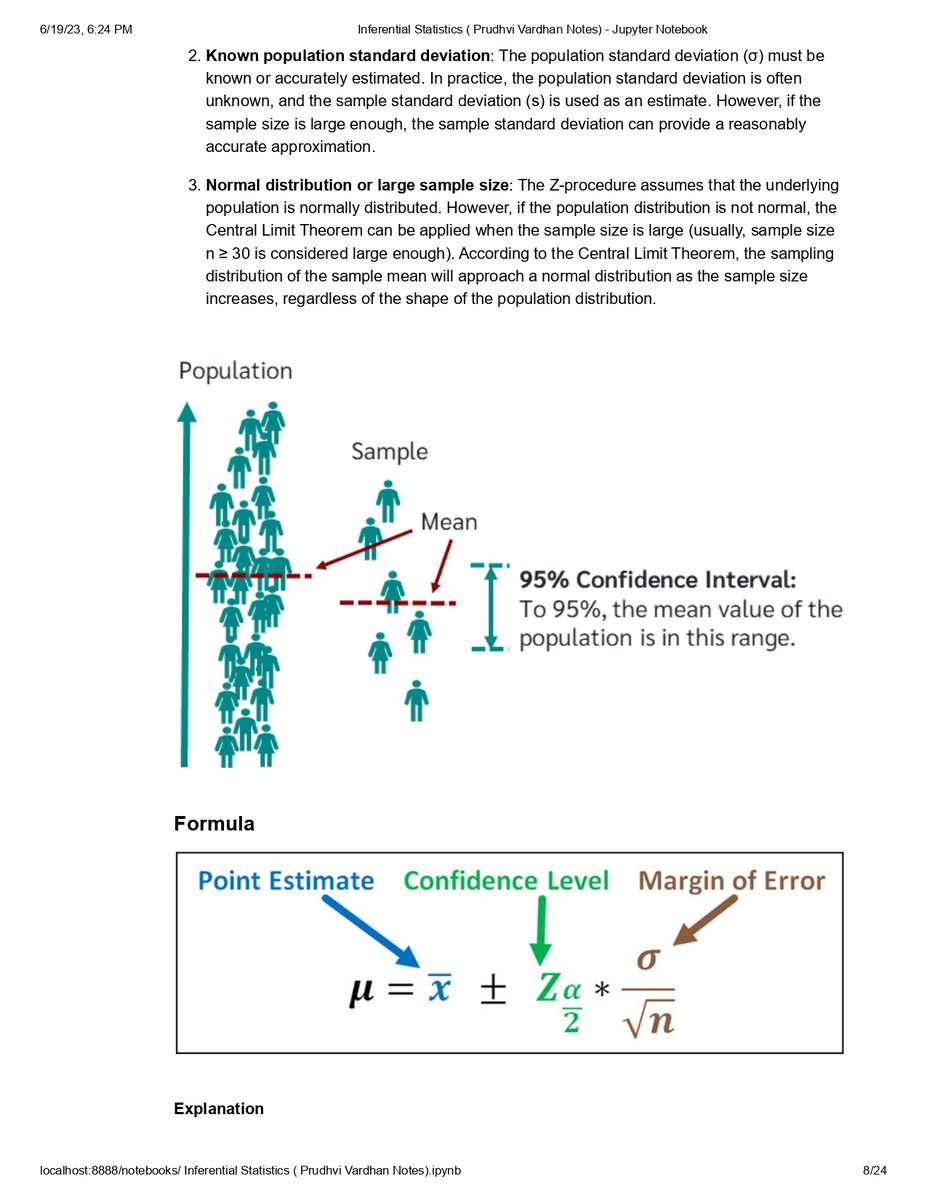
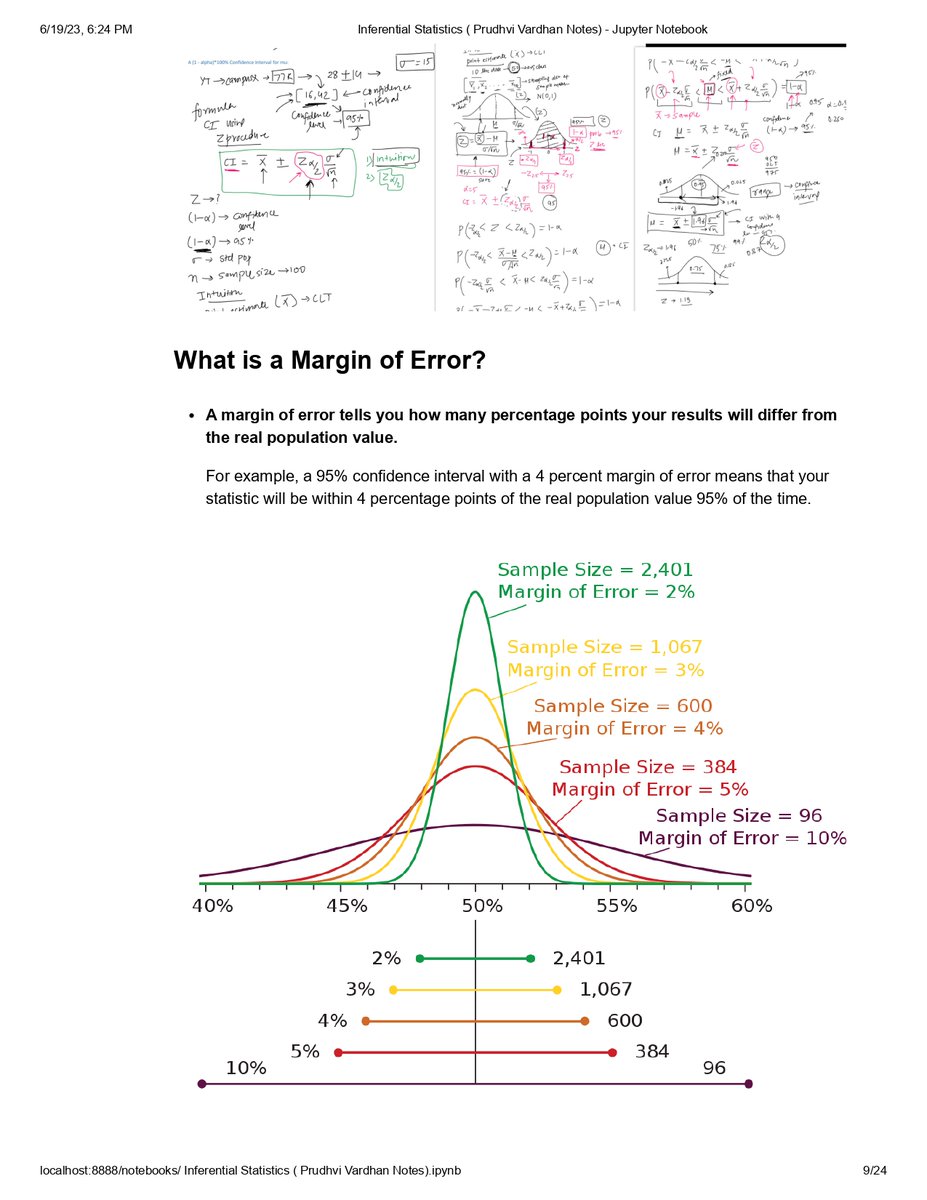
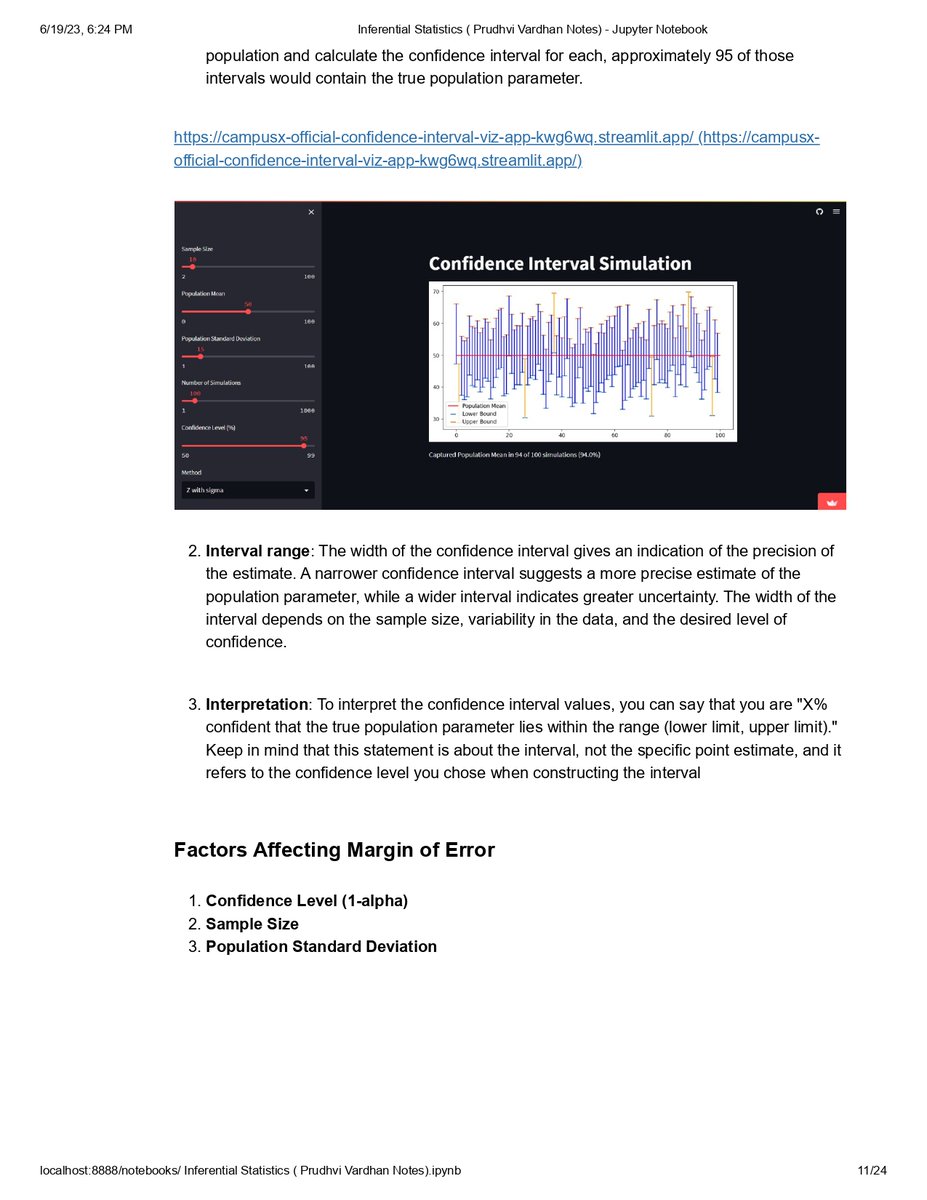
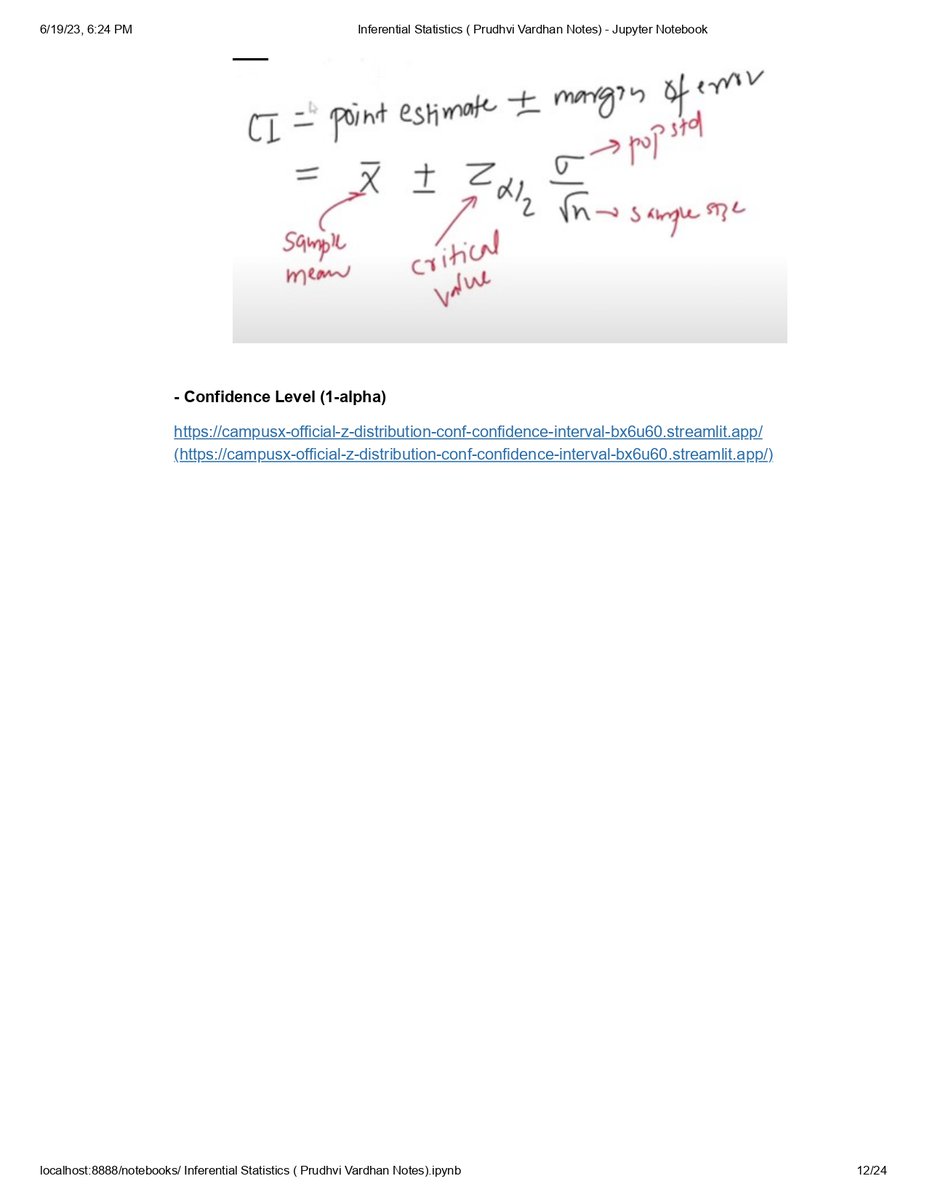
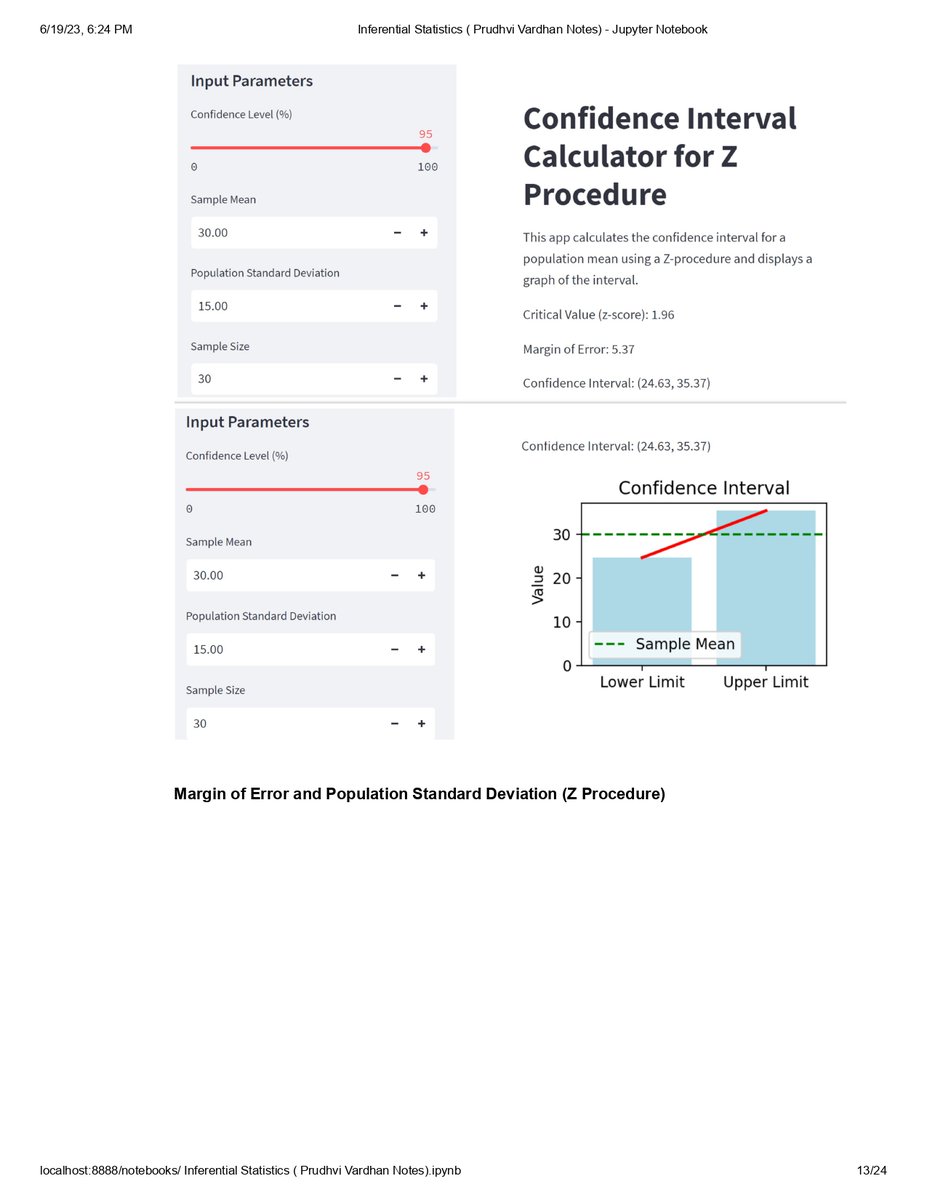
#ConfidenceIntervals: These provide a range of values within which a population parameter is likely to fall, based on sample data and a chosen level of confidence.
#ConfidenceIntervals: These provide a range of values within which a population parameter is likely to fall, based on sample data and a chosen level of confidence.

Hypothesis Testing: This involves techniques like t-tests, chi-squared tests, and #ANOVA (Analysis of Variance), which help you determine whether observed differences or relationships in sample data are statistically significant.
Regression Analysis: #Regression allows you to model and quantify relationships between variables, making it possible to predict one variable based on another. It also helps assess the strength and significance of those relationships.
ANOVA and MANOVA: Analysis of Variance (ANOVA) is used to compare means across multiple groups, while Multivariate Analysis of #Variance (MANOVA) extends this concept to multiple dependent variables.
Correlation Analysis: This technique measures strength & direction of linear relationship between two continuous variables.
Bootstrapping: involves repeatedly resampling from the #data to estimate sampling distribution of statistic, which helps in making more robust inferences
Bootstrapping: involves repeatedly resampling from the #data to estimate sampling distribution of statistic, which helps in making more robust inferences
Bayesian Inference: This approach uses prior knowledge and #data to update probabilities and make predictions. It's particularly useful when dealing with complex models or limited data.
Inferential #statistics requires a good understanding of probability theory, sampling techniques, and statistical distributions. It's essential for making data-driven decisions and drawing meaningful insights from data
Follow @Sachintukumar For more
Follow @Sachintukumar For more


Loading suggestions...