

21 year olds are making $10,000+ /m trading simply because they understand Technical Analysis.
Technical Analysis will make you fall in love with #crypto again!
Here’s how to read charts like a pro 🧵 (Plus stop loss & take profit strategy)
Technical Analysis will make you fall in love with #crypto again!
Here’s how to read charts like a pro 🧵 (Plus stop loss & take profit strategy)

Today we’ll be exploring
1️⃣ Support and resistance
2️⃣ Take profit and stop loss strategy
3️⃣ Major indicators
4️⃣ Helpful videos
1️⃣ Support and resistance
2️⃣ Take profit and stop loss strategy
3️⃣ Major indicators
4️⃣ Helpful videos
1️⃣ Support and resistance
I’ll try to make things simple in this thread, but the most important thing you need to understand is support and resistance and indicators.
It’s easier learning from a video so I’ve also linked some useful at the end of the thread
I’ll try to make things simple in this thread, but the most important thing you need to understand is support and resistance and indicators.
It’s easier learning from a video so I’ve also linked some useful at the end of the thread
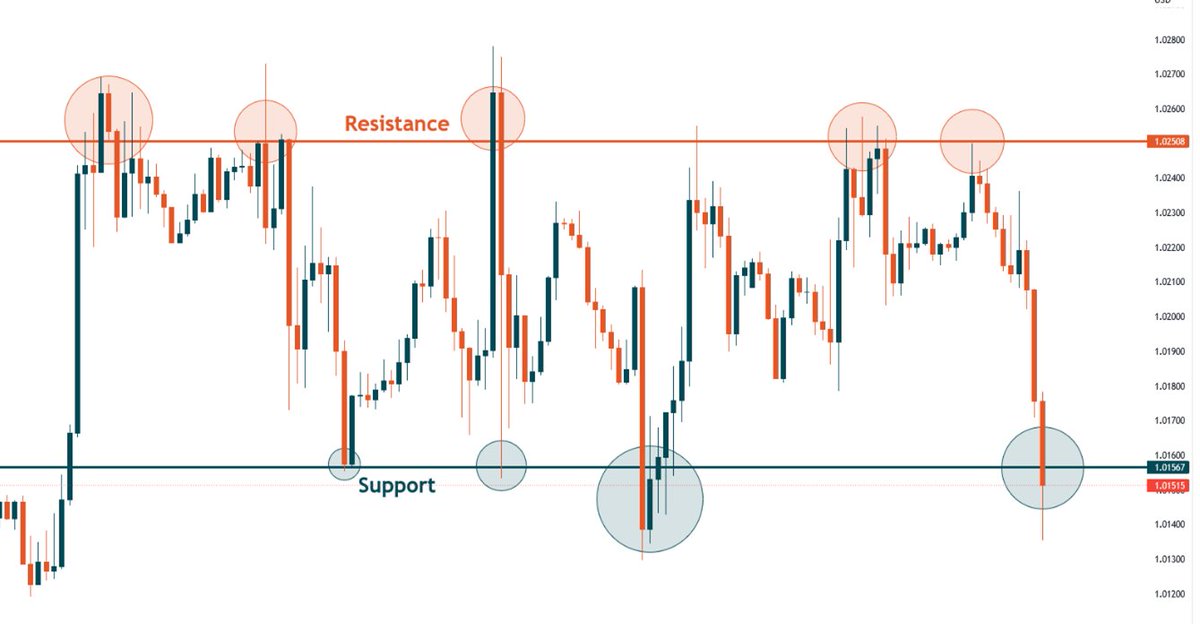
Support and resistance could be sideways, ascending or descending.
If an ascending support breaks the resistance, that leads to more upside.
If a descending resistance breaks the support, that leads to more down side.
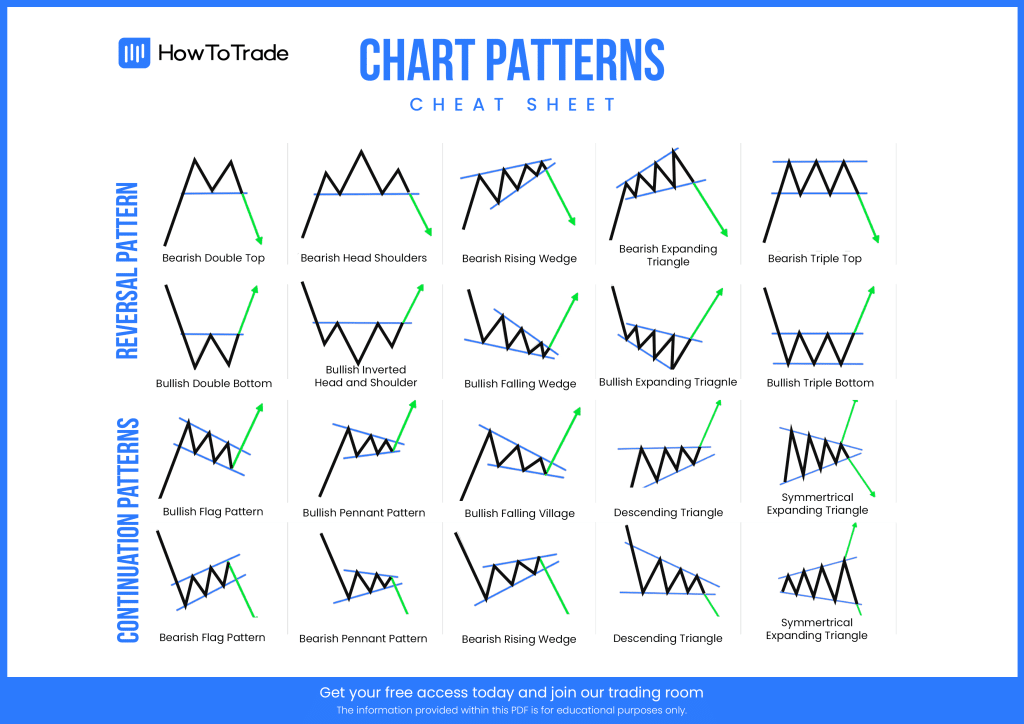
Forming a price pattern (triangles , cup and handles etc)
If an ascending support breaks the resistance, that leads to more upside.
If a descending resistance breaks the support, that leads to more down side.
Forming a price pattern (triangles , cup and handles etc)
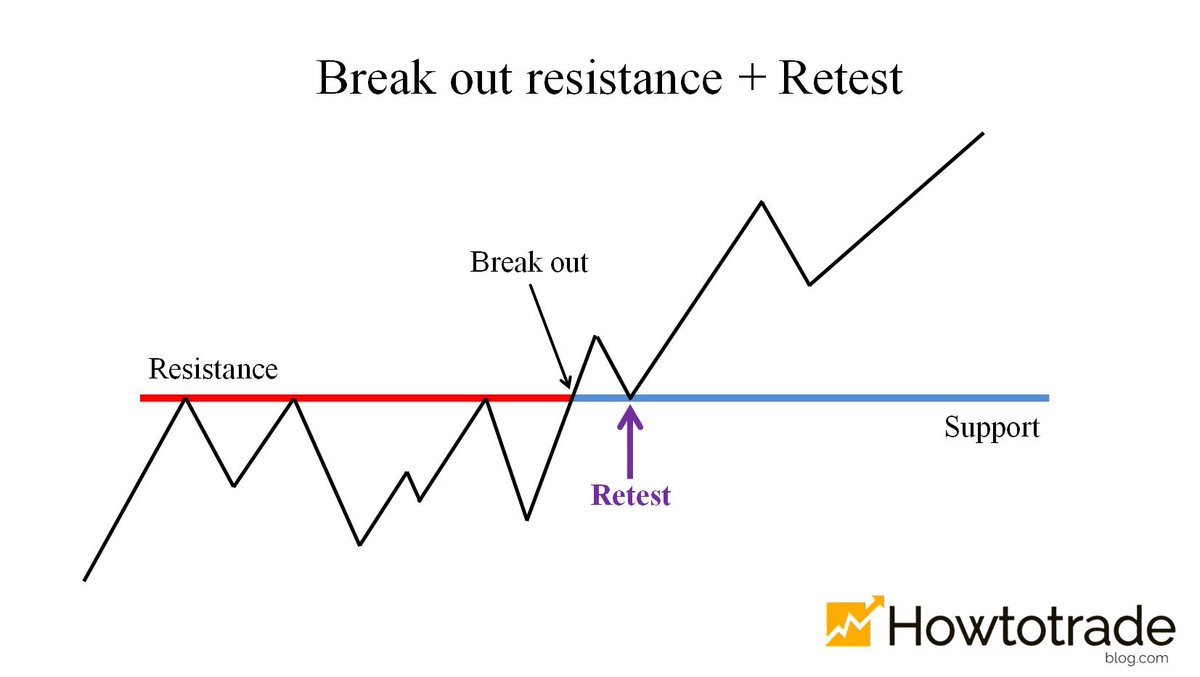
Most of the time when a support or resistance is broken, there needs to be good volume and a retest for it to be valid.
Sometimes there are false breakouts.
So you need to be very patient before entering, especially when trading futures.
Sometimes there are false breakouts.
So you need to be very patient before entering, especially when trading futures.
2️⃣ Take profit and stop loss strategy
⚠️ Stop-loss is essential for risk control.
The best ratio is 1:3, so the profit should be 3 times bigger than the loss.
e.g: if your Stop Loss is -5%, the Take Profit should be +15%.
⚠️ Stop-loss is essential for risk control.
The best ratio is 1:3, so the profit should be 3 times bigger than the loss.
e.g: if your Stop Loss is -5%, the Take Profit should be +15%.
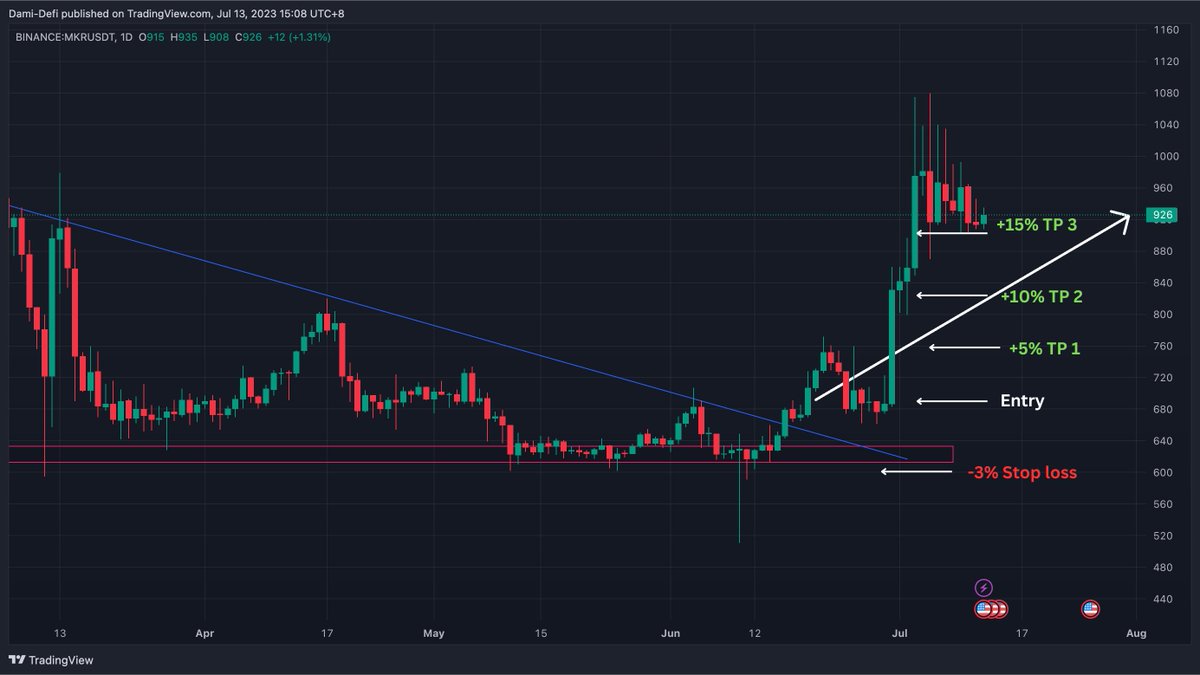
Only trades with this or greater risk to reward should be opened.
⚠️ The 2% Rule: never put more than 2% of your account at risk.
e.g if you have a $50,000 trading account, you could risk only up to $1,000 per trade.
It might range from 1-4%.
⚠️ The 2% Rule: never put more than 2% of your account at risk.
e.g if you have a $50,000 trading account, you could risk only up to $1,000 per trade.
It might range from 1-4%.
3️⃣ Major indicators
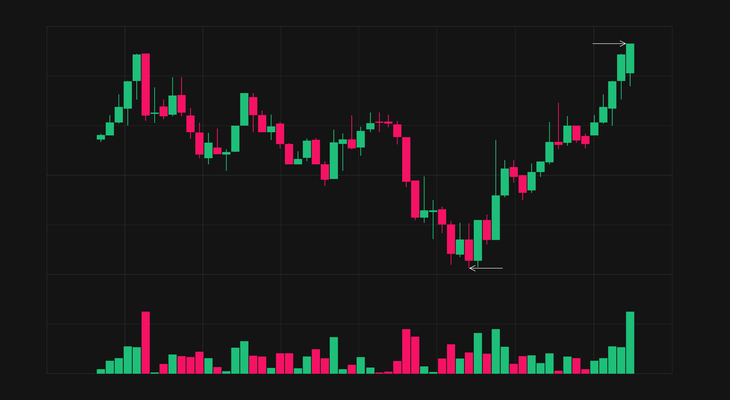
1. Volume
Volume is just the fuel 🚀.
Low volume = Weak trend
High volume = Strong trend
- Price + Vol increase : bullish
- Price increase + Vol Decrease : weak uptrend
- Price Decrease + Vol Increase : bearish
- Price + Vol Decrease: weak downtrend
1. Volume
Volume is just the fuel 🚀.
Low volume = Weak trend
High volume = Strong trend
- Price + Vol increase : bullish
- Price increase + Vol Decrease : weak uptrend
- Price Decrease + Vol Increase : bearish
- Price + Vol Decrease: weak downtrend
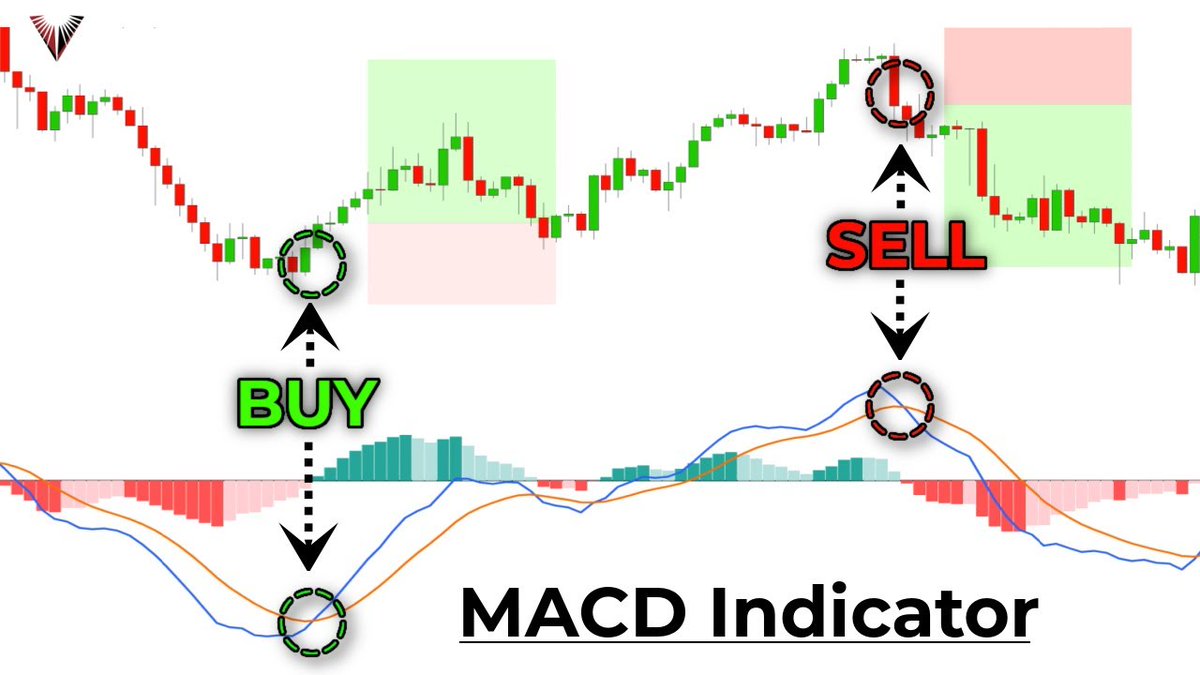
2. MACD
one of the most commonly used techincal analysis indicators.
It is a trend-following momentum indicator.
Traders use the MACD's histogram to identify when bullish or bearish momentum is high—and possibly overbought/oversold.
one of the most commonly used techincal analysis indicators.
It is a trend-following momentum indicator.
Traders use the MACD's histogram to identify when bullish or bearish momentum is high—and possibly overbought/oversold.
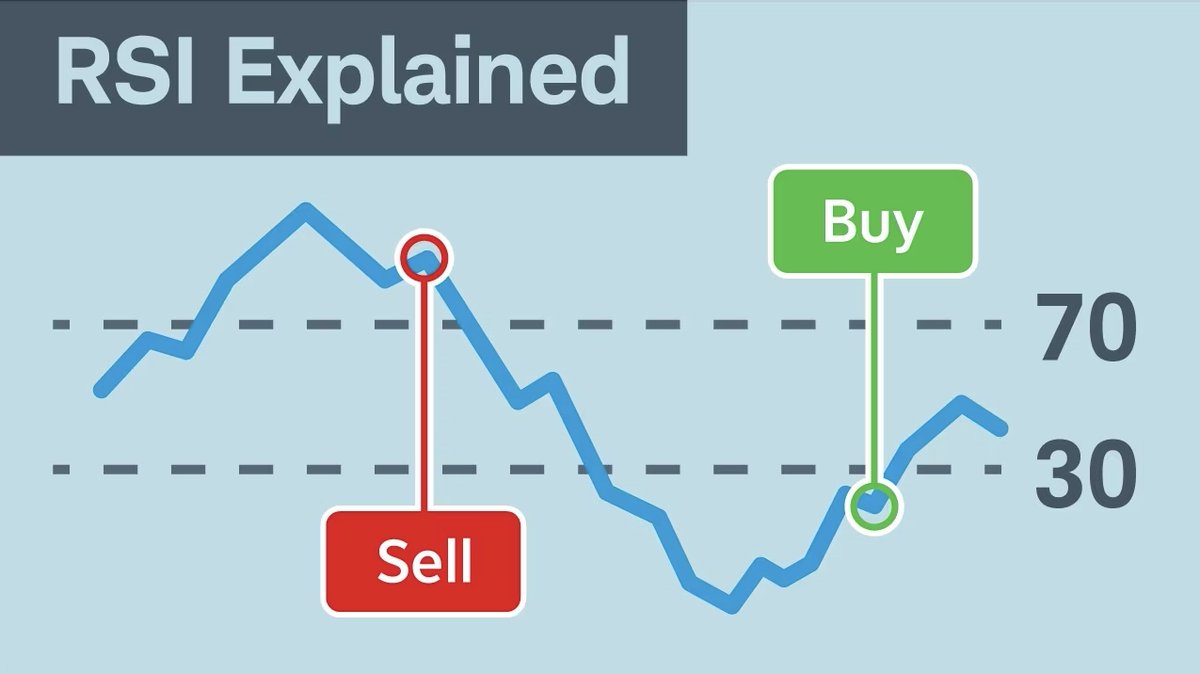
3. RSI
Low RSI levels, below 30 mean an asset is oversold or undervalued condition. (Buy opportunity)
High RSI levels, above 70 mean an asset is overbought or overvalued. (Sell opportunity)
50 means a neutral level or balance between bullish and bearish positions.
Low RSI levels, below 30 mean an asset is oversold or undervalued condition. (Buy opportunity)
High RSI levels, above 70 mean an asset is overbought or overvalued. (Sell opportunity)
50 means a neutral level or balance between bullish and bearish positions.
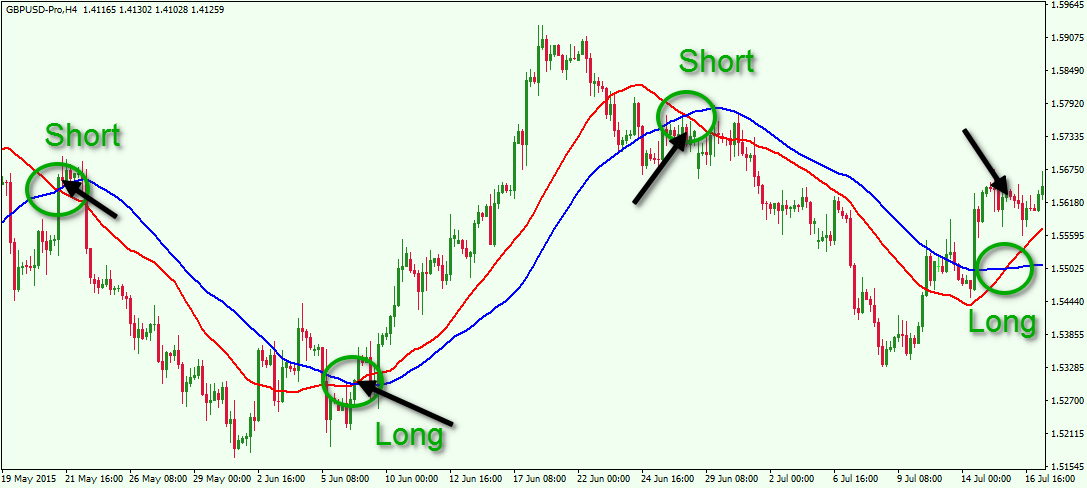
4. Moving average
For short-term trades the 5, 10, and 20 period MA are best, while for longer-term 50, 100, and 200 period.
When price tends to stay above the moving average = Uptrend (Buy)
If price action tends to stay below the moving average = Downtrend. (Sell)
For short-term trades the 5, 10, and 20 period MA are best, while for longer-term 50, 100, and 200 period.
When price tends to stay above the moving average = Uptrend (Buy)
If price action tends to stay below the moving average = Downtrend. (Sell)
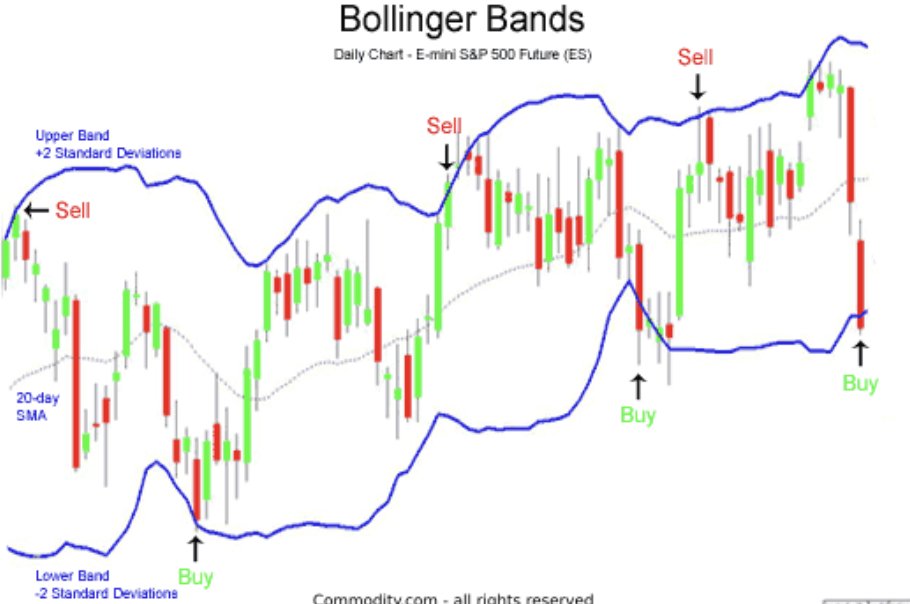
5. Bollinger bands
The upper band represents overbought territory or overvalued, while the lower band represents oversold or undervalued.
Mostly used together with other analysis tools.
The upper band represents overbought territory or overvalued, while the lower band represents oversold or undervalued.
Mostly used together with other analysis tools.
Mastering 1 or 2 indicators is the way to go.
When you see a promising chart plus the indicators to back up that analyses, trading becomes 10 times easier.
Using too many indicators will only confuse you.
Plus don't forget about fundamentals and general market conditions.
When you see a promising chart plus the indicators to back up that analyses, trading becomes 10 times easier.
Using too many indicators will only confuse you.
Plus don't forget about fundamentals and general market conditions.
Everything in this thread is my personal view and not financial advice.
For more alpha threads, latest airdrops, my trades, charts & calls, industry news & whale wallet tracking:
Join our free TG:
t.me
For more alpha threads, latest airdrops, my trades, charts & calls, industry news & whale wallet tracking:
Join our free TG:
t.me

Thats it for now.
I hope this brought value to you. If you gained from it please :
Like, RT & follow for more 🙏🏽.
I hope this brought value to you. If you gained from it please :
Like, RT & follow for more 🙏🏽.
Loading suggestions...