

1/ All Time High or 52-week High Breakout:
Stock that breaks the uptrend are the one that can give massive upmove.
These stocks are considered as strong stocks in the market.
Timeframe should be monthly and if price closes above ATH or 52 week high on any day you can enter.
Stock that breaks the uptrend are the one that can give massive upmove.
These stocks are considered as strong stocks in the market.
Timeframe should be monthly and if price closes above ATH or 52 week high on any day you can enter.
Example:
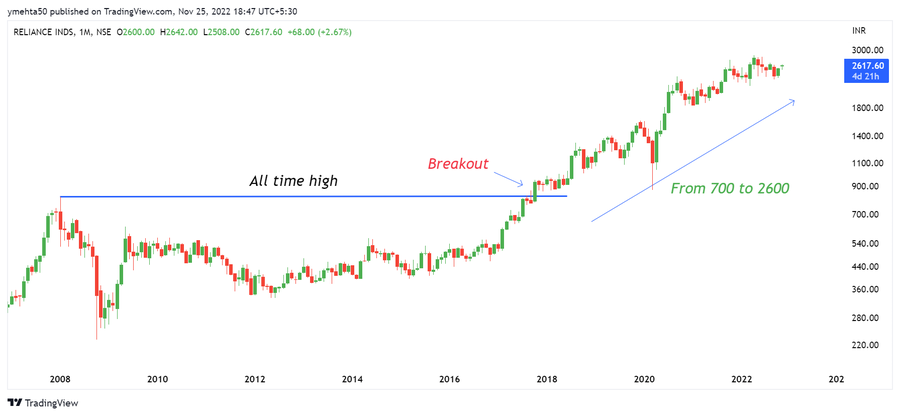
Reliance Chart.
It gave breakout above its All Time High level after 10 years and then never looking back.
Price moved up from 700 to 2600.
Returns of 270% in five years.
Reliance Chart.
It gave breakout above its All Time High level after 10 years and then never looking back.
Price moved up from 700 to 2600.
Returns of 270% in five years.
How to Follow/Trail Stoploss?
Initially keep stoploss at swing low on daily/weekly chart and trail your stoploss accordingly to enjoy massive upmove.
Other ways of Trailing Stoploss can be using 200 EMA or any other indicator.
Initially keep stoploss at swing low on daily/weekly chart and trail your stoploss accordingly to enjoy massive upmove.
Other ways of Trailing Stoploss can be using 200 EMA or any other indicator.

chartink.com/screener/52-we…
52 Week High Breakout, Technical Analysis Scanner
52 Week High Breakout by YMehta_ Technical & Fundamental stock screener, scan stocks based on rsi, p...

chartink.com/screener/all-t…
All Time High Breakout, Technical Analysis Scanner
All Time High Breakout by YMehta_ Technical & Fundamental stock screener, scan stocks based on rsi,...
2/ Volatility Contraction:
Setup:
⚡️ Identify a big candle either bullish or bearish which have less wick.
⚡️ Volume of this candle should be above average
⚡️ After that atleast three entire candle should form inside the range of that big candle
Setup:
⚡️ Identify a big candle either bullish or bearish which have less wick.
⚡️ Volume of this candle should be above average
⚡️ After that atleast three entire candle should form inside the range of that big candle
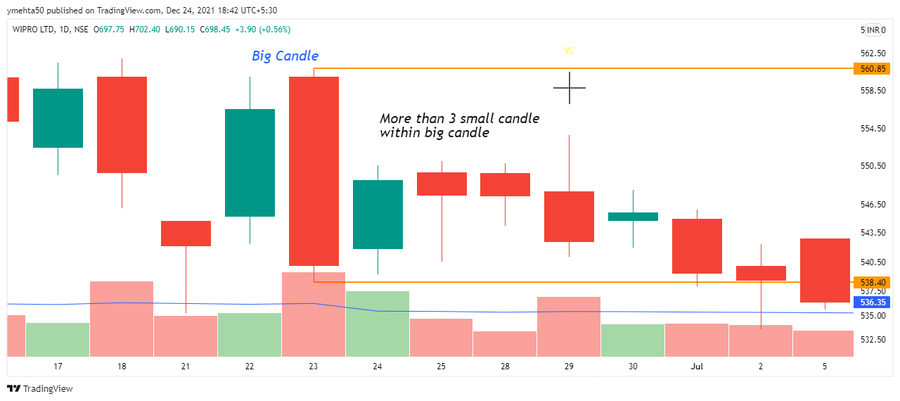
⚡️ Wait for breakout above high of the big candle with good volumes
⚡️ Stoploss will be low of the same big candle and trail SL as per your setup
⚡️ Target Risk:Reward of atleast 1:1
⚡️ Stock can be in any trend
⚡️ Use Daily/Weekly/Monthly Time frame
⚡️ Stoploss will be low of the same big candle and trail SL as per your setup
⚡️ Target Risk:Reward of atleast 1:1
⚡️ Stock can be in any trend
⚡️ Use Daily/Weekly/Monthly Time frame
Let's see some live case or examples.
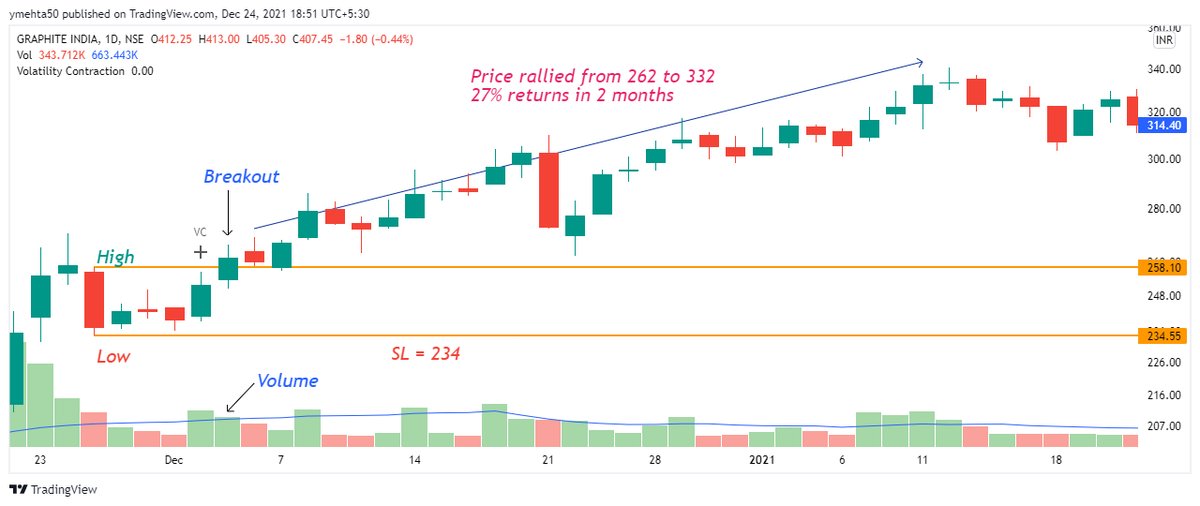
Graphite Daily Chart.
After satisfying all the criteria of candle formation and a breakout above big candle high.
After that stock had rallied from 262 to 332 which is almost 27% returns in short term. Risk in this trade was 11%.
Graphite Daily Chart.
After satisfying all the criteria of candle formation and a breakout above big candle high.
After that stock had rallied from 262 to 332 which is almost 27% returns in short term. Risk in this trade was 11%.
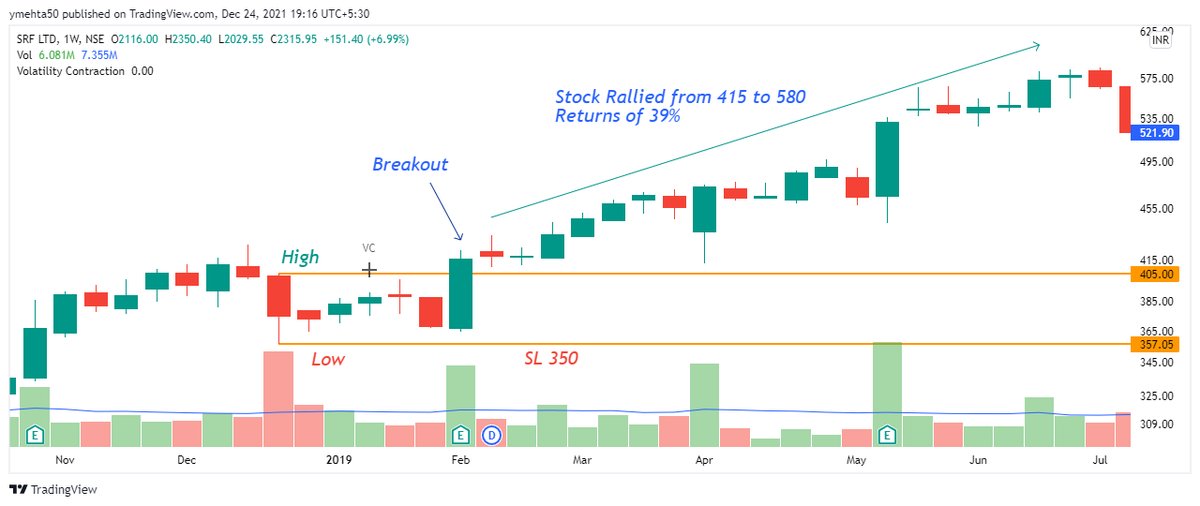
#SRF Weekly Chart.
It had formed Volatility Contraction pattern and gave breakout above high.
After that stock had rallied from 415 to 580 in short term.
Returns of 39% and Risk in this trade was 10%.
It had formed Volatility Contraction pattern and gave breakout above high.
After that stock had rallied from 415 to 580 in short term.
Returns of 39% and Risk in this trade was 10%.
#IndiaMart Monthly Chart.
It had formed Volatility Contraction pattern and gave breakout above high.
After that stock had rallied from 2850 to 9900 in six months.
Returns of 250% and Risk in this trade was 43% which is very high. So position sizing is important here.
It had formed Volatility Contraction pattern and gave breakout above high.
After that stock had rallied from 2850 to 9900 in six months.
Returns of 250% and Risk in this trade was 43% which is very high. So position sizing is important here.
Now important part.
I have created scanners related to the same on Chartink.
Daily Volatility Contraction: chartink.com
Weekly Volatility Contraction: chartink.com
You can create a screener for monthly time frame and share it with others.
I have created scanners related to the same on Chartink.
Daily Volatility Contraction: chartink.com
Weekly Volatility Contraction: chartink.com
You can create a screener for monthly time frame and share it with others.

chartink.com/screener/volat…
Volatility Contraction Weekly, Technical Analysis Scanner
After contraction, there is expansion in stocks, depending on PA and breakout, trade in that directi...

chartink.com/screener/volat…
Volatility Contraction, Technical Analysis Scanner
Technical & Fundamental stock screener, scan stocks based on rsi, pe, macd, breakouts, divergence, g...
I have created Volatility Contraction #Indicator on
@tradingview
and it is open sourced.
Use this link to add the indicator:
in.tradingview.com
It will mark Volatility Contraction (VC) candle automatically on chart and it will adjust according to the time frame.
@tradingview
and it is open sourced.
Use this link to add the indicator:
in.tradingview.com
It will mark Volatility Contraction (VC) candle automatically on chart and it will adjust according to the time frame.

3/ How to Catch Stock Before Breakout:
I have got many DMs related to buying stocks before breakout so sharing the strategy again here.
⚡ List down all the stocks that are 25% below from the All Time High Levels using the screener:
chartink.com
I have got many DMs related to buying stocks before breakout so sharing the strategy again here.
⚡ List down all the stocks that are 25% below from the All Time High Levels using the screener:
chartink.com

⚡ Apply Volatility Contraction Screener and identify those stocks that are having VCP Candle and are about blast on either side.
⚡ Trade as per the rule shared in the Volatility Contraction Strategy.
⚡ Trade as per the rule shared in the Volatility Contraction Strategy.
Note all these strategies are simple and effective to use but these are not holy grail strategies. If you are confident and comfortable, then only use it.
Stoplosses will hit, but it is part of the trading. So accept it and move on to the next opportunity.
Stoplosses will hit, but it is part of the trading. So accept it and move on to the next opportunity.
These are some Positional and Swing Trading Strategies I use in Stocks.
If you found this useful, please RT the first tweet.
For live trading and stock market related updates, you can join our Telegram Channel⤵️
telegram.me
If you found this useful, please RT the first tweet.
For live trading and stock market related updates, you can join our Telegram Channel⤵️
telegram.me

Loading suggestions...