

- Trading with CrVOL -
This is a short & simple thread to help your learn about Cumulative Relative Volume (CrVOL) indicator & how you can use it in your trading.
• Beginner friendly
• Works on all assets
• Works on all timeframes
Dropping part 2 if I see enough interest.
This is a short & simple thread to help your learn about Cumulative Relative Volume (CrVOL) indicator & how you can use it in your trading.
• Beginner friendly
• Works on all assets
• Works on all timeframes
Dropping part 2 if I see enough interest.

CRVOL is an experimental indicator I've created as part of my Volume Suite script on TradingView. Seeing no other indicators implementing this concept, I decided to publish it, as it has proven to be very useful and a great alternative to other similar volume-based tools like OBV or CVD.
You can access the indicator by adding the “Volume Suite - By Leviathan” script to your chart and then selecting CRVOL in settings.
- tradingview.com
You can access the indicator by adding the “Volume Suite - By Leviathan” script to your chart and then selecting CRVOL in settings.
- tradingview.com
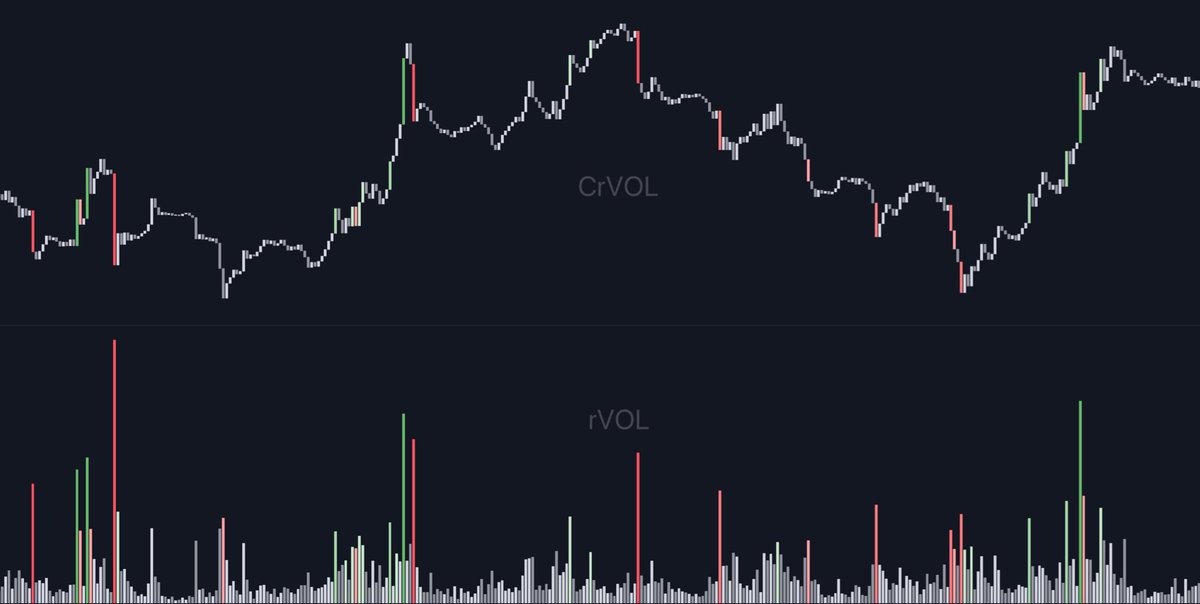
What is CrVOL
Cumulative Relative Volume or CRVOL is based on Relative Volume, which is the ratio between the current volume and the average volume over a specific period. It indicates how significant the current volume is in the context of its historical values. CRVOL builds upon this concept by creating a cumulative total of RVOL, but it does so with a directional bias. As we don’t have access to tick data on Tradingview for more detailed interpretation, the direction is determined by comparing the open and close prices of the current bar. If the closing price of the bar is higher than its opening price, the RVOL value for that period is added to the cumulative total. Conversely, if the bar's closing price is lower than its opening price, the RVOL value is subtracted from the cumulative total.
Cumulative Relative Volume or CRVOL is based on Relative Volume, which is the ratio between the current volume and the average volume over a specific period. It indicates how significant the current volume is in the context of its historical values. CRVOL builds upon this concept by creating a cumulative total of RVOL, but it does so with a directional bias. As we don’t have access to tick data on Tradingview for more detailed interpretation, the direction is determined by comparing the open and close prices of the current bar. If the closing price of the bar is higher than its opening price, the RVOL value for that period is added to the cumulative total. Conversely, if the bar's closing price is lower than its opening price, the RVOL value is subtracted from the cumulative total.
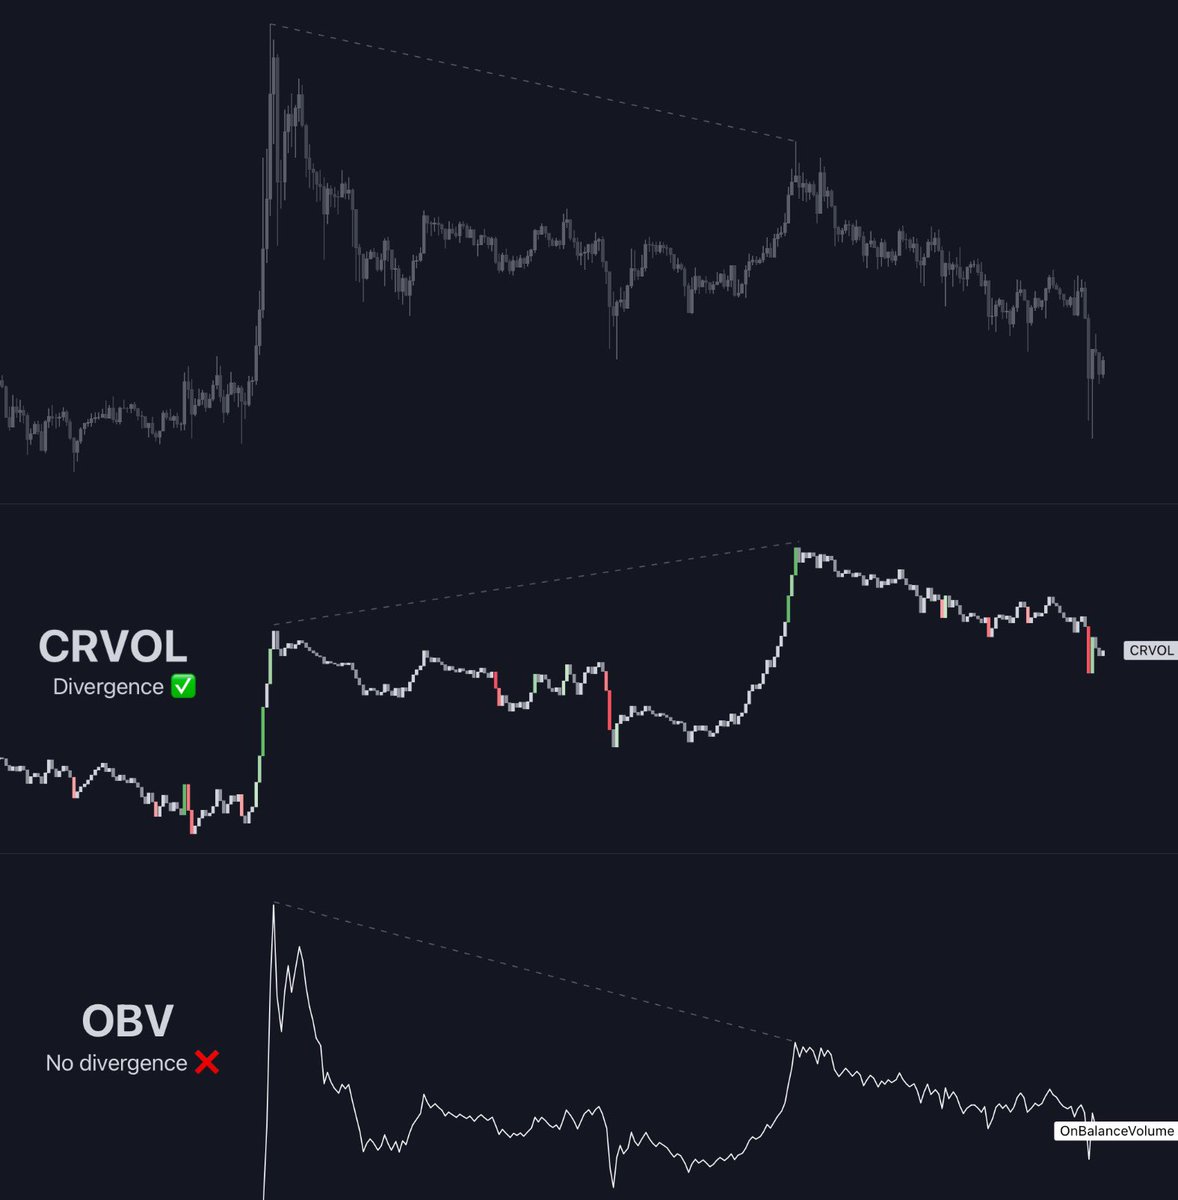
Is it the same as OBV?
While the concept is very similar, CRVOL and OBV do not display the same results as CRVOL cumulates the values of relative volume, while OBV does so with regular volume. The difference in divergences provided is quite significant in favor of CRVOL (imo).
While the concept is very similar, CRVOL and OBV do not display the same results as CRVOL cumulates the values of relative volume, while OBV does so with regular volume. The difference in divergences provided is quite significant in favor of CRVOL (imo).
The premise
Since Relative Volume measures the relative participation of buyers/sellers, it can give us an idea about the effort/aggressiveness of market participants vs the result.
Here are the two simple premises:
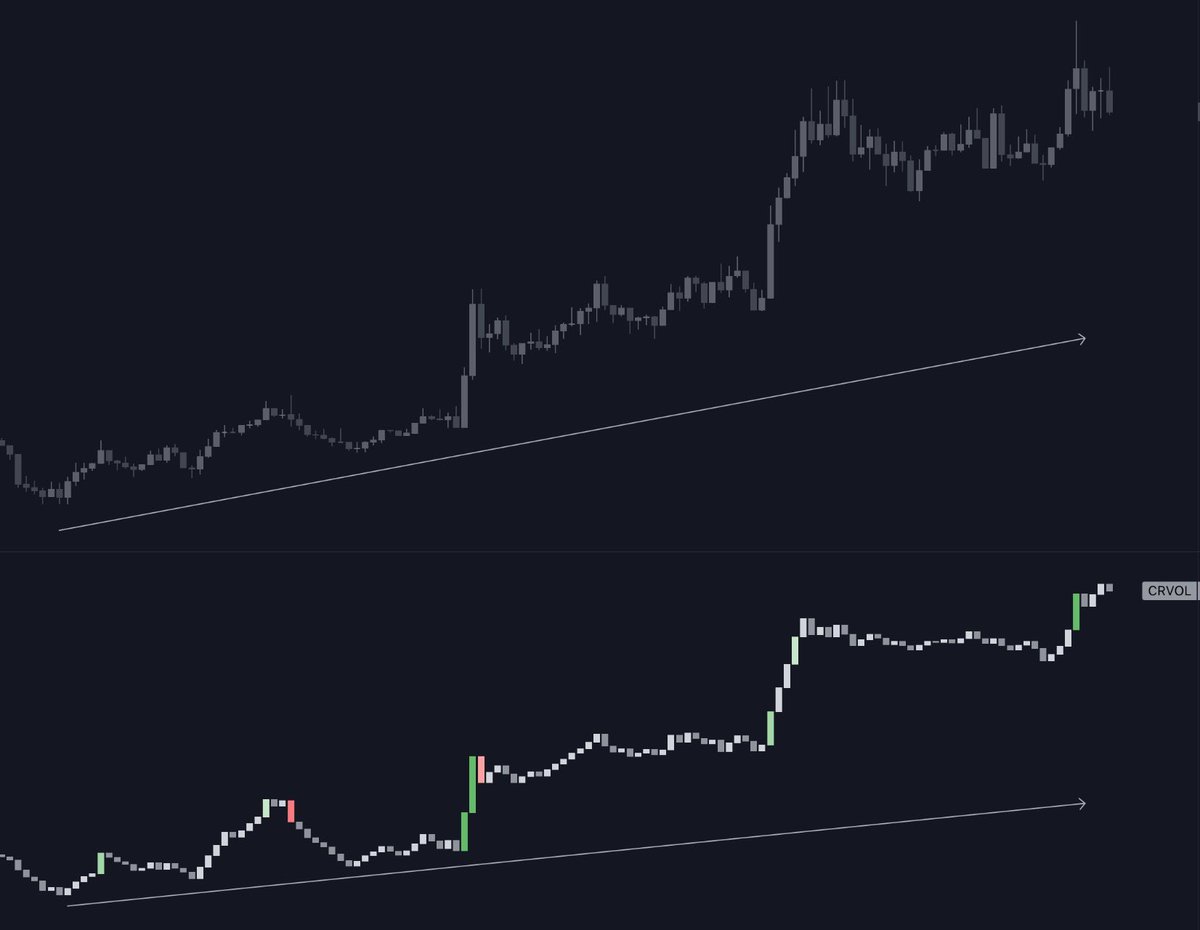
- Increasing price should be accompanied by increasing CRVOL
- Decreasing price should be accompanied by decreasing CRVOL
If one of the premises is not true, we talk about divergences.
In other words: For price to continue making new highs, there usually needs to be increased relative effort/pressure from buys (increasing CRVOL) and for the price to continue making new lows, there needs to be increased relative effort/pressure from sells (decreasing CRVOL).
Since Relative Volume measures the relative participation of buyers/sellers, it can give us an idea about the effort/aggressiveness of market participants vs the result.
Here are the two simple premises:
- Increasing price should be accompanied by increasing CRVOL
- Decreasing price should be accompanied by decreasing CRVOL
If one of the premises is not true, we talk about divergences.
In other words: For price to continue making new highs, there usually needs to be increased relative effort/pressure from buys (increasing CRVOL) and for the price to continue making new lows, there needs to be increased relative effort/pressure from sells (decreasing CRVOL).
Divergences
The divergences between price and CRVOL can help you catch short-term reversals.
To keep this simple, I will use the terminology also used in eg. CVD analysis.
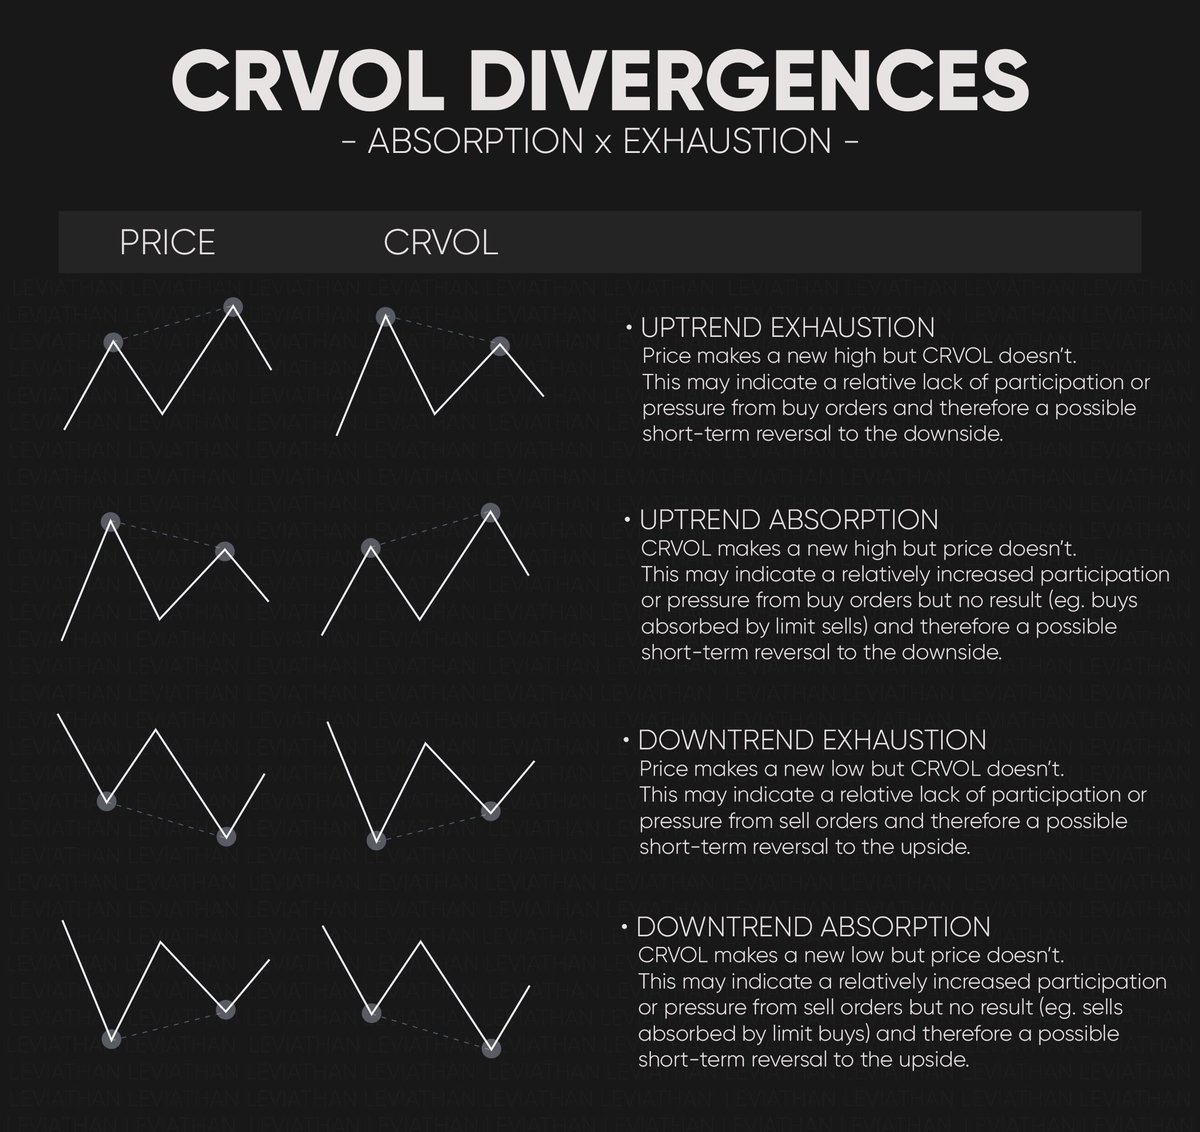
Bearish Bias Divergences
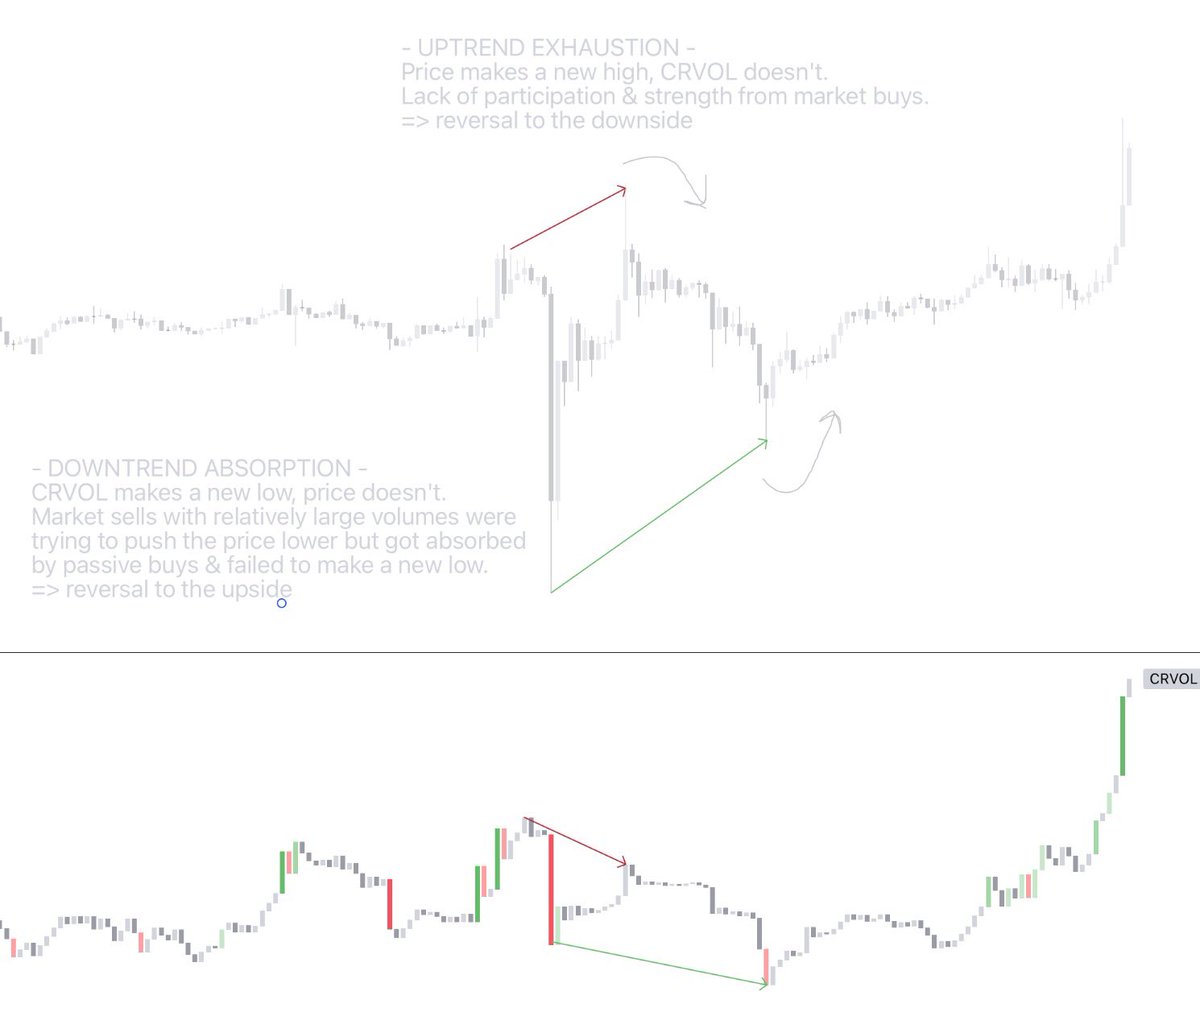
- Uptrend Exhaustion: Price makes a new high but CRVOL doesn’t. This may indicate the relative lack of effort/pressure/aggressiveness from buys.
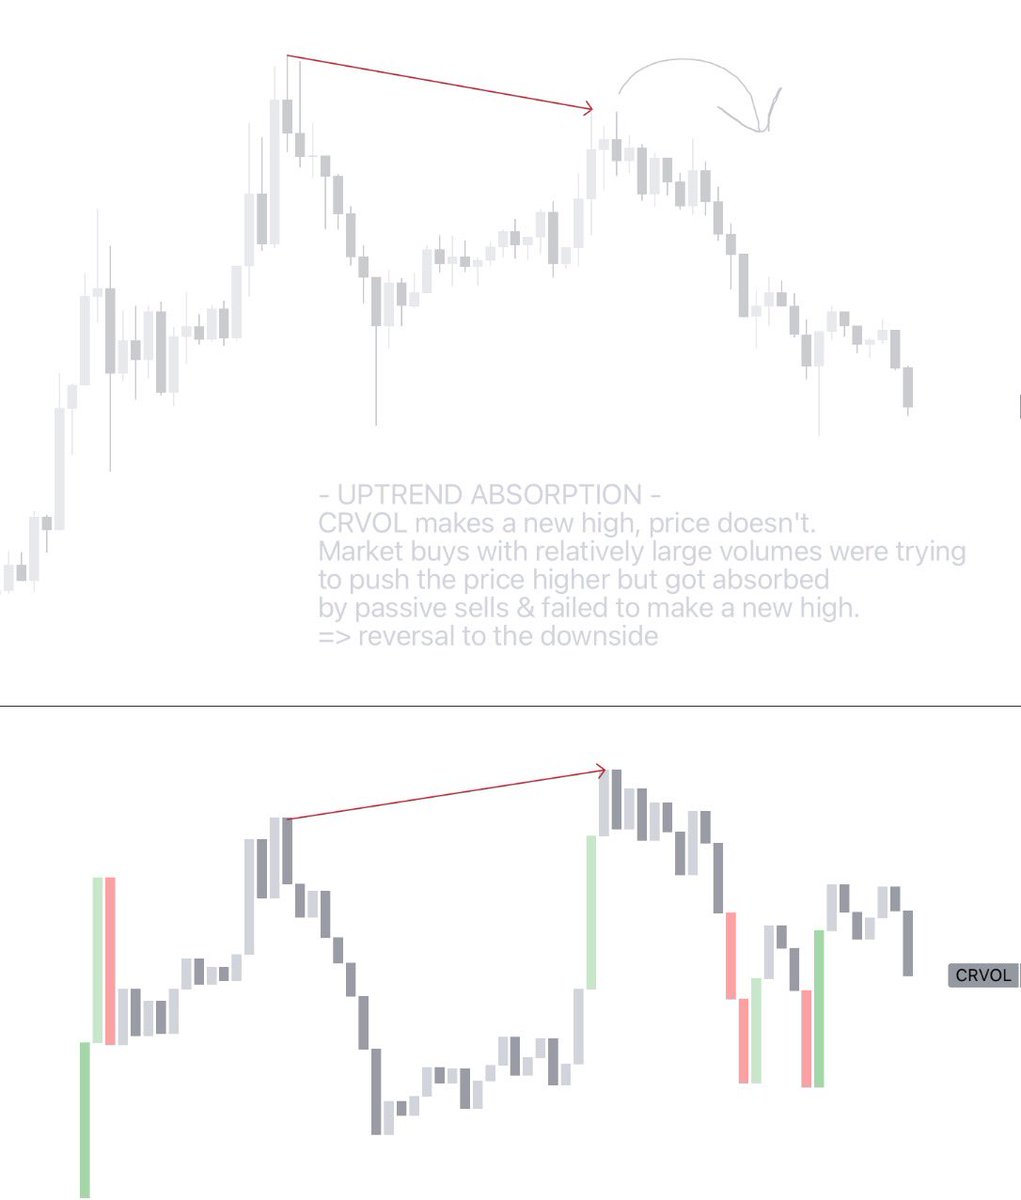
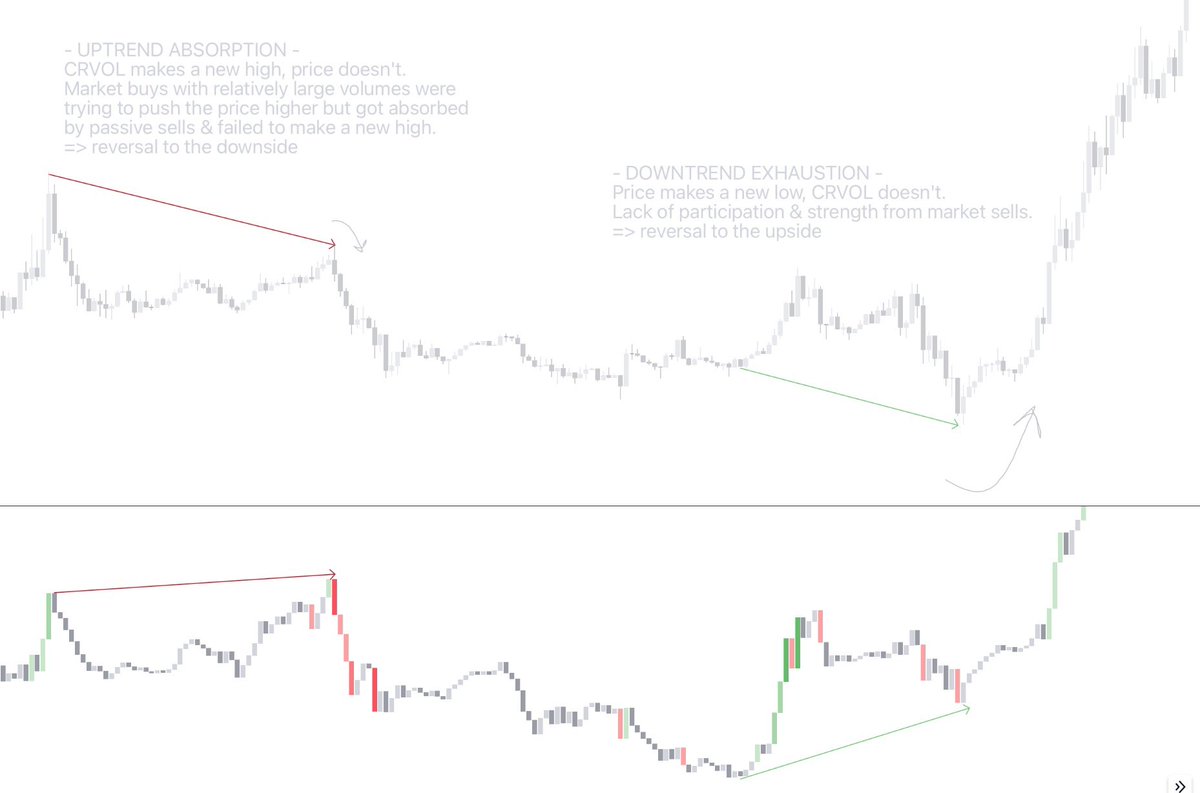
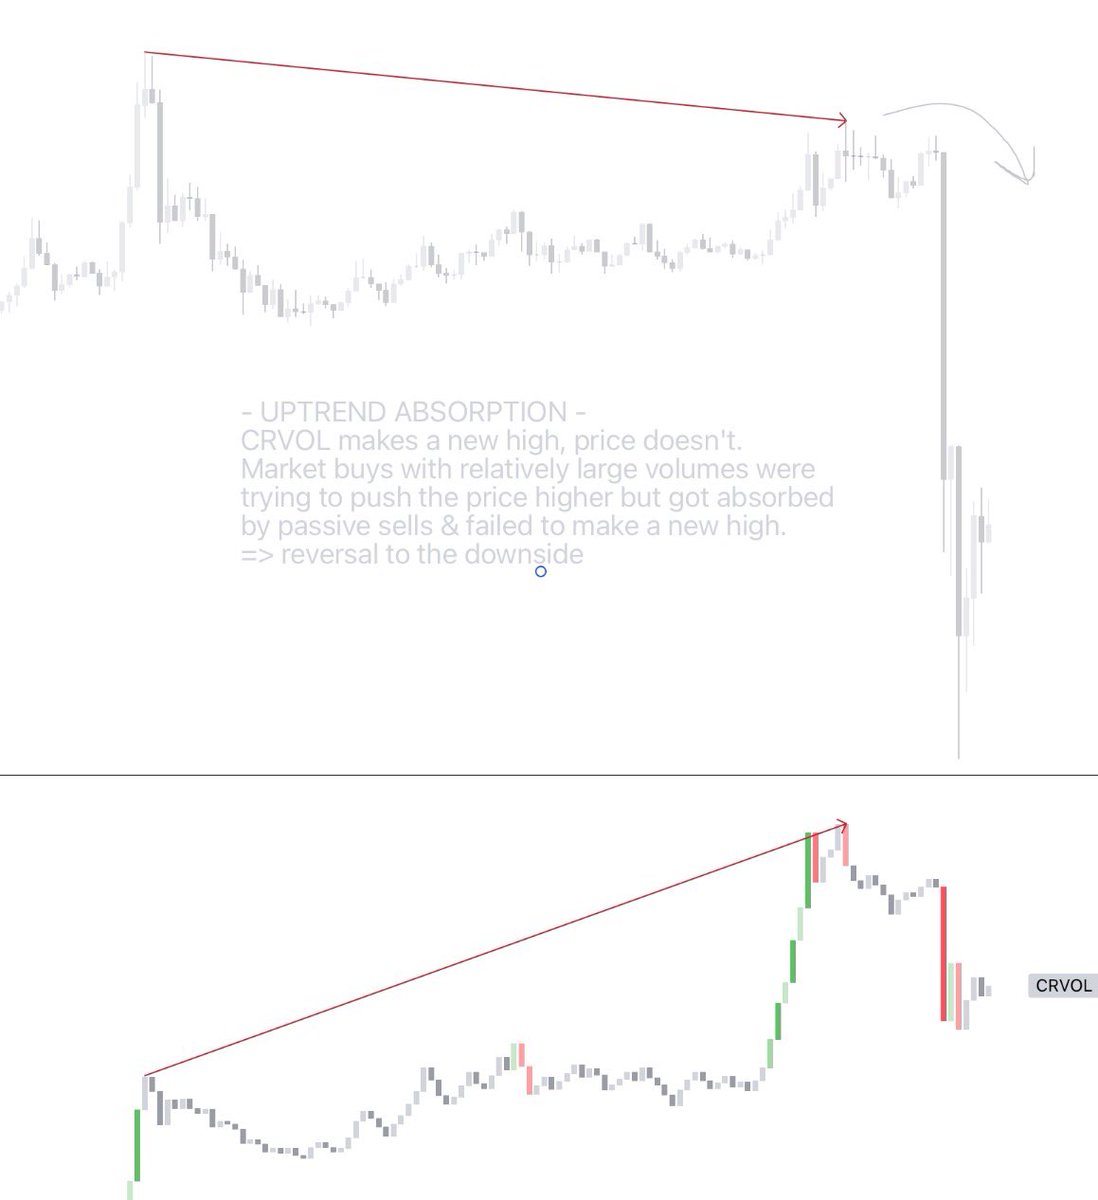
- Uptrend Absorption: CRVOL makes a new high but price doesn’t. This may indicate a relatively increased effort/pressure/aggressiveness from buys but no result in the form of a new high in price (eg. buys absorbed by limit sells).
Bullish Bias Divergences
- Downtrend Exhaustion: Price makes a new low but CRVOL doesn’t. This may indicate the relative lack of effort/pressure/aggressiveness from sells.
- Downtrend Absorption: CRVOL makes a new low but price doesn’t. This may indicate a relatively increased effort/pressure/aggressiveness from sells but no result in the form of a new low in price (eg. sells absorbed by limit buys).
The divergences between price and CRVOL can help you catch short-term reversals.
To keep this simple, I will use the terminology also used in eg. CVD analysis.
Bearish Bias Divergences
- Uptrend Exhaustion: Price makes a new high but CRVOL doesn’t. This may indicate the relative lack of effort/pressure/aggressiveness from buys.
- Uptrend Absorption: CRVOL makes a new high but price doesn’t. This may indicate a relatively increased effort/pressure/aggressiveness from buys but no result in the form of a new high in price (eg. buys absorbed by limit sells).
Bullish Bias Divergences
- Downtrend Exhaustion: Price makes a new low but CRVOL doesn’t. This may indicate the relative lack of effort/pressure/aggressiveness from sells.
- Downtrend Absorption: CRVOL makes a new low but price doesn’t. This may indicate a relatively increased effort/pressure/aggressiveness from sells but no result in the form of a new low in price (eg. sells absorbed by limit buys).
Examples
Here are a few examples on how these divergences can play out.
Keep in mind that no strategy/indicator is perfect. Do some backtesting and find your own edge to add to this strategy.
My preference is to use the indicator on timeframes below 1h (30m, 15m, 5m, 1m) but you might also find results on higher timeframes.
Join my Discord or Telegram if you have any questions.
- discord.gg
- t.me
Register on WOO X to get access to my unreleased indicators (submit a ticket in my Discord after registration).
- referral.woo.org
Loading suggestions...