


1/ MVRV Ratio
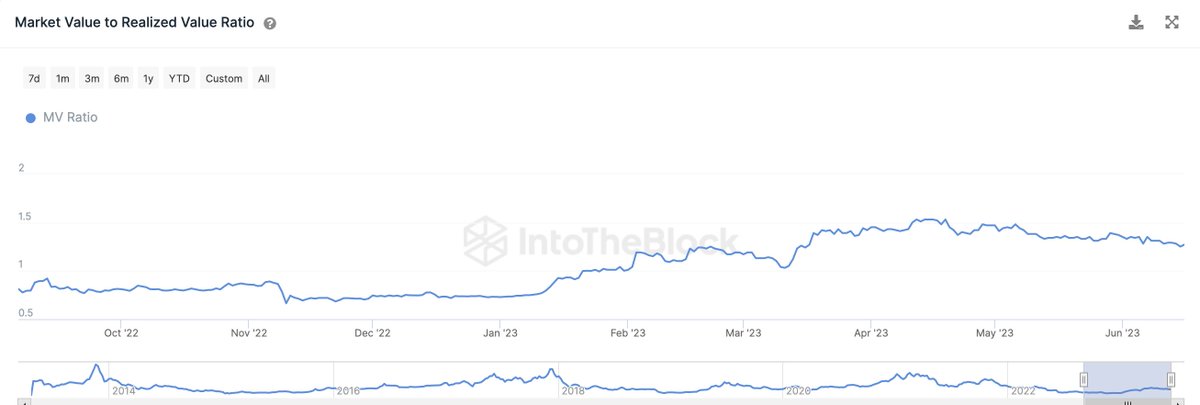
Market Value to Realized Value is being calculated comparing the current value of circulating supply of bitcoins with the acquisition cost of the circulating supply of bitcoins.
Market Value to Realized Value is being calculated comparing the current value of circulating supply of bitcoins with the acquisition cost of the circulating supply of bitcoins.
1.1/ Overview
✅ MVRV Value Above 3.5 indicates Bull Cycle Top.
✅ MVRV Value Below 0.80 Indicates Bear Cycle Bottom
✅ MVRV Value Above 1 Indicates People are HODLING Coins in Profits.
✅ MVRV Value Above 3.5 indicates Bull Cycle Top.
✅ MVRV Value Below 0.80 Indicates Bear Cycle Bottom
✅ MVRV Value Above 1 Indicates People are HODLING Coins in Profits.
1.2/ How to Use?
✅ In a bear cycle, Accumulate bitcoins whenever you see MVRV Value dropping below 1.
✅ In a bull cycle, Start selling bitcoins whenever you see MVRV Value rising above 3.
The Current MVRV Ratio for #Bitcoin = 1.27
Use @intotheblock to track MVRV Ratio.
✅ In a bear cycle, Accumulate bitcoins whenever you see MVRV Value dropping below 1.
✅ In a bull cycle, Start selling bitcoins whenever you see MVRV Value rising above 3.
The Current MVRV Ratio for #Bitcoin = 1.27
Use @intotheblock to track MVRV Ratio.
2/NVT Ratio
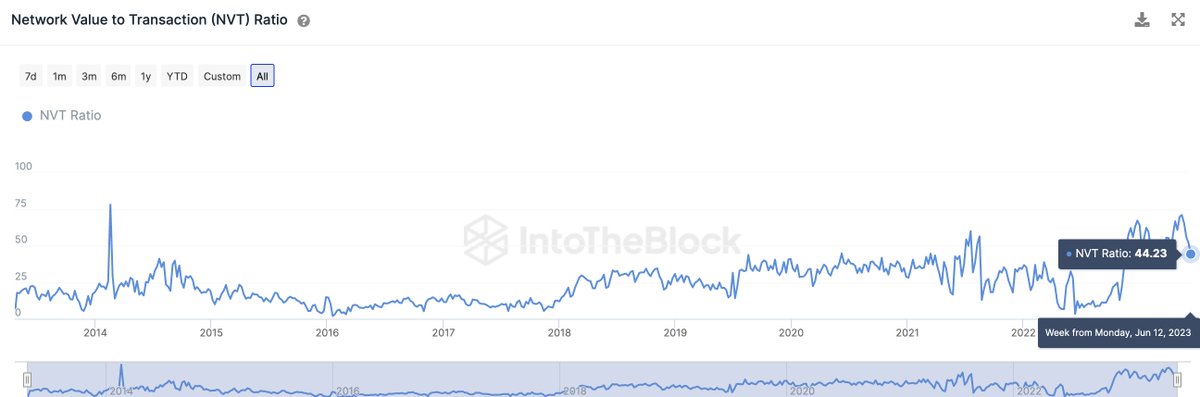
NVT Ratio is being calculated comparing the circulating market cap with transacted volume in USD, NVT Ratio could also be considered as PE Ratio for Bitcoin.
NVT Ratio is being calculated comparing the circulating market cap with transacted volume in USD, NVT Ratio could also be considered as PE Ratio for Bitcoin.
2.1/ Overview
✅ NVT Ratio above 40 Indicates Price is Overvalued.
✅ NVT Ratio below 40 Indicates Price is Undervalued.
✅ NVT Ratio above 40 Indicates Price is Overvalued.
✅ NVT Ratio below 40 Indicates Price is Undervalued.
2.2/ How to Use?
✅ In a bear cycle, Accumulate bitcoins whenever you see NVT Ratio dropping below 40.
✅ In a bull cycle, Start selling bitcoins whenever you see NVT Ratio rising above 40.
The Current NVT Ratio for #Bitcoin = 44.23
Use @intotheblock to track MVRV Ratio.
✅ In a bear cycle, Accumulate bitcoins whenever you see NVT Ratio dropping below 40.
✅ In a bull cycle, Start selling bitcoins whenever you see NVT Ratio rising above 40.
The Current NVT Ratio for #Bitcoin = 44.23
Use @intotheblock to track MVRV Ratio.
3/ Stock to Flow Ratio by PlanB
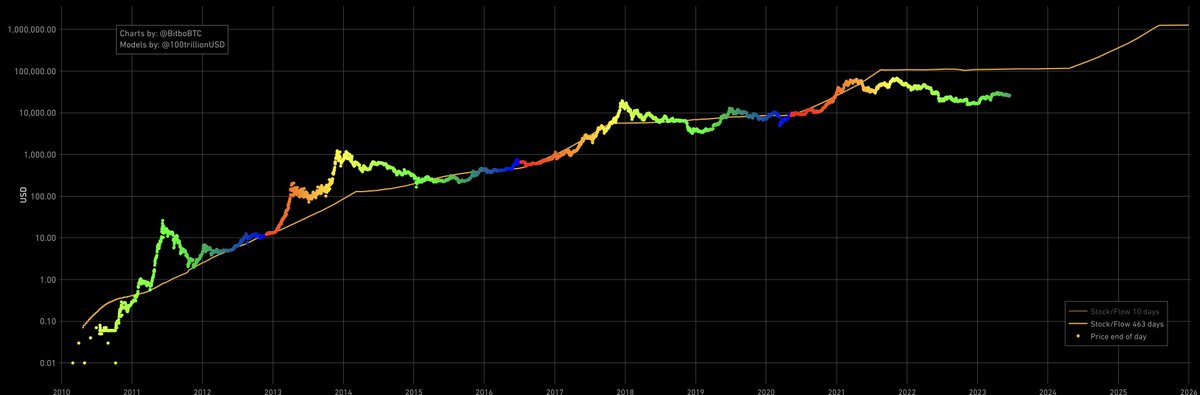
S2F Ratio is being calculated by dividing circulating supply with annual inflation of supply.
Stock to Flow Ratio predicted btc price target $100K in 2021, S2F ratio model failed in recent times but it has given accurate results in the past.
S2F Ratio is being calculated by dividing circulating supply with annual inflation of supply.
Stock to Flow Ratio predicted btc price target $100K in 2021, S2F ratio model failed in recent times but it has given accurate results in the past.
3.1/ Overview
✅ S2F Ratio above 50 Indicates Price is Overvalued.
✅ S2F Ratio below 50 Indicates Price is Undervalued.
✅ S2F Ratio above 50 Indicates Price is Overvalued.
✅ S2F Ratio below 50 Indicates Price is Undervalued.
3.2/ How to Use?
S2F Ratio only counts supply, and it's being calculated around scarcity of bitcoin as a commodity, The higher S2F Ratio always suggest that Bitcoin value should increase in the future.
The Current S2F Ratio of Bitcoin = 53.5
Track here: charts.bitbo.io
S2F Ratio only counts supply, and it's being calculated around scarcity of bitcoin as a commodity, The higher S2F Ratio always suggest that Bitcoin value should increase in the future.
The Current S2F Ratio of Bitcoin = 53.5
Track here: charts.bitbo.io
4/ Conclusion
These Onchain Indicators are relatively new when you compare them with Technical indicators, These indicators would evolve, and become more reliable with time.
MVRV is the most reliable indicator I found so far, it has been given some accurate results in the past
These Onchain Indicators are relatively new when you compare them with Technical indicators, These indicators would evolve, and become more reliable with time.
MVRV is the most reliable indicator I found so far, it has been given some accurate results in the past
5/ More Resources
I've covered bitcoin price models by @woonomic in a separate thread, which you should also check out.
I've covered bitcoin price models by @woonomic in a separate thread, which you should also check out.
That's all from this thread. 🔥
I hope you loved reading it.
If you want me to write more than please like, share and RT the tweet below 👇👇
I hope you loved reading it.
If you want me to write more than please like, share and RT the tweet below 👇👇
Tagging some of the best onchain minds in the space, follow them all.
@DefiIgnas
@thedefiedge
@woonomic
@ThorHartvigsen
@Dynamo_Patrick
@crypthoem
@TheDeFinvestor
@intotheblock
@DefiIgnas
@thedefiedge
@woonomic
@ThorHartvigsen
@Dynamo_Patrick
@crypthoem
@TheDeFinvestor
@intotheblock
Loading suggestions...