

A thread 🧵 on different Intraday trading Strategy.
Retweet ♻ if you find it useful.
Telegram: t.me
@kuttrapali26
@KommawarSwapnil
@caniravkaria @Stocktwit_IN
#StockMarketindia #trading #forex #stockmarket #Nifty #banknifty
Retweet ♻ if you find it useful.
Telegram: t.me
@kuttrapali26
@KommawarSwapnil
@caniravkaria @Stocktwit_IN
#StockMarketindia #trading #forex #stockmarket #Nifty #banknifty


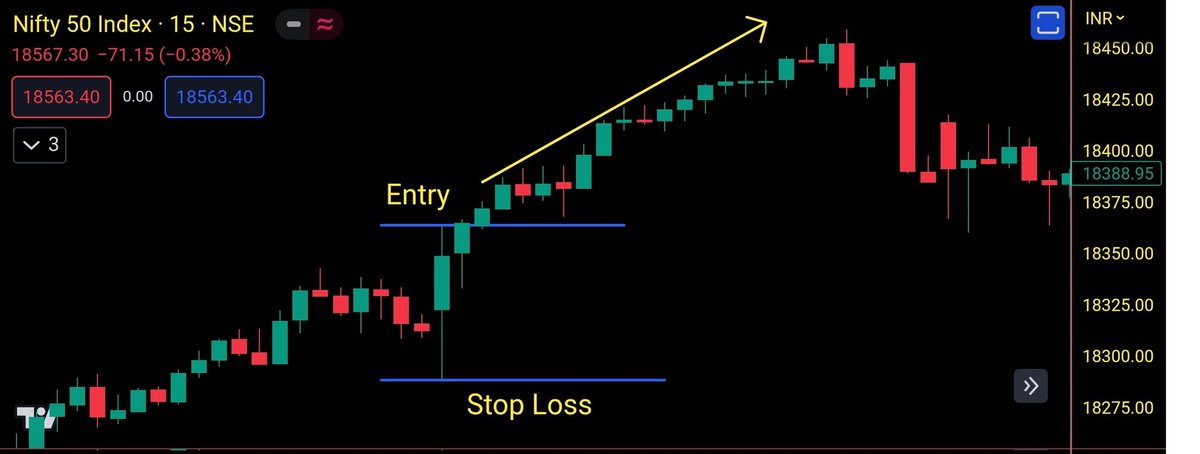
📍Opening Range breakout
Mark the first 15 min candle(9:15-9:30) high and low.
Enter long when a strong bullish 5 min candle close above first 15 min candle.
Stop loss can be place at the low of first 15 min candle or according to your risk appetite.
Mark the first 15 min candle(9:15-9:30) high and low.
Enter long when a strong bullish 5 min candle close above first 15 min candle.
Stop loss can be place at the low of first 15 min candle or according to your risk appetite.
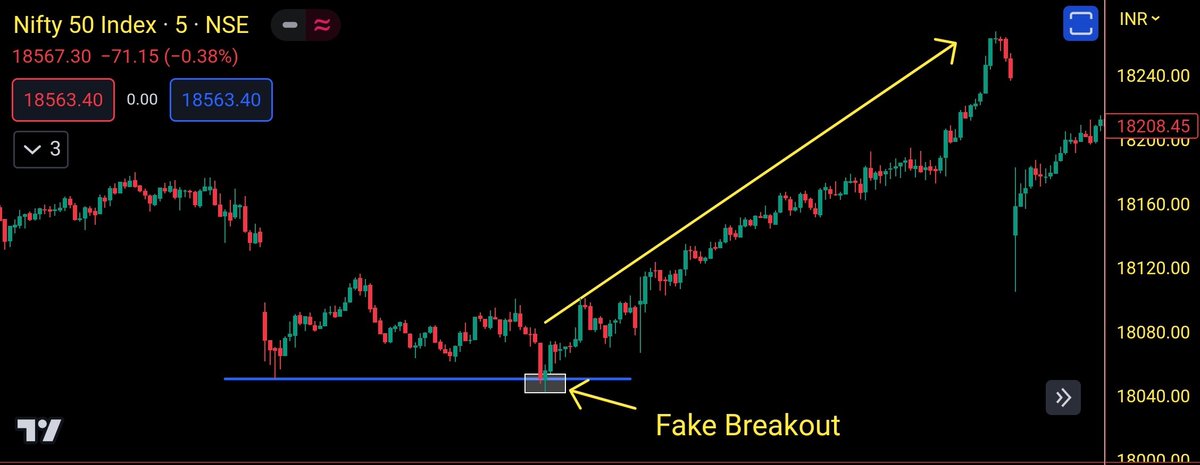
📍Fake breakout Strategy/Reversal Strategy
Mark the support and resistance on 15 min timeframe, then switch to 5 min timeframe. Then wait for a fake breakout candle on 5 min timeframe.
Target is usually the next resistance and stop loss is just below the fake breakout candle.
Mark the support and resistance on 15 min timeframe, then switch to 5 min timeframe. Then wait for a fake breakout candle on 5 min timeframe.
Target is usually the next resistance and stop loss is just below the fake breakout candle.
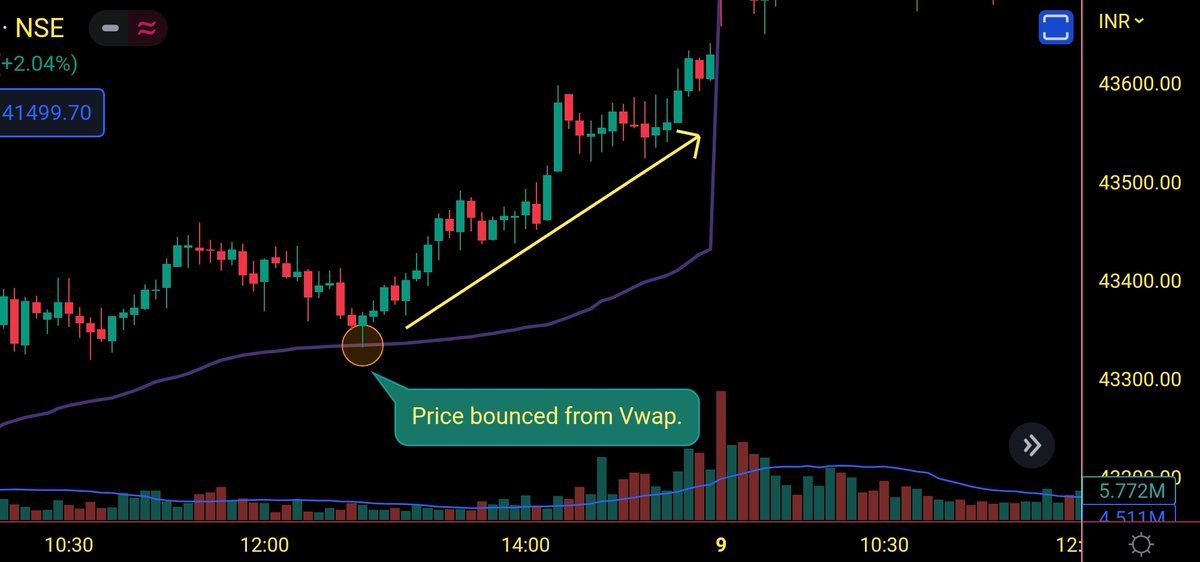
📍VWAP strategy
• Price Bounced from VWAP
Vwap acts as major intraday support. When the price bounce from vwap or near vwap and price action forms a bullish pattern, especially hammer or engulfing, then we can see an uptrend as depicted in the images below by the yellow arrow.
• Price Bounced from VWAP
Vwap acts as major intraday support. When the price bounce from vwap or near vwap and price action forms a bullish pattern, especially hammer or engulfing, then we can see an uptrend as depicted in the images below by the yellow arrow.
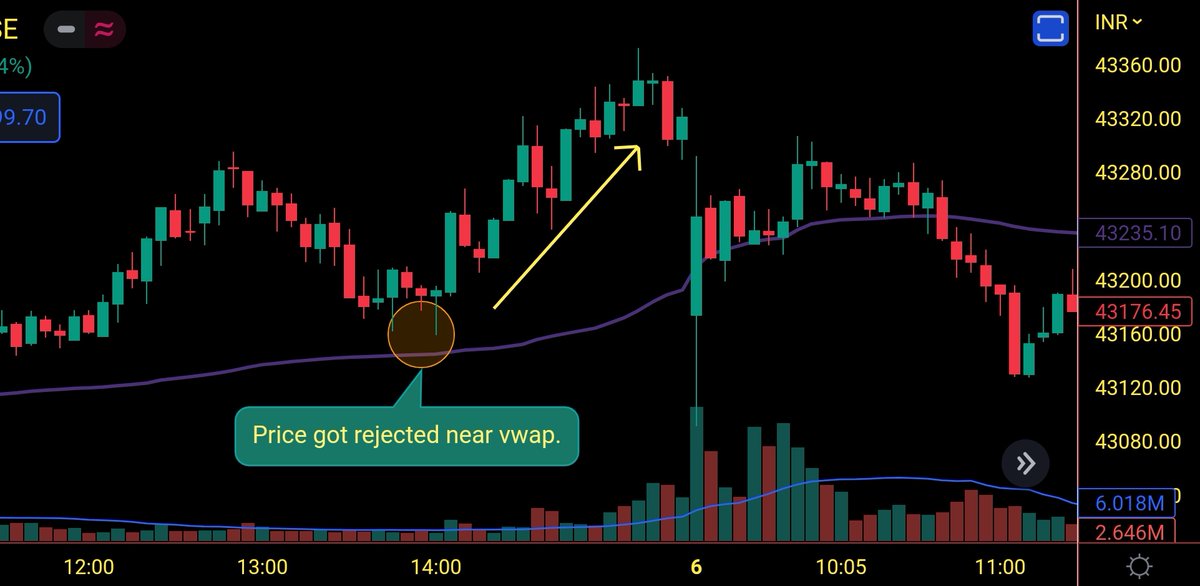
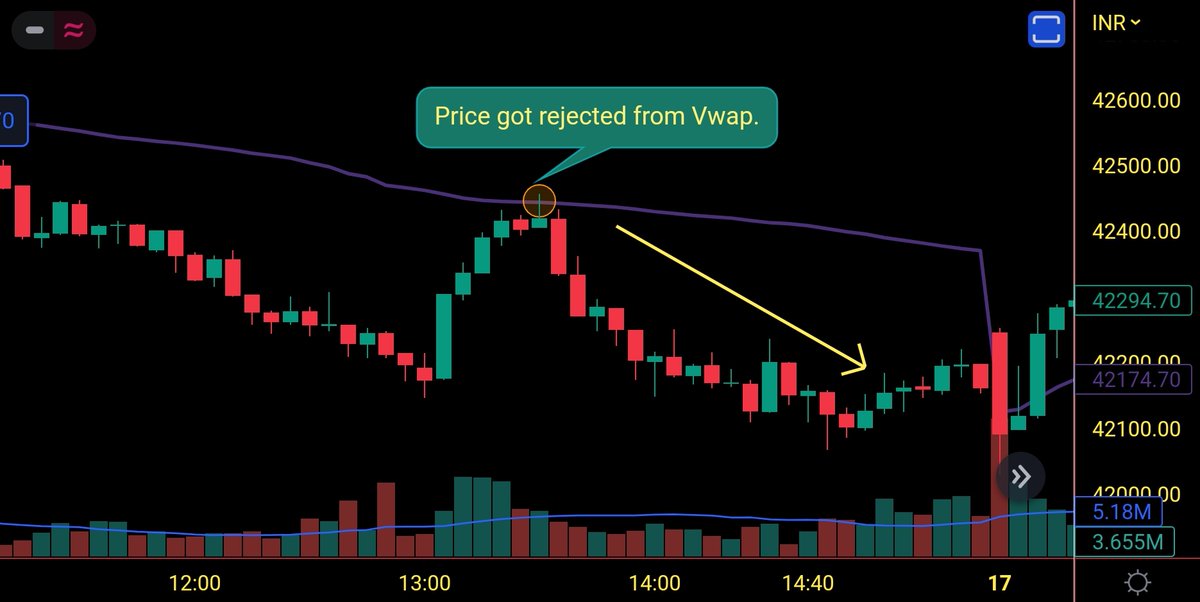
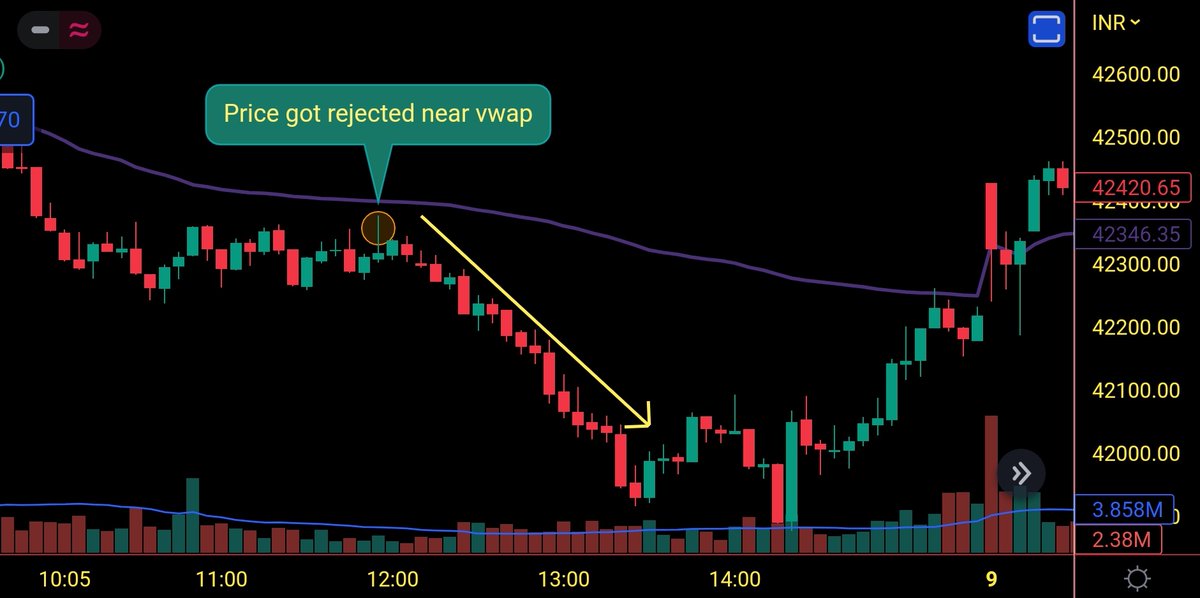
• Price rejected from VWAP
Vwap acts as major intraday resistance. When the price gets rejected from vwap or near vwap and price forms a bearish pattern especially a shooting star or bearish pin bar, then we can see a downtrend as depicted in the images below by a yellow arrow.
Vwap acts as major intraday resistance. When the price gets rejected from vwap or near vwap and price forms a bearish pattern especially a shooting star or bearish pin bar, then we can see a downtrend as depicted in the images below by a yellow arrow.
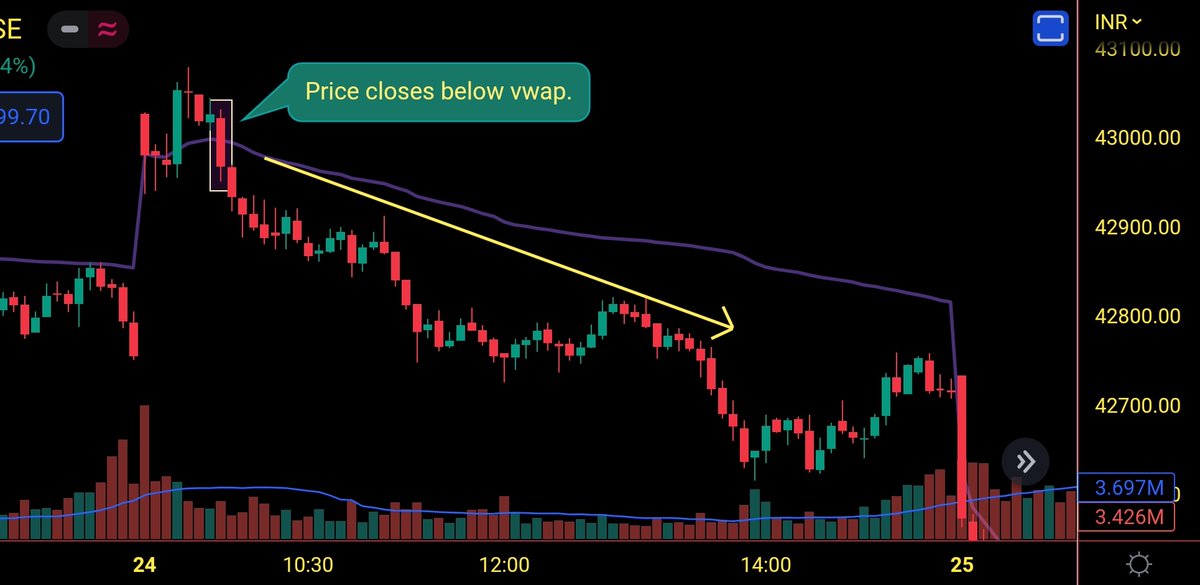
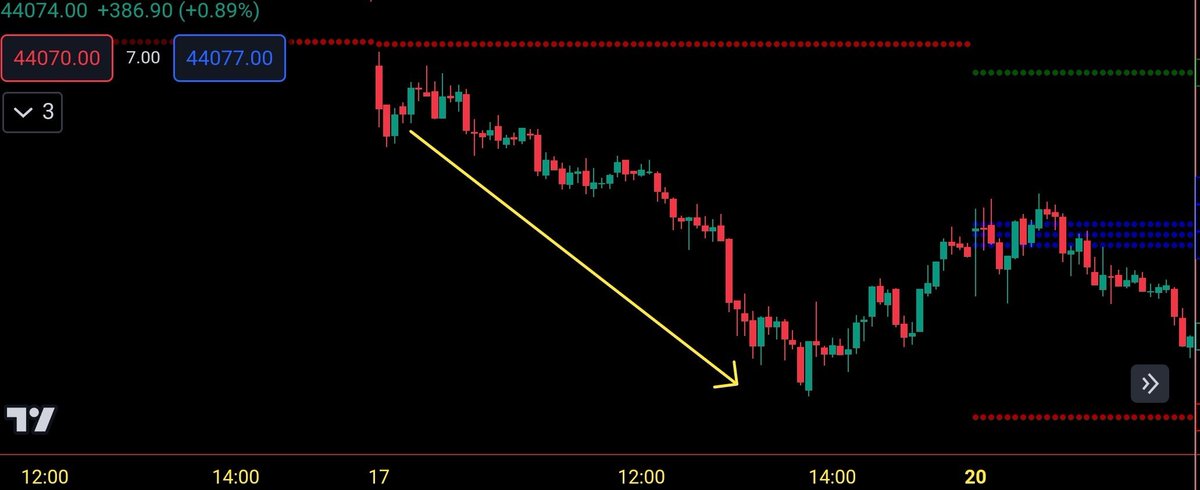
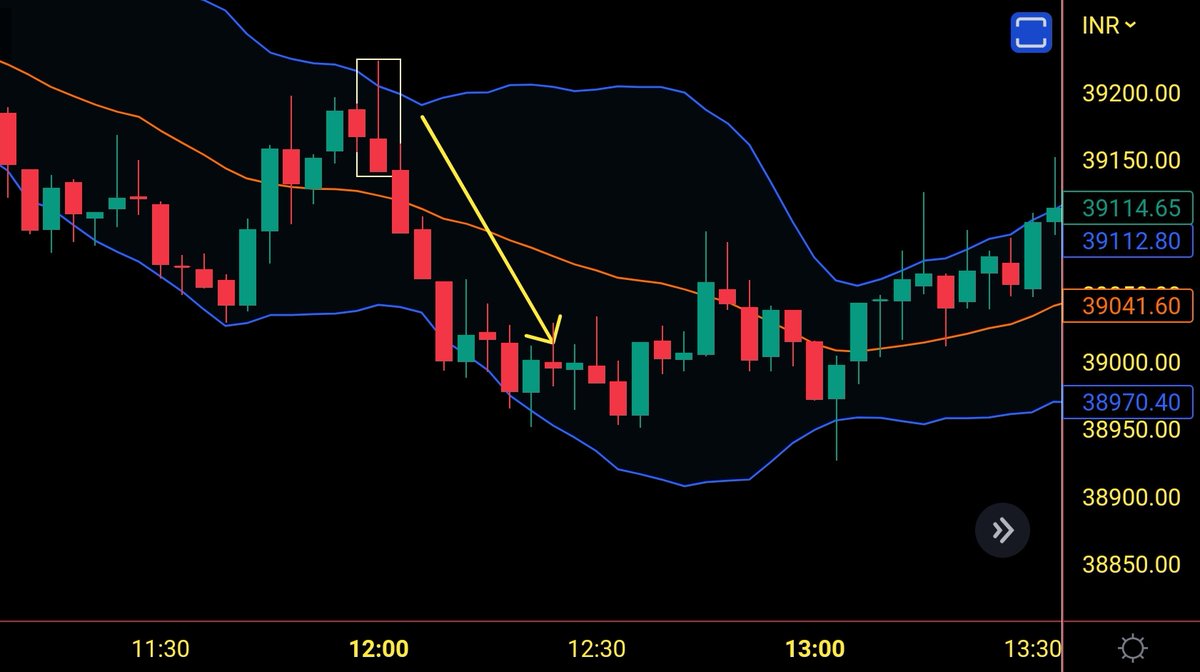
• Price closes below VWAP
Price closes below vwap is a bearish signal. When a 5 min strong candle (marked by a rectangle box) closes below vwap from above, then we can see a trending move downwards as depicted in the image below by the yellow arrow.
Price closes below vwap is a bearish signal. When a 5 min strong candle (marked by a rectangle box) closes below vwap from above, then we can see a trending move downwards as depicted in the image below by the yellow arrow.
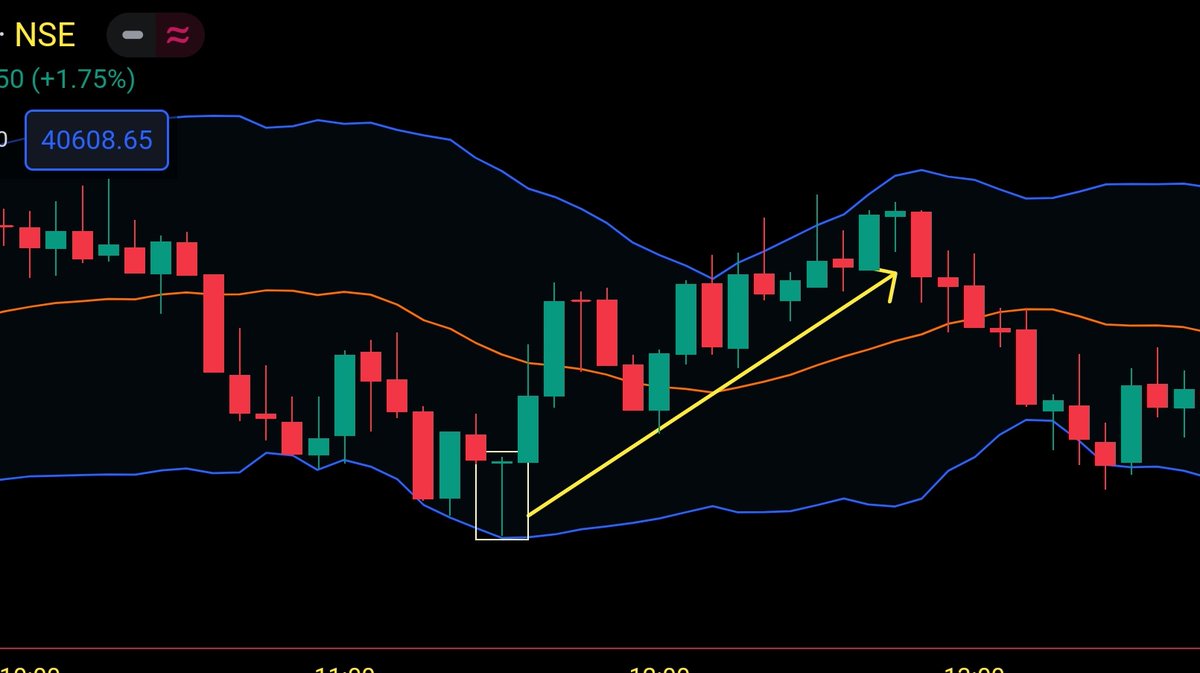
• Price closes above VWAP
Price closes above vwap is a bullish signal. When a 5 min strong candle (marked by a rectangle box) closes above vwap from below, then we can see a trending move upside as depicted in the image below by the yellow arrow.
Price closes above vwap is a bullish signal. When a 5 min strong candle (marked by a rectangle box) closes above vwap from below, then we can see a trending move upside as depicted in the image below by the yellow arrow.

📍Inside bar strategy
When an inside bar breakout is given with RSI above 60, we can see an upside move as shown in the image below by the yellow arrow
Entry: Mother candle high on closing basis
SL: Mother candle low on closing basis
Target: 1:2 and above
Accuracy-70%
When an inside bar breakout is given with RSI above 60, we can see an upside move as shown in the image below by the yellow arrow
Entry: Mother candle high on closing basis
SL: Mother candle low on closing basis
Target: 1:2 and above
Accuracy-70%

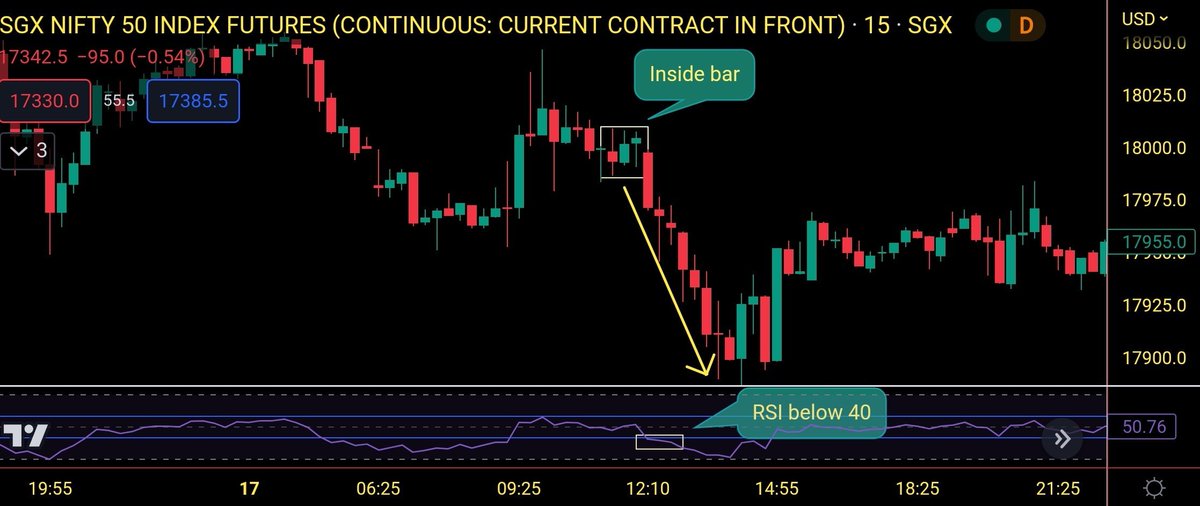
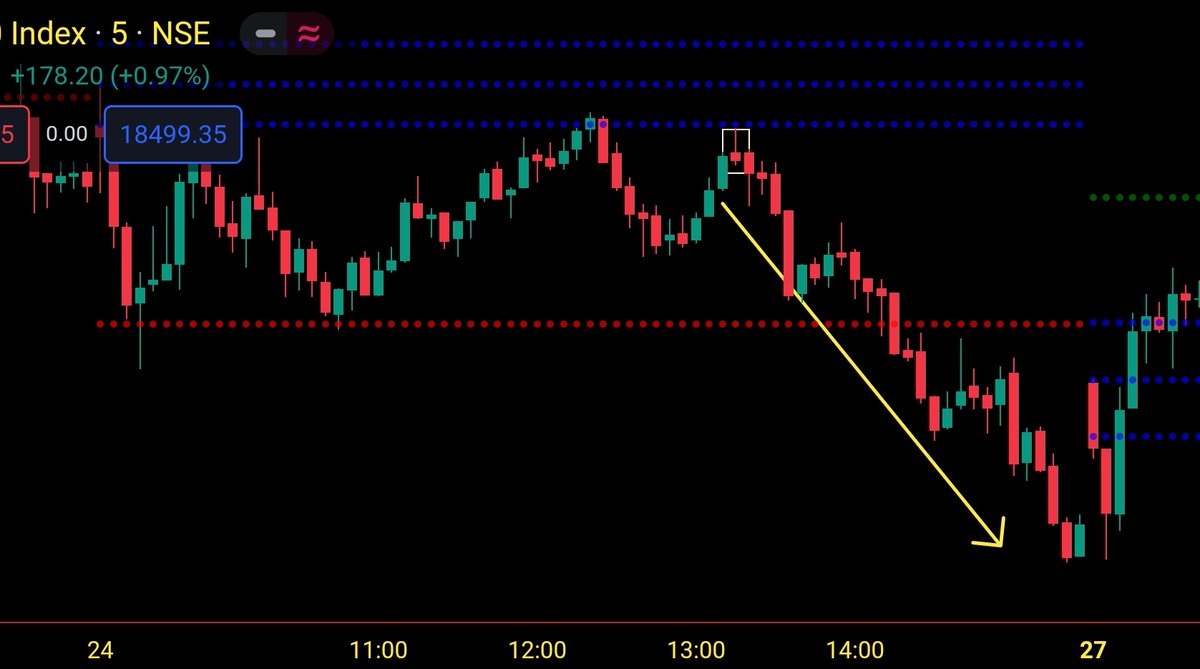
When an inside bar breakdown is given with RSI below 40, we can see a downside move as shown in the image below by the yellow arrow.
Timeframe- 15 min
Entry: Mother candle low on closing basis
SL: Mother candle high on closing basis
Target: 1:2 and above
Accuracy- 70-75%
Timeframe- 15 min
Entry: Mother candle low on closing basis
SL: Mother candle high on closing basis
Target: 1:2 and above
Accuracy- 70-75%
📍CPR opening strategy
👉 When price opens above R1 Or below S1
If the first three, 5-minute candles are above R1, then it will be a trending day upwards.
In the image below, we can see the first three, 5 mins candle is below R1(green line), and hence the market moved upwards.
👉 When price opens above R1 Or below S1
If the first three, 5-minute candles are above R1, then it will be a trending day upwards.
In the image below, we can see the first three, 5 mins candle is below R1(green line), and hence the market moved upwards.

If the first three, 5-minute candles are below S1, then it will be a trending day downwards.
In the image below, we can see the first three, 5-mins candle is below S1(red line), and hence the market moved downwards as marked by the yellow arrow.
In the image below, we can see the first three, 5-mins candle is below S1(red line), and hence the market moved downwards as marked by the yellow arrow.
📍Virgin CPR Intraday Strategy
When the price fails to touch the CPR even once in a session, then it is called Virgin CPR.
Virgin CPR acts as support and resistance.
If there is virgin CPR, then on the next day we can expect a reversal from the virgin CPR.
When the price fails to touch the CPR even once in a session, then it is called Virgin CPR.
Virgin CPR acts as support and resistance.
If there is virgin CPR, then on the next day we can expect a reversal from the virgin CPR.
In the below image, we can see the price didn't touch the CPR even once and on the next day price reversed from the virgin CPR and moved upside as marked by the yellow arrow.

📍CPR Reversal Strategy 1
If a hammer candle is formed at CPR or S1, we can expect a reversal.
In the image below, we can see a hammer candle at CPR and then immediately the market reversed and moved upside as marked by the yellow arrow.
If a hammer candle is formed at CPR or S1, we can expect a reversal.
In the image below, we can see a hammer candle at CPR and then immediately the market reversed and moved upside as marked by the yellow arrow.

📍CPR Reversal Strategy 2
If a shooting star candle is formed at CPR or R1, we can expect a reversal.
In the image below, we can see a shooting star candle near CPR and then immediately the market reversed and moved downside as marked by the yellow arrow.
If a shooting star candle is formed at CPR or R1, we can expect a reversal.
In the image below, we can see a shooting star candle near CPR and then immediately the market reversed and moved downside as marked by the yellow arrow.
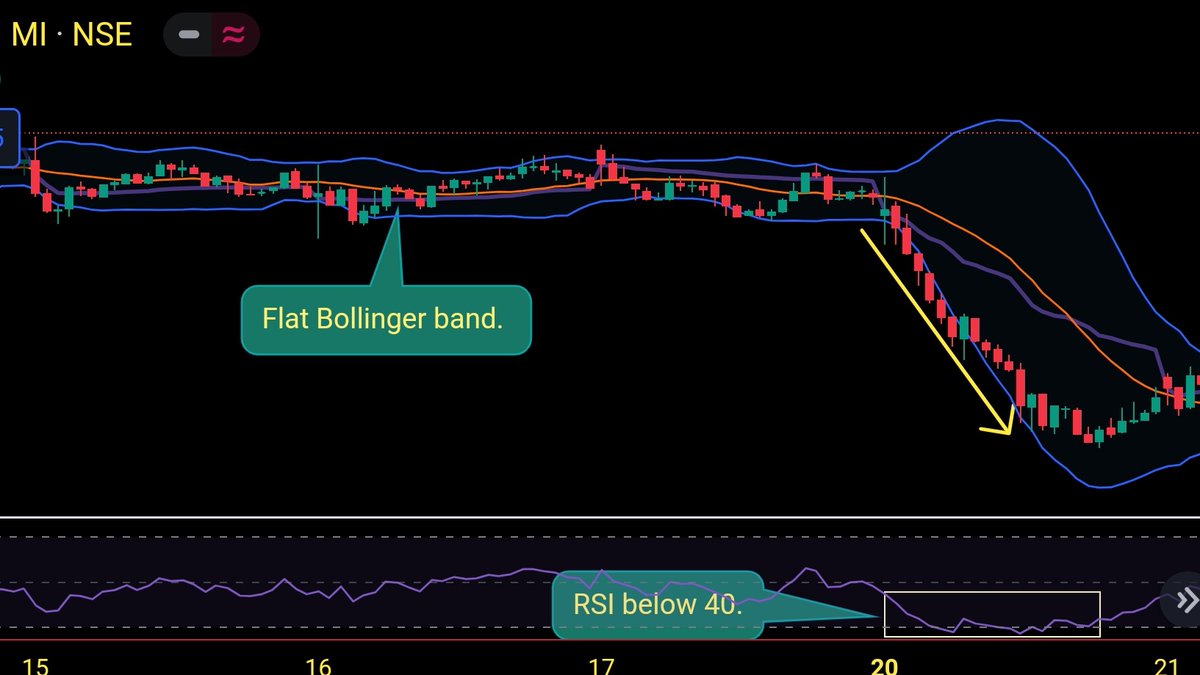
📍Bollinger Band + Vwap + RSI intraday strategy
When BB becomes flat, it indicates strong movement is coming. After upper BB breakout with RSI above 60 and candle open and close above Vwap, we can see a quick upside movement as shown in the image below by the yellow arrow.
When BB becomes flat, it indicates strong movement is coming. After upper BB breakout with RSI above 60 and candle open and close above Vwap, we can see a quick upside movement as shown in the image below by the yellow arrow.

In the image below, we can see a flat Bollinger band and after the Lower Bollinger breakout with RSI below 40 and the candle's open and close below vwap, we can see a downside move as marked by the yellow arrow.
Timeframe- 15 min
Timeframe- 15 min
📍Bollinger Band scalping strategy 1
In a sideways market, scalping can be done at the upper and lower Bollinger band for 30-40 points in bank nifty.
At upper Bollinger, buy PE and at lower Bollinger band, buy CE.
Timeframe- 3 mins.
In a sideways market, scalping can be done at the upper and lower Bollinger band for 30-40 points in bank nifty.
At upper Bollinger, buy PE and at lower Bollinger band, buy CE.
Timeframe- 3 mins.
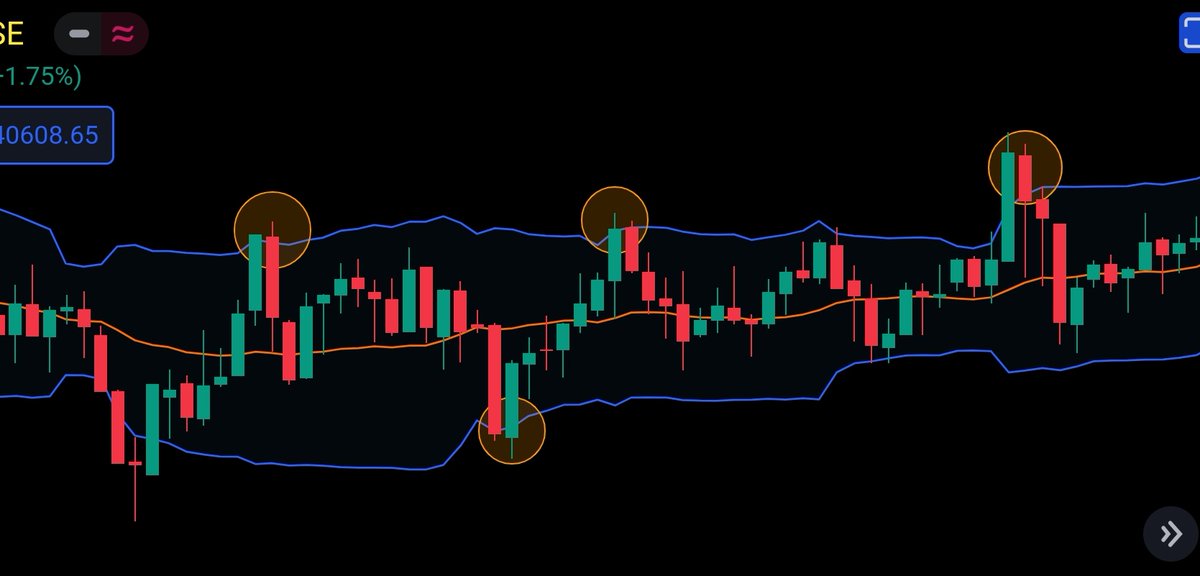
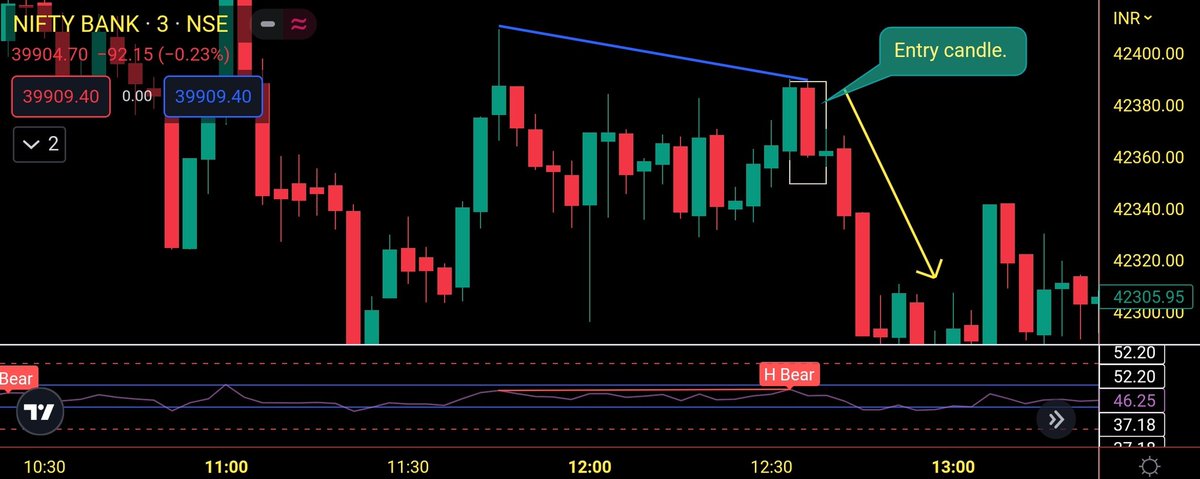
📍Bollinger band scalping strategy 2
When a shooting star candle forms at Upper Bollinger band, we can see a downward movement as shown in the below image.
Works better in a sideways market.
When a shooting star candle forms at Upper Bollinger band, we can see a downward movement as shown in the below image.
Works better in a sideways market.
📍Bollinger Band scalping strategy 3
When a hammer candle forms at the lower Bollinger band, we can see an upside movement as shown in the below image.
Works better in a sideways market.
When a hammer candle forms at the lower Bollinger band, we can see an upside movement as shown in the below image.
Works better in a sideways market.
📍RSI Intraday strategy
In the image below, we can see a bullish divergence, then the price rises as marked by the yellow arrow.
TF- 3/5 min
Target- 30-40 points.
SL- 20 points.
In the image below, we can see a bullish divergence, then the price rises as marked by the yellow arrow.
TF- 3/5 min
Target- 30-40 points.
SL- 20 points.

In the image below, we can see a bearish divergence, and then the price drops as marked by the yellow arrow.
TF- 3/5 min
Target- 30-40 points
SL- 20 points
TF- 3/5 min
Target- 30-40 points
SL- 20 points
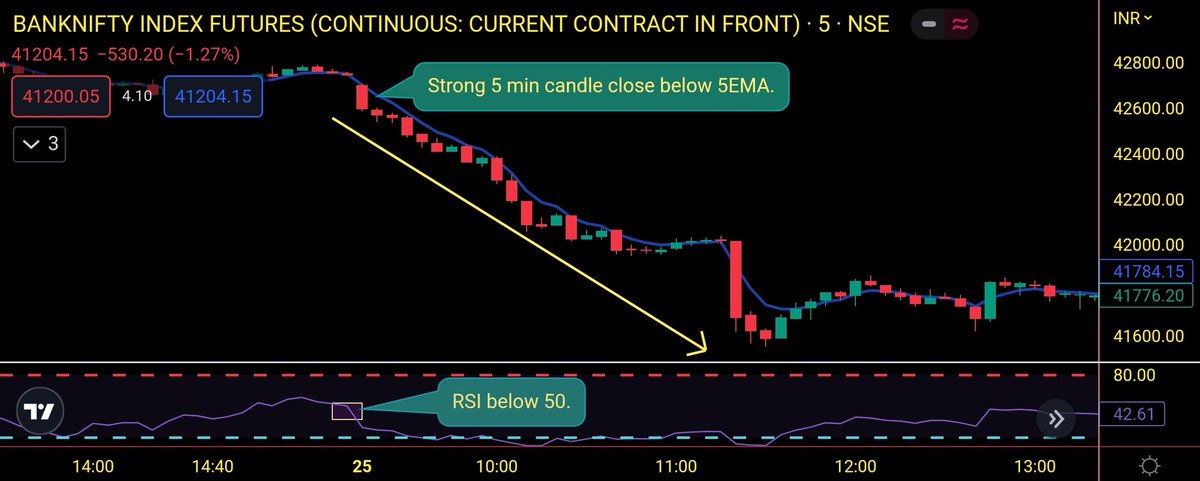
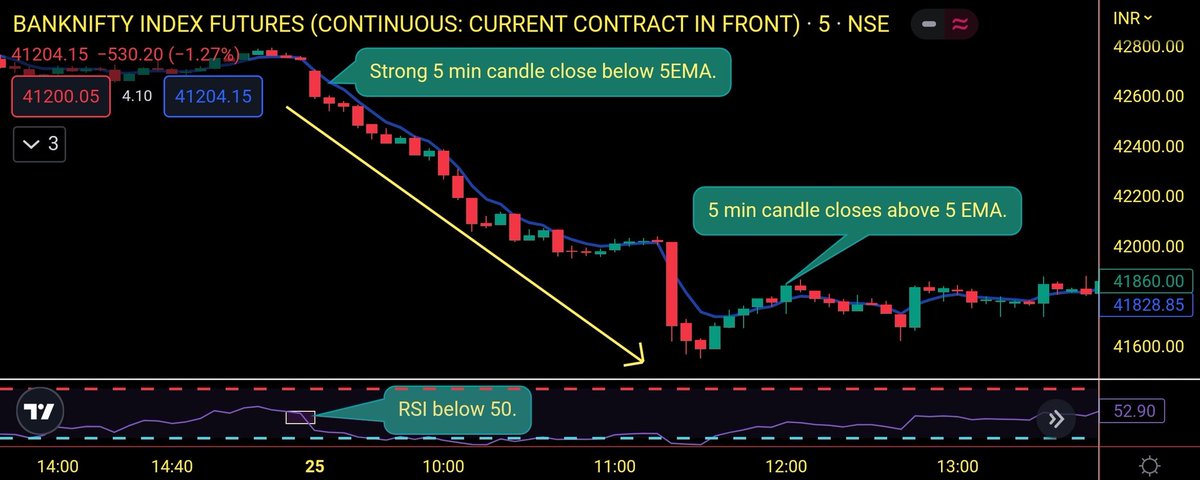
📍5 EMA Trading Strategy
When a 5 min candle closes below 5 EMA with RSI below 50, we can see a downside move as depicted in the below image(yellow arrow).
Exit when a 5 min candle closes above 5EMA as shown in the below image.
For entry, RSI should be below 50 and above 20.
When a 5 min candle closes below 5 EMA with RSI below 50, we can see a downside move as depicted in the below image(yellow arrow).
Exit when a 5 min candle closes above 5EMA as shown in the below image.
For entry, RSI should be below 50 and above 20.
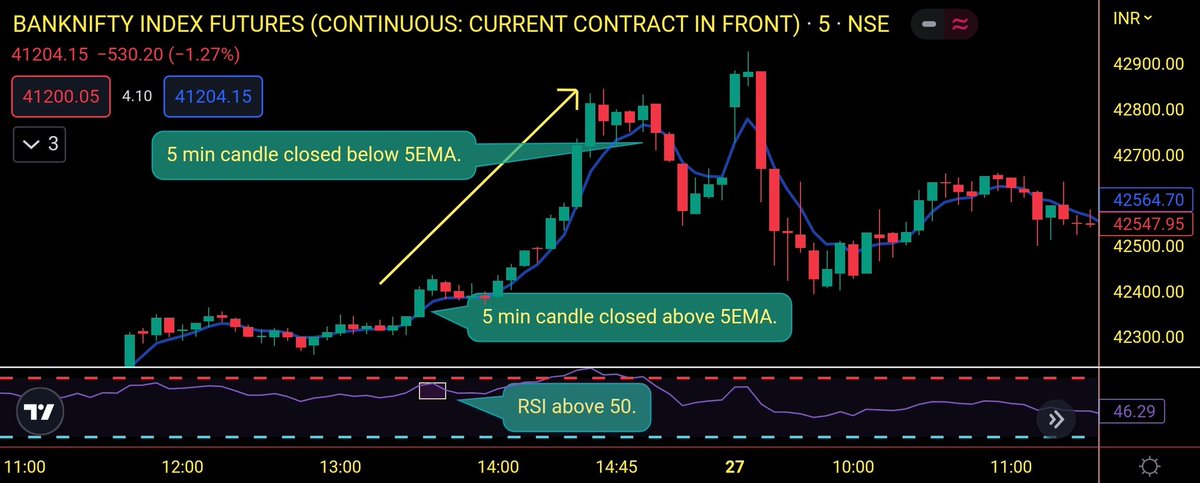
When a 5 min strong candle closes above 5 EMA(blue line) with RSI above 50, we can see a strong upside move as depicted in the below image(yellow arrow).
Exit when a 5 min candle closes below 5EMA as shown in the below image.
For entry, RSI should be above 50 and below 80.
Exit when a 5 min candle closes below 5EMA as shown in the below image.
For entry, RSI should be above 50 and below 80.

That's a wrap!
If you enjoyed this thread:
1. Follow @me__kaushik for more threads relating to trading.
2. RT the first tweet of this thread for maximum reach.
Also, join our telegram channel for live market updates.t.me
If you enjoyed this thread:
1. Follow @me__kaushik for more threads relating to trading.
2. RT the first tweet of this thread for maximum reach.
Also, join our telegram channel for live market updates.t.me
Loading suggestions...