

Tube Investments of India Limited (TII) is a leading manufacturer in India, specializing in a wide range of products for industries such as Automotive, Railway, Construction, Mining, Agriculture, etc.
Let's dive into the financials & stock performance!
A Thread 🧵
Let's dive into the financials & stock performance!
A Thread 🧵

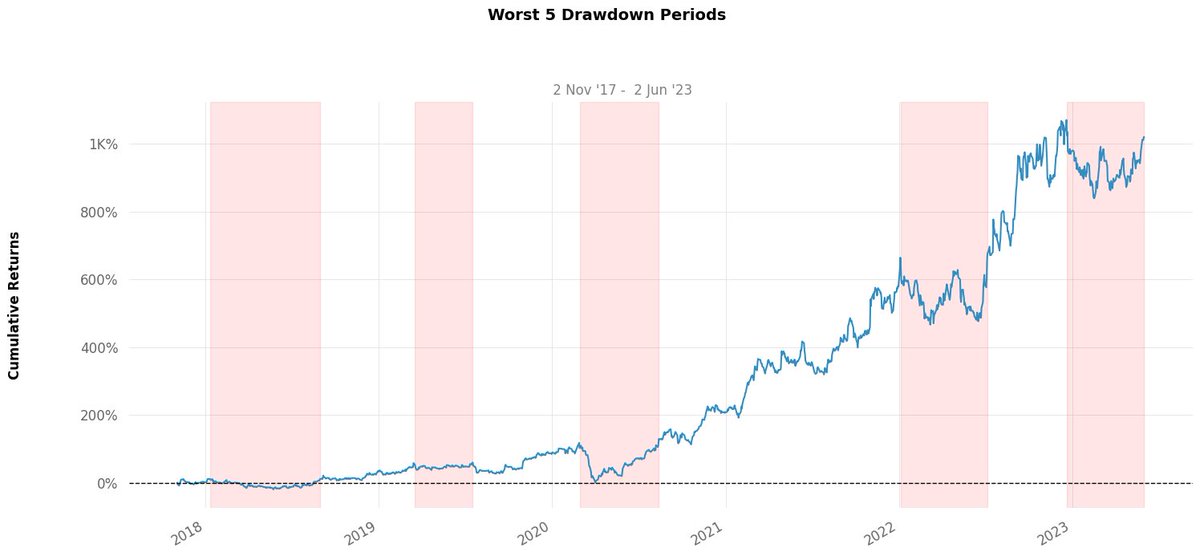
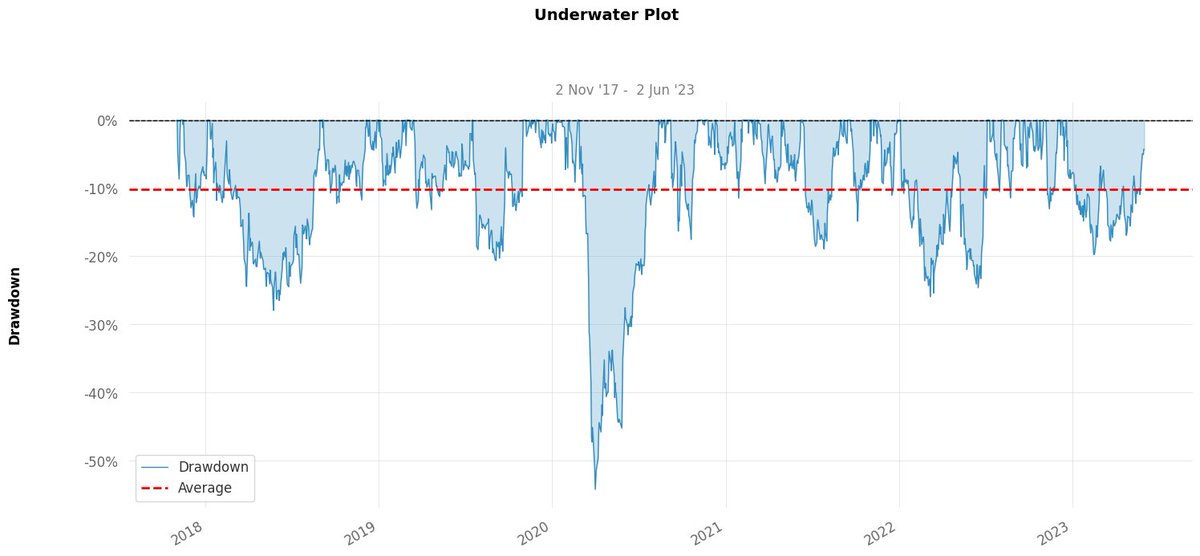
#TII price data points 📊
1. Stock has doubled every 2 years
2. Max DrawDown (DD) of -54.18% & an avg DD of -7.35%
3. Worst DD period lasted for 1 years, 2018-19
4. Stock was down <-10%, 16 times since 2017
5. Stock was down <-25%, 3 times since 2017
#StockMarketindia #stocks
1. Stock has doubled every 2 years
2. Max DrawDown (DD) of -54.18% & an avg DD of -7.35%
3. Worst DD period lasted for 1 years, 2018-19
4. Stock was down <-10%, 16 times since 2017
5. Stock was down <-25%, 3 times since 2017
#StockMarketindia #stocks
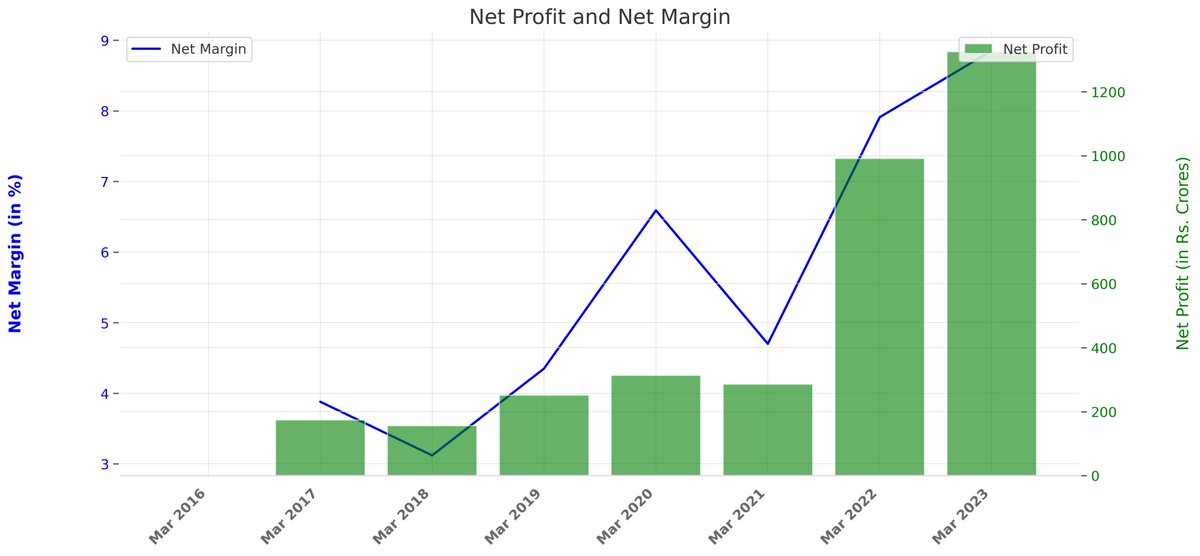
#TII Fundamental points based on last 5 years 📊
1. Compounded Sales Growth at 25%
2. Compounded Profit Growth at 41%
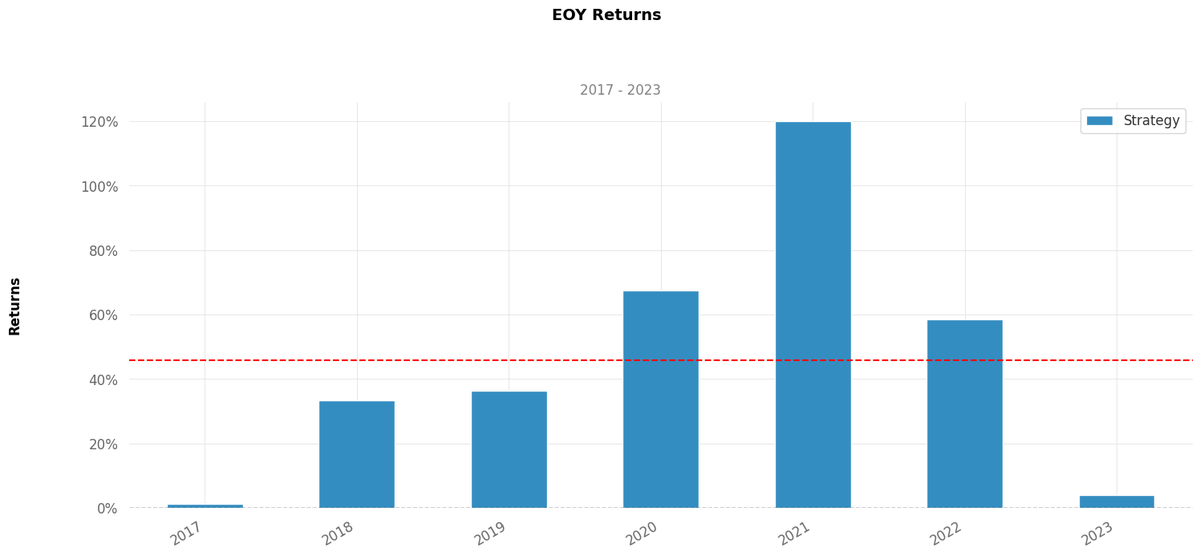
3. Stock Price CAGR at 67%
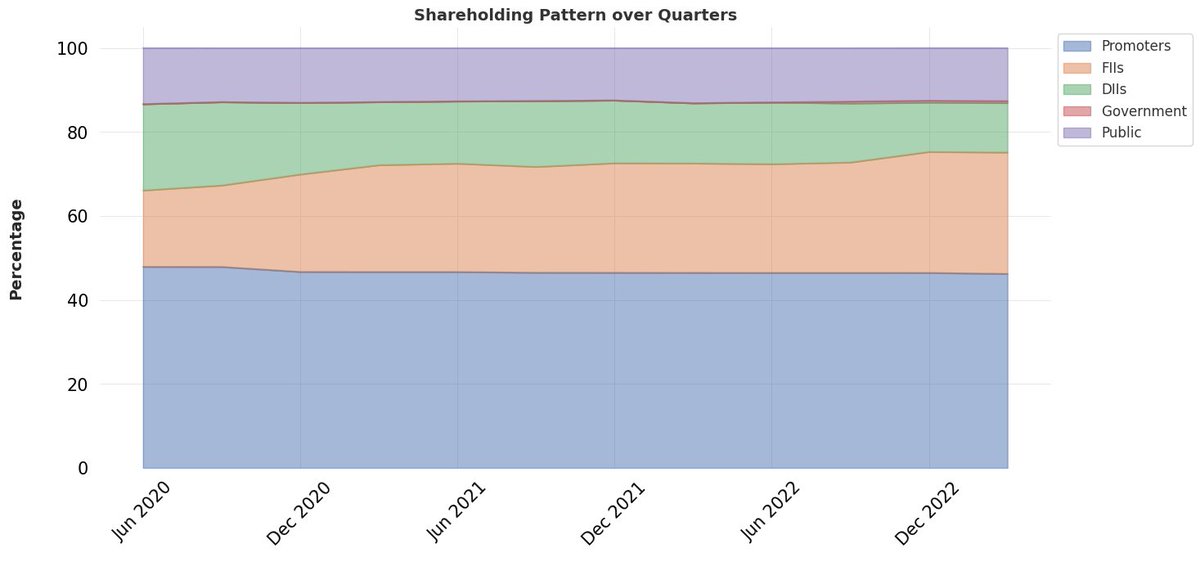
4. Promoter holding at 46.2%
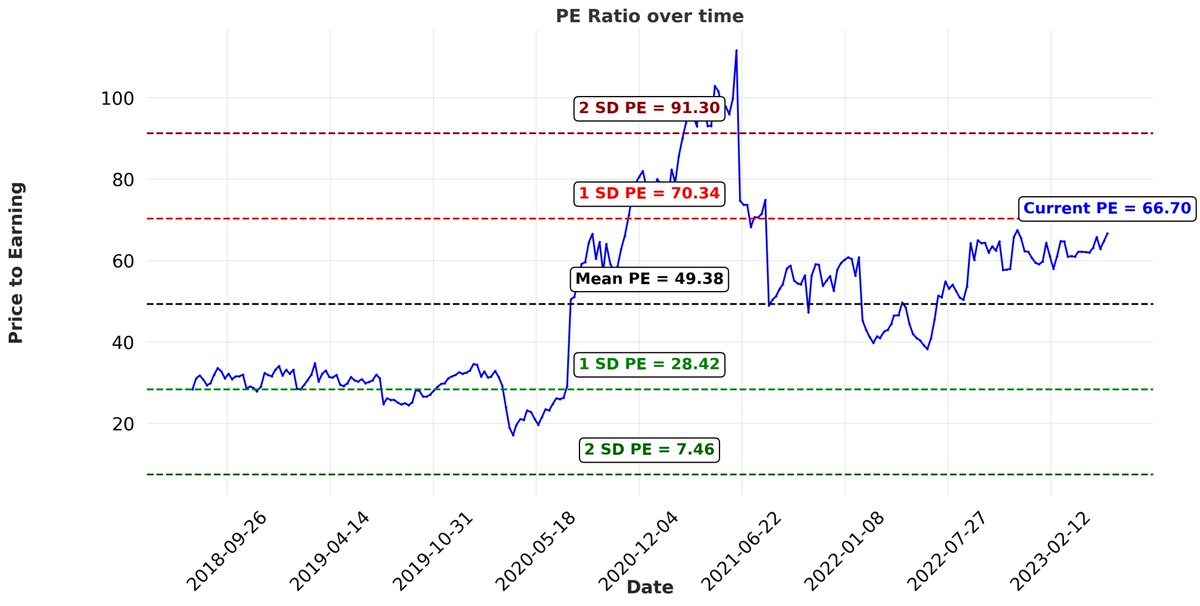
5. Current P/E ratio is 67.2, 5 Yrs PE is 29.9, while Industry PE is 25.6
#stockmarkets #stockstowatch
1. Compounded Sales Growth at 25%
2. Compounded Profit Growth at 41%
3. Stock Price CAGR at 67%
4. Promoter holding at 46.2%
5. Current P/E ratio is 67.2, 5 Yrs PE is 29.9, while Industry PE is 25.6
#stockmarkets #stockstowatch
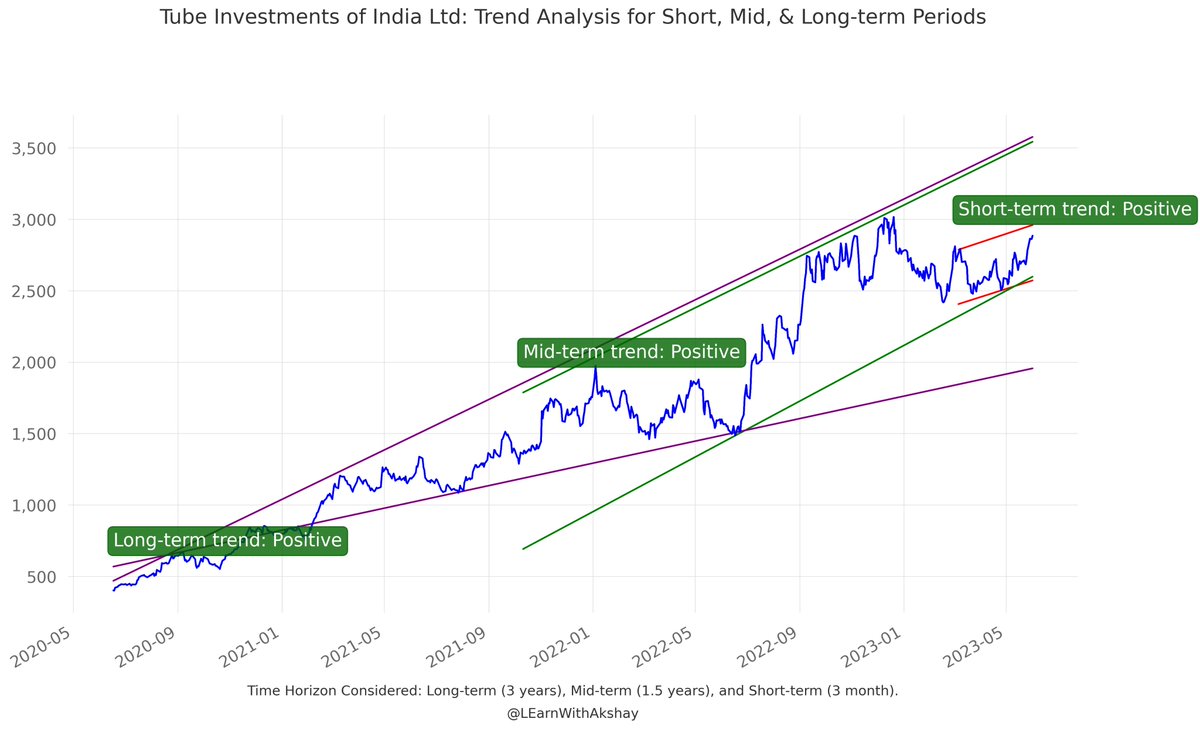
Curious about #Tube Investment India Ltd trend? 🤔
According to the trend analysis:
Long-term trend: Positive📈
Mid-term trend: Positive📈
Short-term trend: Positive📈
Check out the chart and decide for yourself. 👀
#TrendAnalysis #stockstowatch #StockMarketindia #nifty50
According to the trend analysis:
Long-term trend: Positive📈
Mid-term trend: Positive📈
Short-term trend: Positive📈
Check out the chart and decide for yourself. 👀
#TrendAnalysis #stockstowatch #StockMarketindia #nifty50
Considering #TII's growth trajectory, profitability, and market positioning over the past 5 years, it may be worth exploring as a potential investment opportunity.
However, before making any investment, make sure to do your research and always have a stop loss in place🛡️
However, before making any investment, make sure to do your research and always have a stop loss in place🛡️
Loading suggestions...