

I've worked in finance for over 5 years and have hosted 1,000s of hours of Twitter Spaces on trading.
If you want to trade stocks, you must understand these 10 chart patterns:
If you want to trade stocks, you must understand these 10 chart patterns:
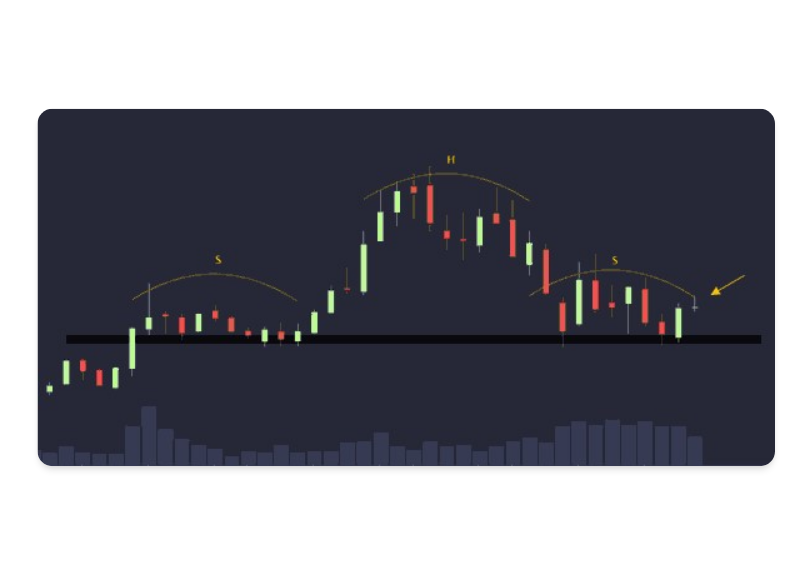
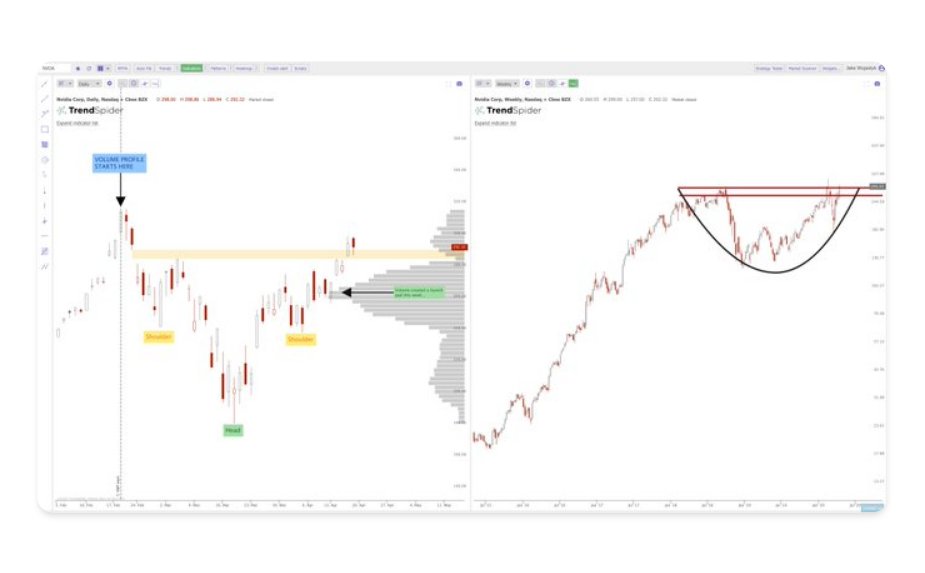
1. Head and Shoulders
This chart pattern has 3 peaks:
- Left shoulder
- Head
- Right shoulder
Each shoulder should be close in height and the head should be the highest peak and in the middle.
This pattern indicates a bullish trend is turning into a bearish one.
This chart pattern has 3 peaks:
- Left shoulder
- Head
- Right shoulder
Each shoulder should be close in height and the head should be the highest peak and in the middle.
This pattern indicates a bullish trend is turning into a bearish one.
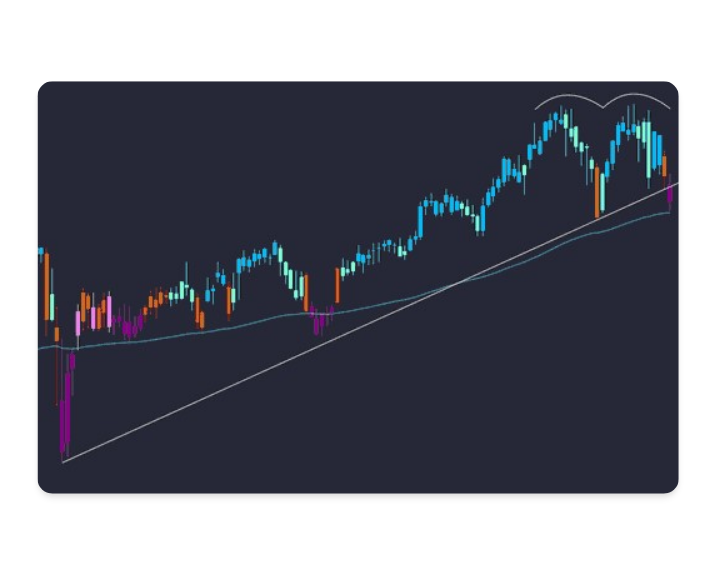
2. Double Top
A bearish pattern that forms when the price:
- Reaches 2 consecutive highs
- Has a moderate drop in the middle
- & the price drops below the support
If the price doesn't drop, it's a failed double-top pattern.
A bearish pattern that forms when the price:
- Reaches 2 consecutive highs
- Has a moderate drop in the middle
- & the price drops below the support
If the price doesn't drop, it's a failed double-top pattern.
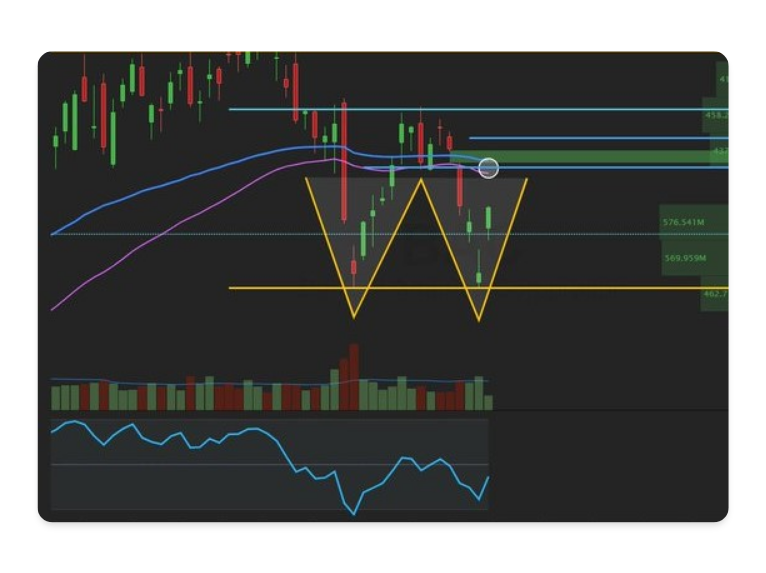
3. Double Bottom
This pattern is shaped like a "W" where the 2 bottoms are the support level.
Double bottoms usually happen after downtrends and signal a potential uptrend.
This chart pattern works best for analyzing medium - long-term market movements.
This pattern is shaped like a "W" where the 2 bottoms are the support level.
Double bottoms usually happen after downtrends and signal a potential uptrend.
This chart pattern works best for analyzing medium - long-term market movements.
4. Wedge
There are 2 types of wedges:
- Rising
- Falling
Prices tend to break out in the opposite direction of the wedge pattern.
So a rising wedge pattern = Bearish.
And a falling wedge pattern = Bullish.
It usually takes 1-7 weeks for this pattern to form.
There are 2 types of wedges:
- Rising
- Falling
Prices tend to break out in the opposite direction of the wedge pattern.
So a rising wedge pattern = Bearish.
And a falling wedge pattern = Bullish.
It usually takes 1-7 weeks for this pattern to form.
5. Cup & Handle
The part shaped like a "U" is the cup and the slight downward drift is the handle.
Cups with wider "U" shapes are more reliable than sharper "V" shapes.
This is a bullish pattern that takes 2-12 months to form.
The part shaped like a "U" is the cup and the slight downward drift is the handle.
Cups with wider "U" shapes are more reliable than sharper "V" shapes.
This is a bullish pattern that takes 2-12 months to form.
6. Pennant
This pattern occurs when a price consolidates before a breakout.
They tend to start with large trading volume (the flag pole) and followed by decreasing volume (the flag).
This pattern is best used in combination with other patterns.
This pattern occurs when a price consolidates before a breakout.
They tend to start with large trading volume (the flag pole) and followed by decreasing volume (the flag).
This pattern is best used in combination with other patterns.
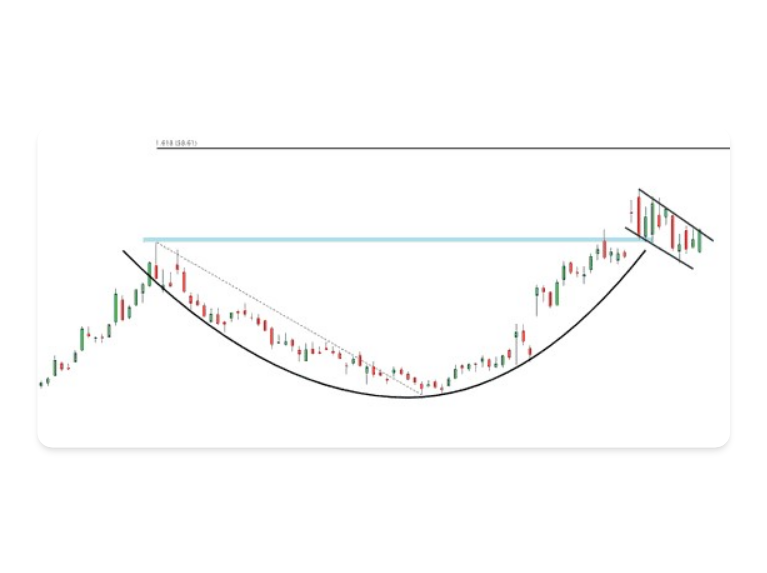
7. Rounding Bottom
This is a rare pattern that looks like a cup and handle, but without the handle.
It's made of 3 parts:
- Decline
- Bottom
- Incline
This bullish trend will usually take 2 weeks to 3 months to form.
This is a rare pattern that looks like a cup and handle, but without the handle.
It's made of 3 parts:
- Decline
- Bottom
- Incline
This bullish trend will usually take 2 weeks to 3 months to form.
8. Descending Triangle
This pattern is made with a falling trend line along falling highs and a flat trend line across a series of lows.
If the price falls under the flat trend line the price will likely keep falling.
Traders usually take a short position when this happens.
This pattern is made with a falling trend line along falling highs and a flat trend line across a series of lows.
If the price falls under the flat trend line the price will likely keep falling.
Traders usually take a short position when this happens.

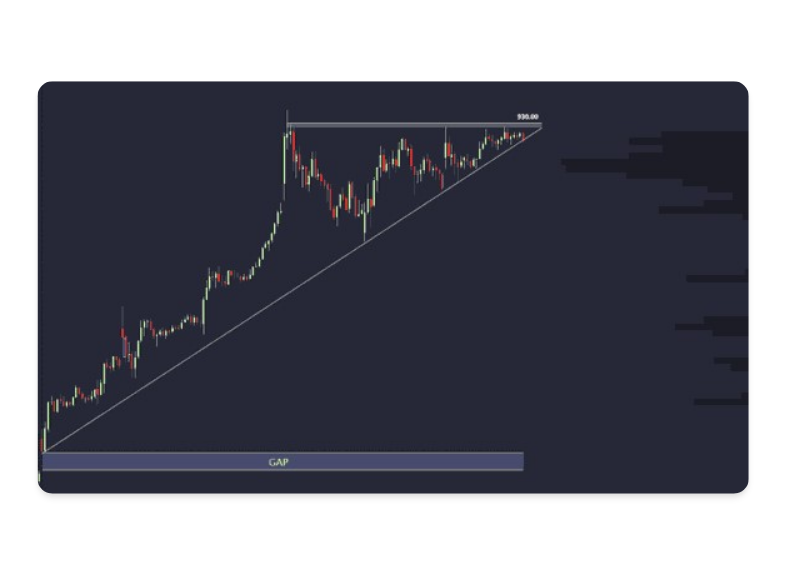
9. Ascending Triangle
This pattern is a flipped descending triangle.
A flat trend line at the 2 highest points and a rising line at the 2 lowest points.
If the price goes above the flat trend line, it's bullish.
If the price falls below the diagonal line, it's bearish.
This pattern is a flipped descending triangle.
A flat trend line at the 2 highest points and a rising line at the 2 lowest points.
If the price goes above the flat trend line, it's bullish.
If the price falls below the diagonal line, it's bearish.
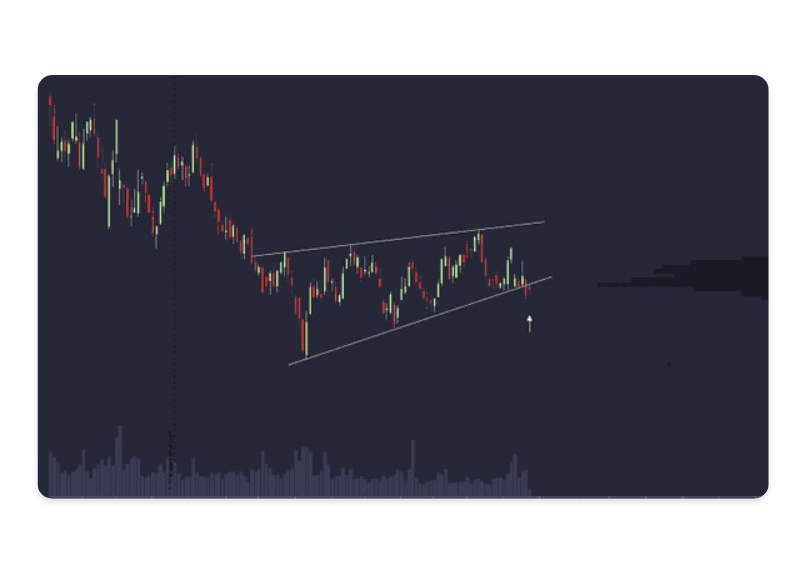
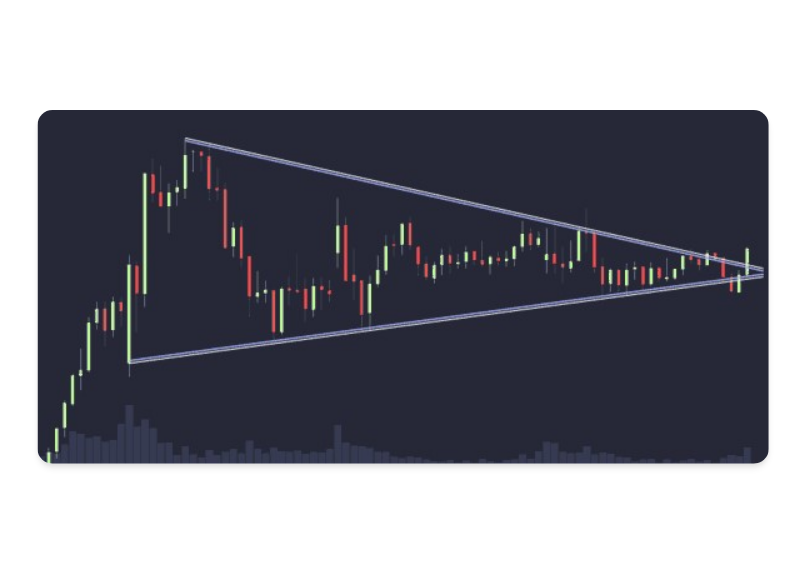
10. Symmetrical Triangle
This pattern is almost like a pennant except the trend lines have an equal slope and there's no "flag pole" present.
If the price rises above the top trendline, a breakout will occur.
If the price falls below the trendline, a breakdown will occur.
This pattern is almost like a pennant except the trend lines have an equal slope and there's no "flag pole" present.
If the price rises above the top trendline, a breakout will occur.
If the price falls below the trendline, a breakdown will occur.

Don't have time to tune into my 40+ hours of Twitter Spaces a week?
I share the best insights weekly with 9,700+ investors.
Sign up today 👇
marketmadness-newsletter.beehiiv.com
I share the best insights weekly with 9,700+ investors.
Sign up today 👇
marketmadness-newsletter.beehiiv.com

Loading suggestions...