

Ever wonder how to do a proper backtest in python?
Continuing our Jim Simons/Renaissance series, let’s look at the alpha of his FX strategy again. Was he really scoring a +5.0 Sharpe on every single currency??
“pip install bt” and let’s dive in
Continuing our Jim Simons/Renaissance series, let’s look at the alpha of his FX strategy again. Was he really scoring a +5.0 Sharpe on every single currency??
“pip install bt” and let’s dive in

Gregory Zuckerman’s “The Man Who Solved the Market” detailed how currency was one of Renaissance’s most successful “tradable effects” throughout the 80’s
According to Zuckerman, these FX trades were profitable almost EVERY SINGLE DAY
(even though the team was never certain **why** the trade worked)
According to Zuckerman, these FX trades were profitable almost EVERY SINGLE DAY
(even though the team was never certain **why** the trade worked)

For a full recap of this Deutche Mark momentum alpha, check out this thread
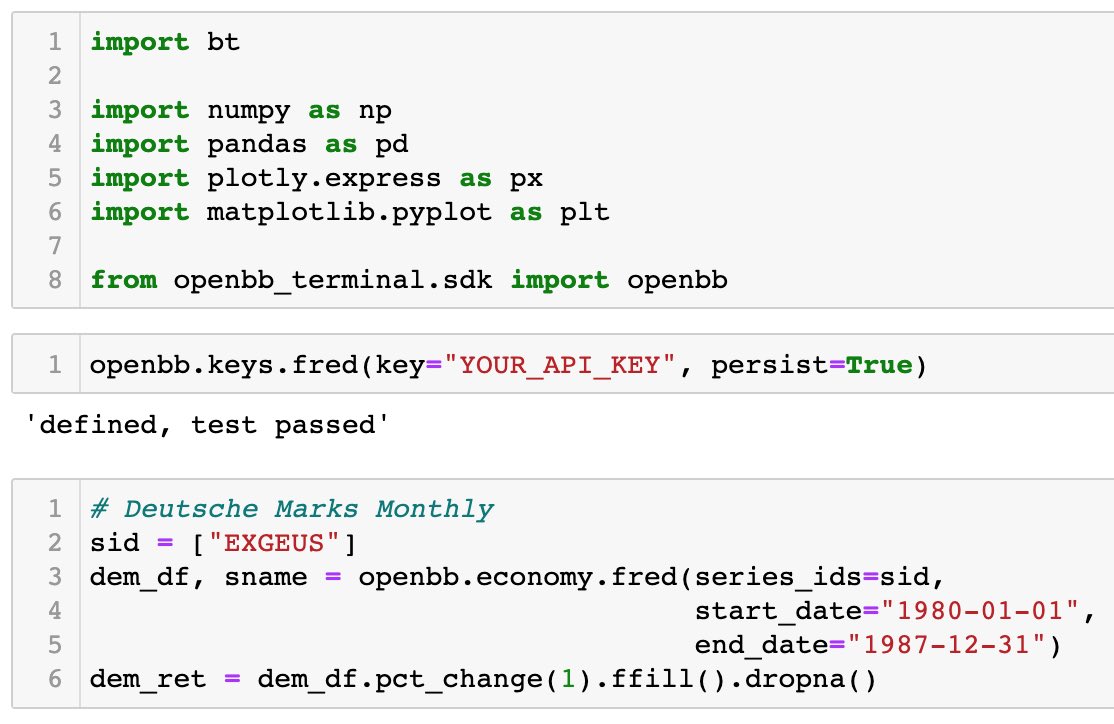
First, register a FRED API and use #openbb to download the Deutsche Mark rates back in the 80s
Since daily Deutsche Mark data has been discontinued at most data sources, we’ll just work with monthly data for now
Since daily Deutsche Mark data has been discontinued at most data sources, we’ll just work with monthly data for now
MA crossover is one way to trade momentum
I’m certain the early RenTech team had much more advanced algos AND better data (intraday vs. my monthly rates)
I’m probably underestimating their Sharpe by a long shot
#buildinpublic
investopedia.com
I’m certain the early RenTech team had much more advanced algos AND better data (intraday vs. my monthly rates)
I’m probably underestimating their Sharpe by a long shot
#buildinpublic
investopedia.com
We begin by constructing the long/short signal
The idea is to long when the short-term EMA (say, 3-month) crosses above the long-term EMA (9-month), short when below
The idea is to long when the short-term EMA (say, 3-month) crosses above the long-term EMA (9-month), short when below

The [bt] package allows you to combine diff trading logics.
Whether you need to rebalance, hedge, or inverse volatility weights, you can mix & match diff prebuilt [algos] objects
The building blocks are all there
Whether you need to rebalance, hedge, or inverse volatility weights, you can mix & match diff prebuilt [algos] objects
The building blocks are all there
![The [bt] package allows you to combine diff trading logics.
Whether you need to rebalance, hedge,...](https://pbs.twimg.com/media/FwAvdHUWYAYZ-jp.jpg)
Instead of coding your own backtest, the [bt] library has easy-to-use functions to test your strategy
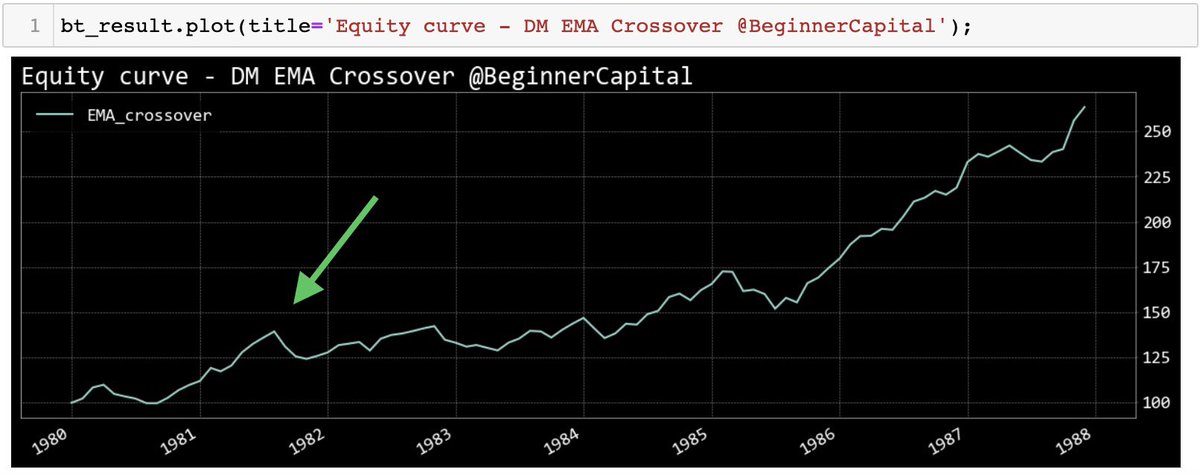
We’ll plot the equity curve. Notice how it just goes up? $100 in capital more than 2x over 8 years; an annual return of 13%!
And let’s not forget I’m still undershooting RenTech’s actual alpha with only monthly data
We’ll plot the equity curve. Notice how it just goes up? $100 in capital more than 2x over 8 years; an annual return of 13%!
And let’s not forget I’m still undershooting RenTech’s actual alpha with only monthly data
![Instead of coding your own backtest, the [bt] library has easy-to-use functions to test your strateg...](https://pbs.twimg.com/media/FwAvdYcXgAMKgy_.jpg)
So how good was this strategy?
The Sharpe ratio measures risk-adjusted relative returns. A Sharpe of 2.0 is very good and 3.0 is 🤌
Similarly, a 2.0 Sortino ratio is considered good
Where does this FX strategy land? A Sharpe of 5.8 and a Sortino of 11.5
Jesus…
The Sharpe ratio measures risk-adjusted relative returns. A Sharpe of 2.0 is very good and 3.0 is 🤌
Similarly, a 2.0 Sortino ratio is considered good
Where does this FX strategy land? A Sharpe of 5.8 and a Sortino of 11.5
Jesus…

Risk-wise, Calmar ratio is a commonly used drawdown metric. CALMAR = CAGR / Max Drawdown
Generally, Calmar larger than 3.0 is considered excellent
Despite the awesome equity curve, the Calmer ratio is only 1.09
Looks like the 12% drawdown in Jun ‘81 really hurt this ratio
Generally, Calmar larger than 3.0 is considered excellent
Despite the awesome equity curve, the Calmer ratio is only 1.09
Looks like the 12% drawdown in Jun ‘81 really hurt this ratio

The [bt] package prints and plots every possible return metric, risk ratio, etc. under the sun.
All in one line of code
If you want to play with it, check it out here pmorissette.github.io
All in one line of code
If you want to play with it, check it out here pmorissette.github.io
![The [bt] package prints and plots every possible return metric, risk ratio, etc. under the sun.
Al...](https://pbs.twimg.com/media/FwAveItXgAI2y_2.jpg)
![The [bt] package prints and plots every possible return metric, risk ratio, etc. under the sun.
Al...](https://pbs.twimg.com/media/FwAveIuX0AQnvpy.jpg)
![The [bt] package prints and plots every possible return metric, risk ratio, etc. under the sun.
Al...](https://pbs.twimg.com/media/FwAveItWcAIy3Nt.jpg)
Follow @beginnercapital for more quant + python content like this!
And for an even better alternative to [bt], check out this thread from @pyquantnews
I don’t have a referral code anymore but tell him I sent you!
And for an even better alternative to [bt], check out this thread from @pyquantnews
I don’t have a referral code anymore but tell him I sent you!
جاري تحميل الاقتراحات...