

Relative Strength Index (RSI) Indicator Explained With Formula.
Very Important Thread 🧵 On RSI Explained The ABCD Of RSI.
#stockmarket #investing
@nakulvibhor @kuttrapali26 @rachitpjain @Breakoutrade94 @Rishikesh_ADX @chartmojo @rohanshah619 @nirajtanna @Stocktwit_IN
Very Important Thread 🧵 On RSI Explained The ABCD Of RSI.
#stockmarket #investing
@nakulvibhor @kuttrapali26 @rachitpjain @Breakoutrade94 @Rishikesh_ADX @chartmojo @rohanshah619 @nirajtanna @Stocktwit_IN
What Is the Relative Strength Index (RSI)?
The relative strength index (RSI) is a momentum indicator used in technical analysis. RSI measures the speed and magnitude of a security's recent price changes to evaluate overvalued or undervalue conditions in the price of that securit.
The relative strength index (RSI) is a momentum indicator used in technical analysis. RSI measures the speed and magnitude of a security's recent price changes to evaluate overvalued or undervalue conditions in the price of that securit.
The RSI is displayed as an oscillator (a line graph) on a scale of zero to 100. The indicator was developed by J. Welles Wilder Jr. and introduced in his seminal 1978 book, New Concepts in Technical Trading Systems. The RSI can do more than point to overbought and oversold securi
It can also indicate securities that may be primed for a trend reversal or corrective pullback in price. It can signal when to buy and sell. Traditionally, an RSI reading of 70 or above indicates an overbought situation. A reading of 30 or below indicates an oversold condition.
KEY TAKEAWAYS
•The relative strength index (RSI) is a popular momentum oscillator introduced in 1978.
•The RSI provides technical traders with signals about bullish and bearish price momentum, and it is often plotted beneath the graph of an asset’s price.
•The relative strength index (RSI) is a popular momentum oscillator introduced in 1978.
•The RSI provides technical traders with signals about bullish and bearish price momentum, and it is often plotted beneath the graph of an asset’s price.
•An asset is usually considered overbought when the RSI is above 70 and oversold when it is below 30.
•The RSI line crossing below the overbought line or above oversold line is often seen by traders as a signal to buy or sell.
•The RSI works best in trading ranges rather than
•The RSI line crossing below the overbought line or above oversold line is often seen by traders as a signal to buy or sell.
•The RSI works best in trading ranges rather than
How the Relative Strength Index (RSI) Works
As a momentum indicator, the relative strength index compares a security's strength on days when prices go up to its strength on days when prices go down.
As a momentum indicator, the relative strength index compares a security's strength on days when prices go up to its strength on days when prices go down.
down. Relating the result of this comparison to price action can give traders an idea of how a security may perform. The RSI, used in conjunction with other technical indicators, can help traders make better-informed trading decisions
Calculating RSI
The RSI uses a two-part calculation that starts with the following formula:
The RSI uses a two-part calculation that starts with the following formula:

The average gain or loss used in this calculation is the average percentage gain or loss during a look-back period. The formula uses a positive value for the average loss. Periods with price losses are counted as zero in the calculations of average gain.
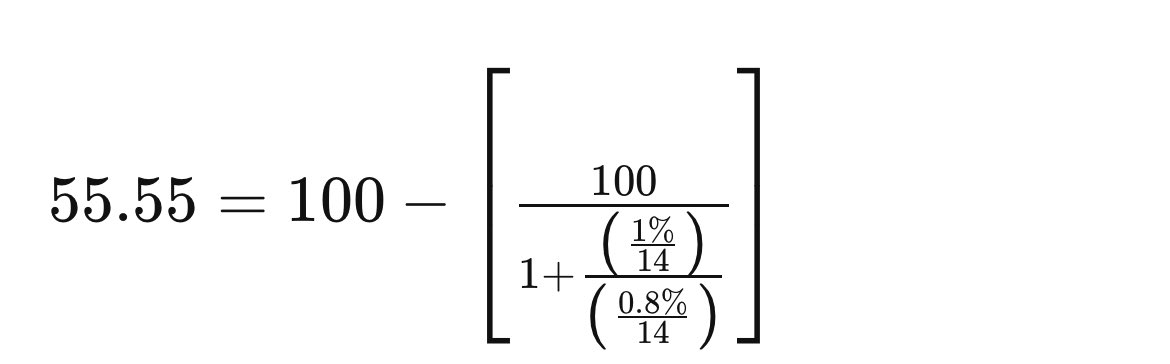
The standard number of periods used to calculate the initial RSI value is 14. For example, imagine the market closed higher seven out of the past 14 days with an average gain of 1%.
The first calculation for the RSI would look like the following expanded calculation
The first calculation for the RSI would look like the following expanded calculation
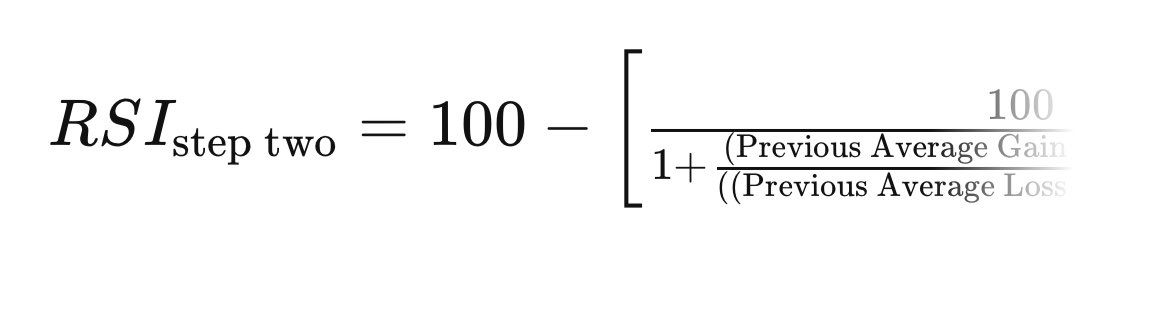
Once there are 14 periods of data available, the second calculation can be done. Its purpose is to smooth the results so that the RSI only nears 100 or zero in a strongly trending market
Plotting RSI
After the RSI is calculated, the RSI indicator can be plotted beneath an asset’s price chart, as shown below. The RSI will rise as the number and size of up days increase. It will fall as the number and size of down days increase.
After the RSI is calculated, the RSI indicator can be plotted beneath an asset’s price chart, as shown below. The RSI will rise as the number and size of up days increase. It will fall as the number and size of down days increase.
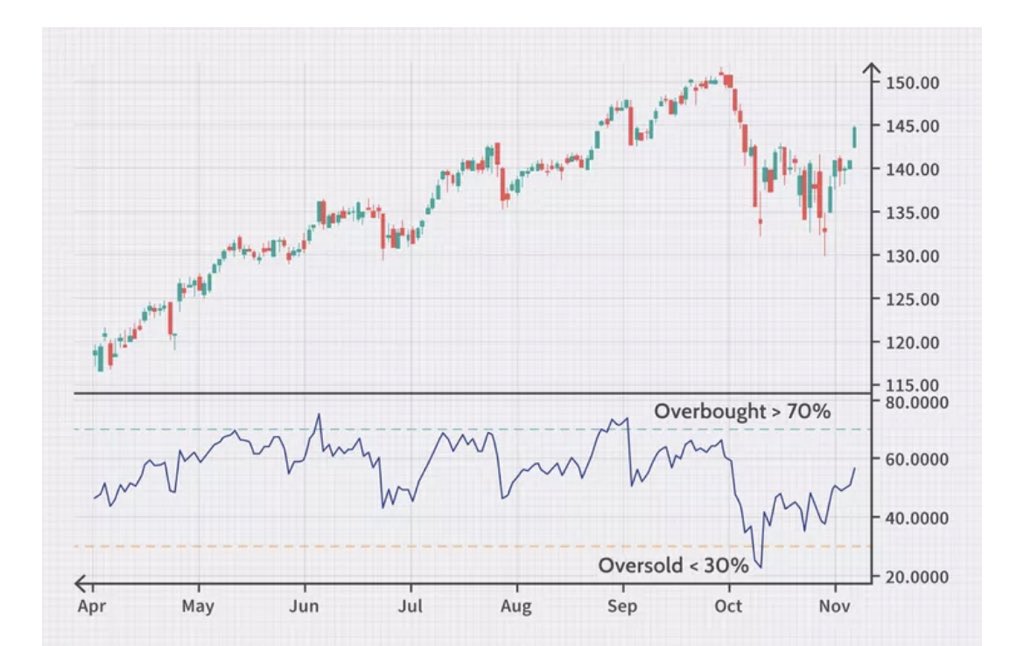
As you can see in the above chart, the RSI indicator can stay in the overbought region for extended periods while the stock is in an uptrend. The indicator may also remain in oversold territory for a long time when the stock is in a downtrend.
Why Is RSI Important?
•Traders can use RSI to predict the price behavior of a security.
•It can help traders validate trends and trend reversals.
•It can point to overbought and oversold securities.
•It can provide short-term traders with buy and sell signals.
•Traders can use RSI to predict the price behavior of a security.
•It can help traders validate trends and trend reversals.
•It can point to overbought and oversold securities.
•It can provide short-term traders with buy and sell signals.
Using RSI With Trends
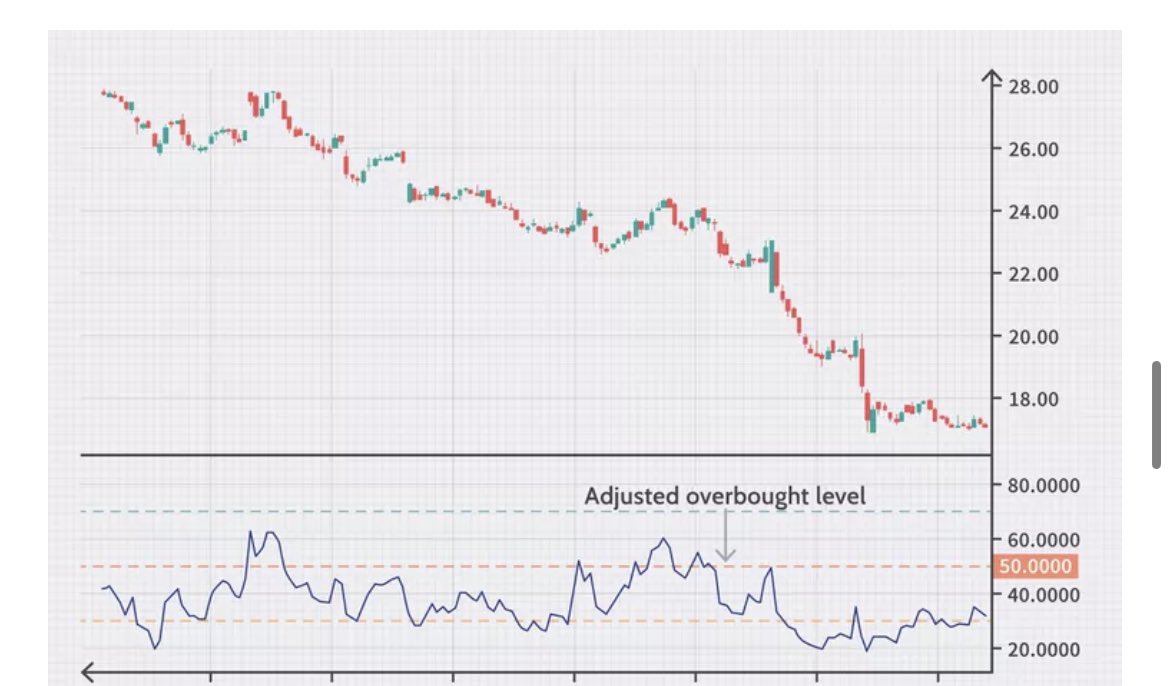
Modify RSI Levels to Fit Trends
The primary trend of the security is important to know to properly understand RSI readings. For example, well-known market technician Constance Brown, CMT, proposed that an oversold reading by the RSI in an uptrend is pro much
Modify RSI Levels to Fit Trends
The primary trend of the security is important to know to properly understand RSI readings. For example, well-known market technician Constance Brown, CMT, proposed that an oversold reading by the RSI in an uptrend is pro much
As you can see in the following chart, during a downtrend, the RSI peaks near 50 rather than 70. This could be seen by traders as more reliably signaling bearish conditions.
Many investors create a horizontal trendline between the levels of 30 and 70 when a strong trend is in pl
Many investors create a horizontal trendline between the levels of 30 and 70 when a strong trend is in pl
On the other hand, modifying overbought or oversold RSI levels when the price of a stock or asset is in a long-term horizontal channel or trading range (rather than a strong upward or downward trend) is usually unnecessary.
Use Buy and Sell Signals That Fit Trends
A related concept focuses on trade signals and techniques that conform to the trend. In other words, using bullish signals primarily when the price is in a bullish trend and bearish signals primarily when a stock is in a bearish trend may
A related concept focuses on trade signals and techniques that conform to the trend. In other words, using bullish signals primarily when the price is in a bullish trend and bearish signals primarily when a stock is in a bearish trend may
Overbought or Oversold
Generally, when the RSI indicator crosses 30 on the RSI chart, it is a bullish sign and when it crosses 70, it is a bearish sign. Put another way, one can interpret that RSI values of 70 or above indicate that a security is becoming overbought or overvalued
Generally, when the RSI indicator crosses 30 on the RSI chart, it is a bullish sign and when it crosses 70, it is a bearish sign. Put another way, one can interpret that RSI values of 70 or above indicate that a security is becoming overbought or overvalued
Overbought refers to a security that trades at a price level above its true (or intrinsic) value. That means that it's priced above where it should be, according to practitioners of either technical analysis or fundamental analysis.
These guidelines can help traders determine trend strength and spot potential reversals. For example, if the RSI can’t reach 70 on a number of consecutive price swings during an uptrend, but then drops below 30, the trend has weakened and could be reversing lower
The opposite is true for a downtrend. If the downtrend is unable to reach 30 or below and then rallies above 70, that downtrend has weakened and could be reversing to the upside. Trend lines and moving averages are helpful technical tools to include when using the RSI in this way
Example of RSI Divergences
An RSI divergence occurs when price moves in the opposite direction of the RSI. In other words, a chart might display a change in momentum before a corresponding change in price.
An RSI divergence occurs when price moves in the opposite direction of the RSI. In other words, a chart might display a change in momentum before a corresponding change in price.
A bullish divergence occurs when the RSI displays an oversold reading followed by a higher low that appears with lower lows in the price. This may indicate rising bullish momentum, and a break above oversold territory could be used to trigger a new long position.
Loading suggestions...