

Let's learn about MACD today!
The momentum indicator that helps you spot trend changes
A Thread🧵👇
#LearnwithICICIDirect #TechnicalTuesdays
The momentum indicator that helps you spot trend changes
A Thread🧵👇
#LearnwithICICIDirect #TechnicalTuesdays
[A] What is Moving Average Convergence Divergence (MACD)?
🔸Technical analysis indicator used to identify changes in momentum, direction & trend strength of a security or asset
🔸Made up of the conv. & div. of two moving averages
🔸Developed by Gerald Appel in the late 1970s
🔸Technical analysis indicator used to identify changes in momentum, direction & trend strength of a security or asset
🔸Made up of the conv. & div. of two moving averages
🔸Developed by Gerald Appel in the late 1970s
[B] How to calculate MACD?
MACD indicator compares moving avg of a stock's price to identify changes in trend & momentum
It can be calculated using:
1. MACD Line
🔸Calculate the MACD line by subtracting the long-term moving avg (26-EMA) from the short-term moving avg (12-EMA)
MACD indicator compares moving avg of a stock's price to identify changes in trend & momentum
It can be calculated using:
1. MACD Line
🔸Calculate the MACD line by subtracting the long-term moving avg (26-EMA) from the short-term moving avg (12-EMA)
🔸12-EMA is more reactive to changes in price, while 26-EMA provides a broader view of the asset's trend
🔸By subtracting, MACD can identify changes in trend & momentum
🔸When the MACD line is above 0, it indicates a bullish sign & when it's below 0, it indicates a bearish sign
🔸By subtracting, MACD can identify changes in trend & momentum
🔸When the MACD line is above 0, it indicates a bullish sign & when it's below 0, it indicates a bearish sign
2. Signal Line (SL)
🔸The SL is a moving avg of the MACD line that smooths it out and provides a clearer trend picture
🔸 It's used as a trigger for buy or sell signals when it crosses the MACD line, and a bullish or bearish signal when above or below it, respectively
🔸The SL is a moving avg of the MACD line that smooths it out and provides a clearer trend picture
🔸 It's used as a trigger for buy or sell signals when it crosses the MACD line, and a bullish or bearish signal when above or below it, respectively
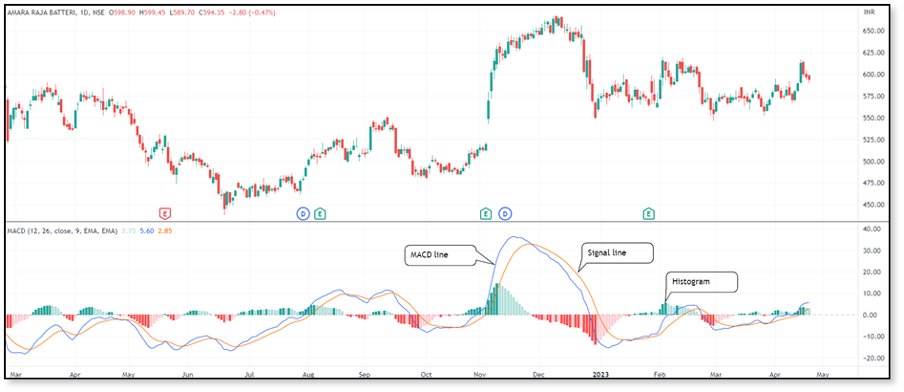
3. Histogram
🔸It is the diff. b/w the MACD line & the SL plotted as a bar chart that fluctuates above & below a zero line.
🔸It represents the degree of divergence or convergence & its height reflects the magnitude of the diff. b/w the MACD line and the SL
Contd.👇
🔸It is the diff. b/w the MACD line & the SL plotted as a bar chart that fluctuates above & below a zero line.
🔸It represents the degree of divergence or convergence & its height reflects the magnitude of the diff. b/w the MACD line and the SL
Contd.👇
🔸MACD line above or below the SL generates a positive & negative histogram, indicating bullish & bearish momentum resp.
🔸Formula:
👉MACD Line = 12-period EMA - 26-period EMA
👉Signal Line = 9-period EMA of MACD Line
🔸Blue line is the MACD line, while the red line is the SL👇
🔸Formula:
👉MACD Line = 12-period EMA - 26-period EMA
👉Signal Line = 9-period EMA of MACD Line
🔸Blue line is the MACD line, while the red line is the SL👇
[C] Interpretation
Guidelines for interpreting the MACD:
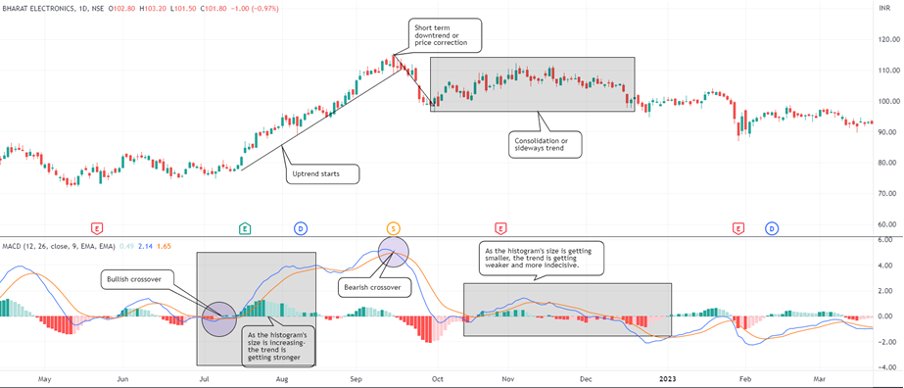
👉Crossover
🔸The most basic signal when the MACD line crosses the SL
🔸MACD line crossing above SL is a bullish signal for long trade while crossing below SL is a bearish signal to short or exit a long position
Guidelines for interpreting the MACD:
👉Crossover
🔸The most basic signal when the MACD line crosses the SL
🔸MACD line crossing above SL is a bullish signal for long trade while crossing below SL is a bearish signal to short or exit a long position
![[C] Interpretation
Guidelines for interpreting the MACD:
👉Crossover
🔸The most basic signal when th...](https://pbs.twimg.com/media/FvHzU30XoAIguia.jpg)
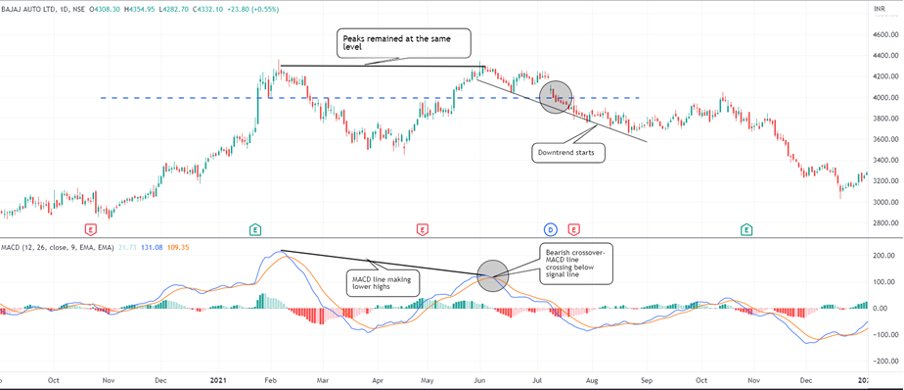
👉Divergence
🔸Convergence happens when the MACD & prices move in the same direction, indicating a trend's strength &
🔸Divergence occurs when both move in opp. directions, indicating a trend reversal.
Contd.👇
🔸Convergence happens when the MACD & prices move in the same direction, indicating a trend's strength &
🔸Divergence occurs when both move in opp. directions, indicating a trend reversal.
Contd.👇
🔸Bullish divergence: price makes lower lows, MACD makes higher lows, potential reversal to the upside
🔸 Bearish divergence: price makes higher highs, MACD makes lower highs, potential reversal to the downside
🔸 Bearish divergence: price makes higher highs, MACD makes lower highs, potential reversal to the downside
👉 Histogram
🔸It displays distance b/w the MACD & the SL
🔸It fluctuates above & below a zero line
🔸Bigger bars suggest inc. dis. b/w the MACD and the SL, indicating strengthening momentum
🔸Smaller bars suggest weakening momentum & a possible loss of strength in the trend
🔸It displays distance b/w the MACD & the SL
🔸It fluctuates above & below a zero line
🔸Bigger bars suggest inc. dis. b/w the MACD and the SL, indicating strengthening momentum
🔸Smaller bars suggest weakening momentum & a possible loss of strength in the trend
[D] Drawbacks of using MACD
🔸Lagging Indicator
👉Relies on historical price data & generates delayed signals, leading to untimely alerts.
In fast-moving & unpredictable markets, it may not be effective
🔸Lagging Indicator
👉Relies on historical price data & generates delayed signals, leading to untimely alerts.
In fast-moving & unpredictable markets, it may not be effective
🔸False Signal
👉Produces false signals
👉A crossover b/w the MACD and the SL may suggest a trend reversal, but the price could still move in the same direction
👉Produces false signals
👉A crossover b/w the MACD and the SL may suggest a trend reversal, but the price could still move in the same direction
🔸Overreliance:
👉The default settings may not work for all assets & timeframes, so it's important to experiment with different settings
👉The default settings may not work for all assets & timeframes, so it's important to experiment with different settings
🔸Limited usefulness
👉It may not be effective in range-bound or sideways markets, & other tools such as oscillators may be more appropriate for identifying buy & sell signals
👉It may not be effective in range-bound or sideways markets, & other tools such as oscillators may be more appropriate for identifying buy & sell signals
Want us to keep doing this?
1. Follow us (@ICICI_Direct) and hit the bell icon🔔
2. Retweet this tweet👇
1. Follow us (@ICICI_Direct) and hit the bell icon🔔
2. Retweet this tweet👇
TL;DR
[1] What is MACD?
[2] How to calculate MACD?
[3] Interpretation
[4] Drawbacks of using MACD
[1] What is MACD?
[2] How to calculate MACD?
[3] Interpretation
[4] Drawbacks of using MACD
Disclaimer: Investments in securities markets are subject to market risks. Please read all related documents carefully.
Full disclaimer here: bit.ly
Full disclaimer here: bit.ly
Loading suggestions...