
The heart of financial markets is certainly charts.
Understanding candlesticks is a basic skill both for newcomers and seasoned investors.
Here is my simple guide to Japanese candlesticks + common patterns to improve your profitability.
1/22 🧵👇
Understanding candlesticks is a basic skill both for newcomers and seasoned investors.
Here is my simple guide to Japanese candlesticks + common patterns to improve your profitability.
1/22 🧵👇

1.
~ A steady war ~
Imagine candlesticks like a battle.
We have buyers (green candles) and sellers (red candles).
When the opposing forces of buyers and sellers are in balance, the battle is reduced to a stalemate, neither side prevails over the other.
~ A steady war ~
Imagine candlesticks like a battle.
We have buyers (green candles) and sellers (red candles).
When the opposing forces of buyers and sellers are in balance, the battle is reduced to a stalemate, neither side prevails over the other.
2.
On the opposite, if one force dominates the other, we can see a direction, supported by volatility and volumes.
We can also have fake movements that give the illusion of predominance, but end up in a fakeout.
That's why closures (1D-1W-1M) are important.
On the opposite, if one force dominates the other, we can see a direction, supported by volatility and volumes.
We can also have fake movements that give the illusion of predominance, but end up in a fakeout.
That's why closures (1D-1W-1M) are important.
3.
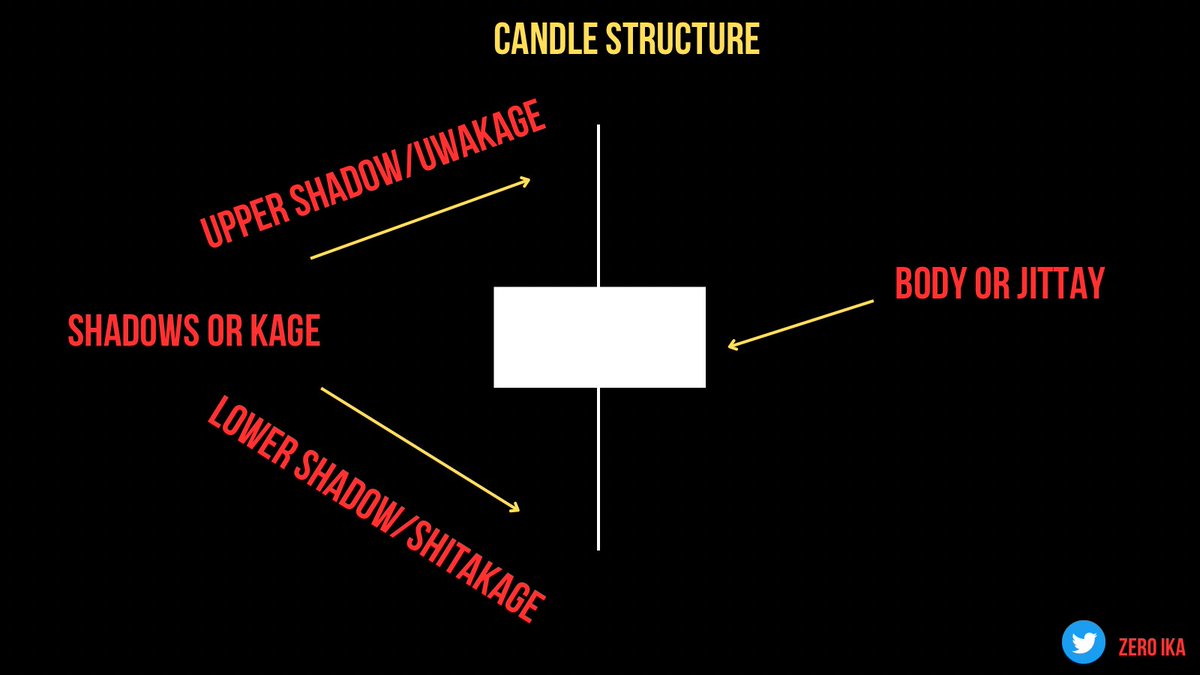
♦️ Candle structure
• Jittay or body ➩ combines the opening price with the closing price and is represented by the widest part of the candle.
• Kage or Shadows ➩ connect the maximum and minimum to the body with a line.
Upper shadow (uwakage)
Lower shadow (shitakage)
♦️ Candle structure
• Jittay or body ➩ combines the opening price with the closing price and is represented by the widest part of the candle.
• Kage or Shadows ➩ connect the maximum and minimum to the body with a line.
Upper shadow (uwakage)
Lower shadow (shitakage)
4
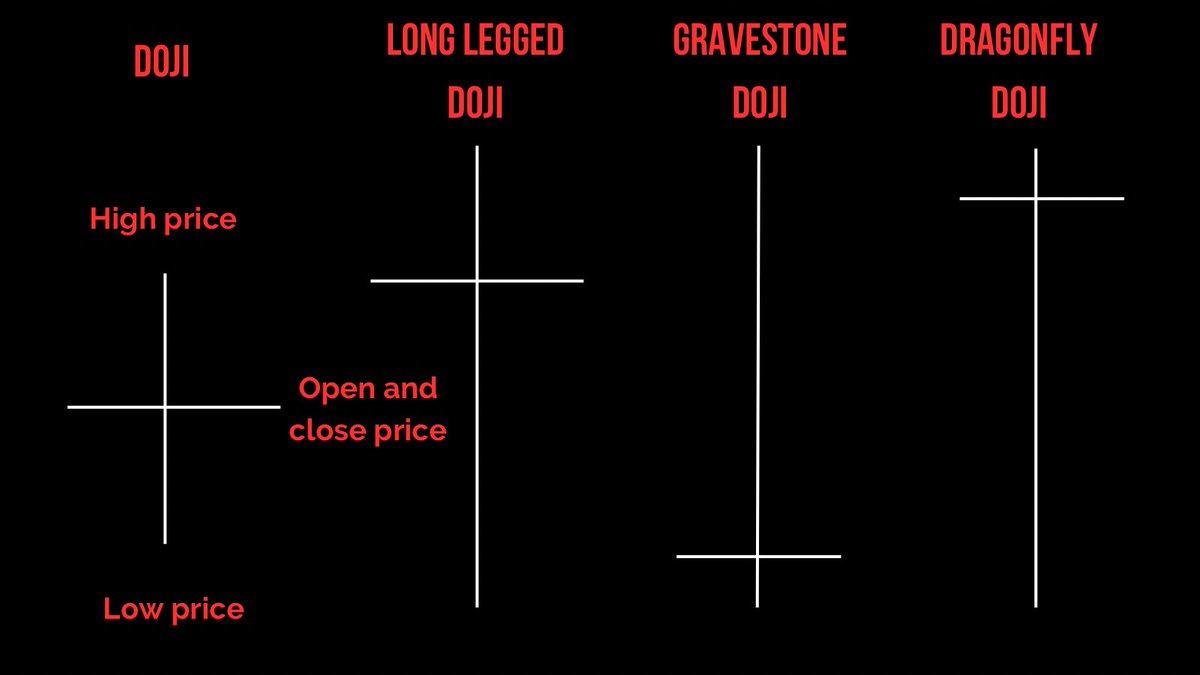
~ Doji ~
Doji candles indicate uncertainty in the market: there’s no winner between bulls and bears.
The candle after the doji could dictate the next trend.
• Green candle after doji ➩ bull
• Red candle after doji ➩ bear
It's always prudent to wait the candle post doji.
~ Doji ~
Doji candles indicate uncertainty in the market: there’s no winner between bulls and bears.
The candle after the doji could dictate the next trend.
• Green candle after doji ➩ bull
• Red candle after doji ➩ bear
It's always prudent to wait the candle post doji.
5.
Doji indicates uncertainty and possible trend reversal, but not always.
It depends on what phase of the current trend you are in:
1. At the beginning of a trend, a doji is not reliable, better not to bet on the reversal of the trend.
Doji indicates uncertainty and possible trend reversal, but not always.
It depends on what phase of the current trend you are in:
1. At the beginning of a trend, a doji is not reliable, better not to bet on the reversal of the trend.
6.
2. In the middle of a trend it is possible that a doji indicates a correction of the trend, not an actual reversal.
3. After big rises or falls, if a doji is formed, it is a very reliable signal of trend reversal.
As said, it’s always better to wait for the post doji candle.
2. In the middle of a trend it is possible that a doji indicates a correction of the trend, not an actual reversal.
3. After big rises or falls, if a doji is formed, it is a very reliable signal of trend reversal.
As said, it’s always better to wait for the post doji candle.
7.
~ 4 doji types ~
• Standard: potential reversal signal if it forms after very long-bodied candles.
• Long-legged: reliable reversal signal.
• Dragonfly: end of downtrend ➩ start of uptrend.
• Gravestone: end of uptrend ➩ start of downtrend.
~ 4 doji types ~
• Standard: potential reversal signal if it forms after very long-bodied candles.
• Long-legged: reliable reversal signal.
• Dragonfly: end of downtrend ➩ start of uptrend.
• Gravestone: end of uptrend ➩ start of downtrend.
8.
To summarize a potential entry.
Yes if: ✅
• Next candle confirms the signal
• Few dojis in the chart
• First candle is long
• Trend has been going on for a long time
No if: ❌
• Many dojis in the chart
• Multiple dojis in a row
• Trend has just started
To summarize a potential entry.
Yes if: ✅
• Next candle confirms the signal
• Few dojis in the chart
• First candle is long
• Trend has been going on for a long time
No if: ❌
• Many dojis in the chart
• Multiple dojis in a row
• Trend has just started
9.
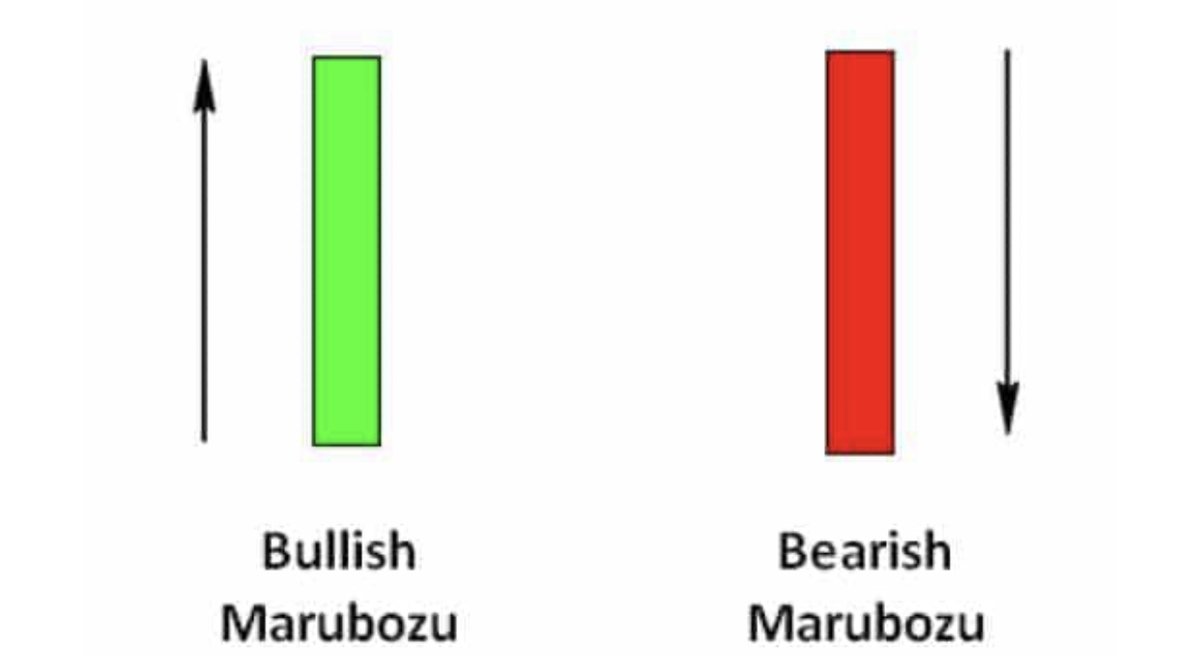
~ Marubozu ~
A marubozu is a candle that opens at a low and closes at a high (or vice versa).
Graphically it is a long candle with only body, without shadows above or below.
~ Marubozu ~
A marubozu is a candle that opens at a low and closes at a high (or vice versa).
Graphically it is a long candle with only body, without shadows above or below.
10.
• Bullish marubozu ➩ solid buying strength that paves the way for an uptrend.
• Bearish marubozu ➩ bearish forces are very strong at the moment ➩ strong signal of a future downtrend.
• Bullish marubozu ➩ solid buying strength that paves the way for an uptrend.
• Bearish marubozu ➩ bearish forces are very strong at the moment ➩ strong signal of a future downtrend.
11.
Take note that everything depends on the trend.
At the beginning of a trend ➩ strength of the new trend.
At the end of a trend ➩ can be the last acceleration of the current trend to then see the start of a reversal with an opposite marubozu.
Take note that everything depends on the trend.
At the beginning of a trend ➩ strength of the new trend.
At the end of a trend ➩ can be the last acceleration of the current trend to then see the start of a reversal with an opposite marubozu.
12.
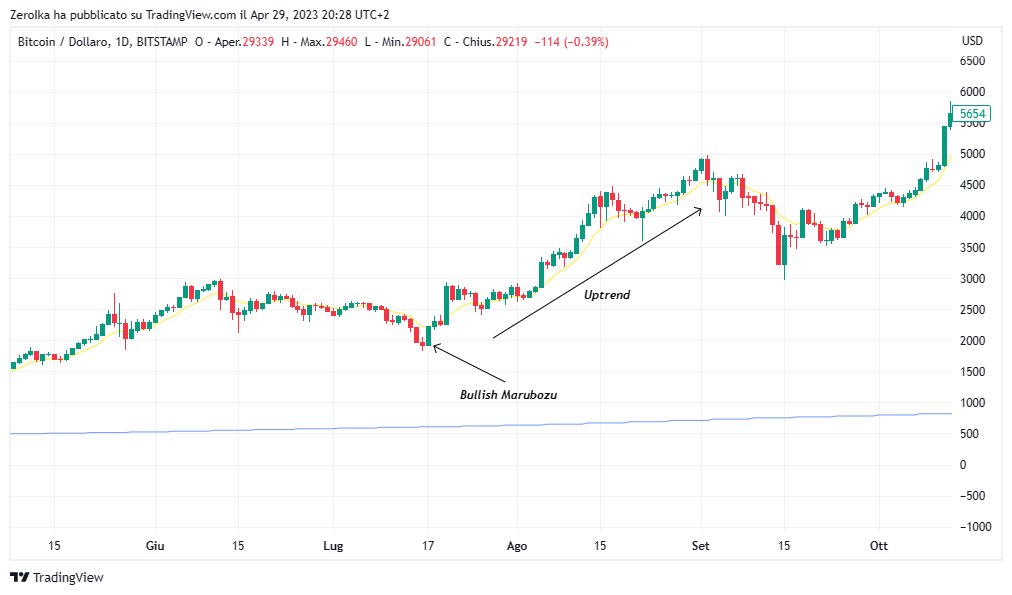
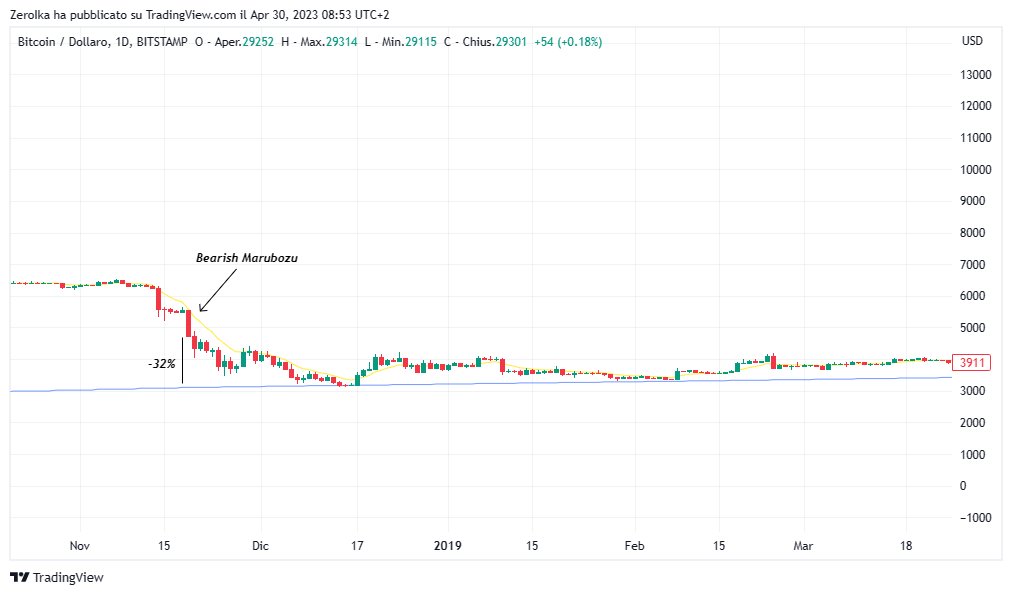
~ Marubozu example ~
In the following charts:
• Bullish marubozu has been useful to identify the uptrend from mid-July to early September.
• Bearish marubozu has given the impulse to print a -32%.
We can therefore use them as another addition to our analysis.
~ Marubozu example ~
In the following charts:
• Bullish marubozu has been useful to identify the uptrend from mid-July to early September.
• Bearish marubozu has given the impulse to print a -32%.
We can therefore use them as another addition to our analysis.
13.
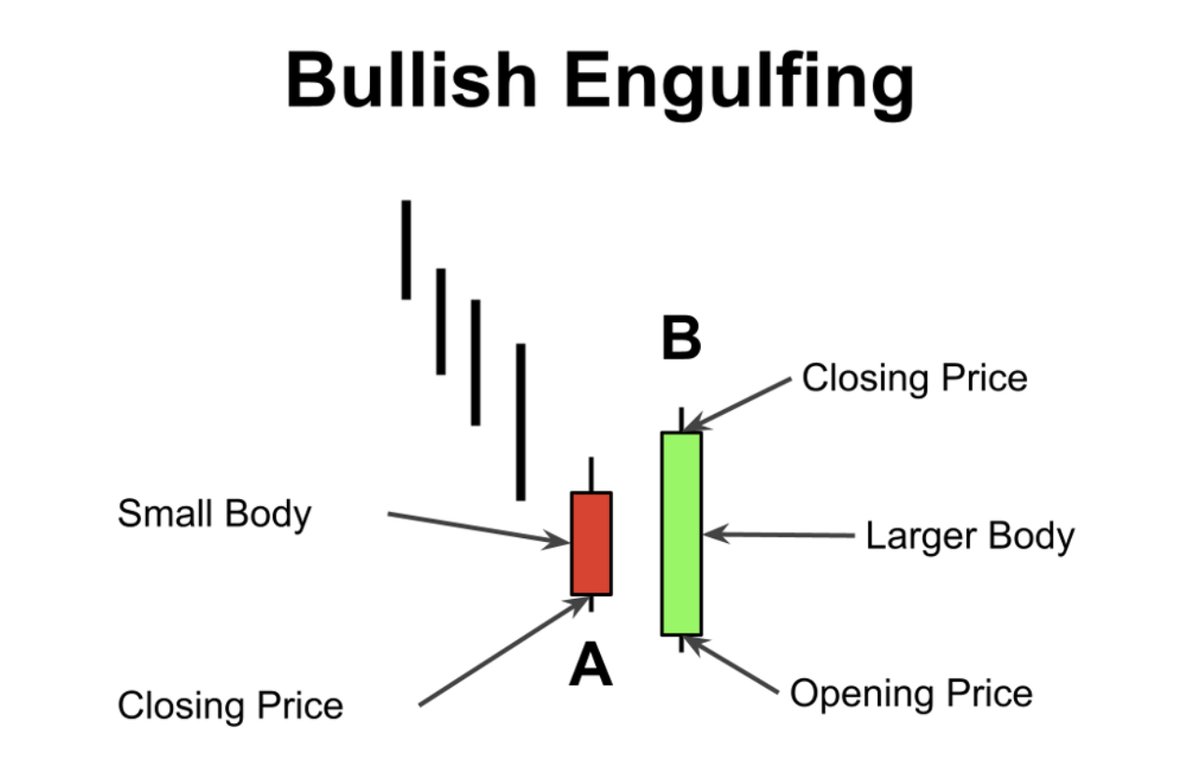
~ Engulfing ~
Bullish engulfing ➩ bearish small candle and a bullish candle immediately after with a very large body.
The body of the second bullish candle must totally include the body of the first bearish one.
Same concept for bearish engulfing with inverted colors.
~ Engulfing ~
Bullish engulfing ➩ bearish small candle and a bullish candle immediately after with a very large body.
The body of the second bullish candle must totally include the body of the first bearish one.
Same concept for bearish engulfing with inverted colors.
14.
They're a trend reversal indicator.
My tips:
• Do not take into consideration trends that have just started.
• Take into consideration only well-established trends.
This will strengthen the reliability of the pattern, thus potential profitability.
They're a trend reversal indicator.
My tips:
• Do not take into consideration trends that have just started.
• Take into consideration only well-established trends.
This will strengthen the reliability of the pattern, thus potential profitability.
15.
~ Opposite trend ~
What happens if we find bearish engulfing in a downtrend and bullish engulfing in an uptrend?
It means that opposing forces have tried to reverse the trend, but the current trend is still too strong and has reacted.
Therefore a strong continuation sign.
~ Opposite trend ~
What happens if we find bearish engulfing in a downtrend and bullish engulfing in an uptrend?
It means that opposing forces have tried to reverse the trend, but the current trend is still too strong and has reacted.
Therefore a strong continuation sign.
16.
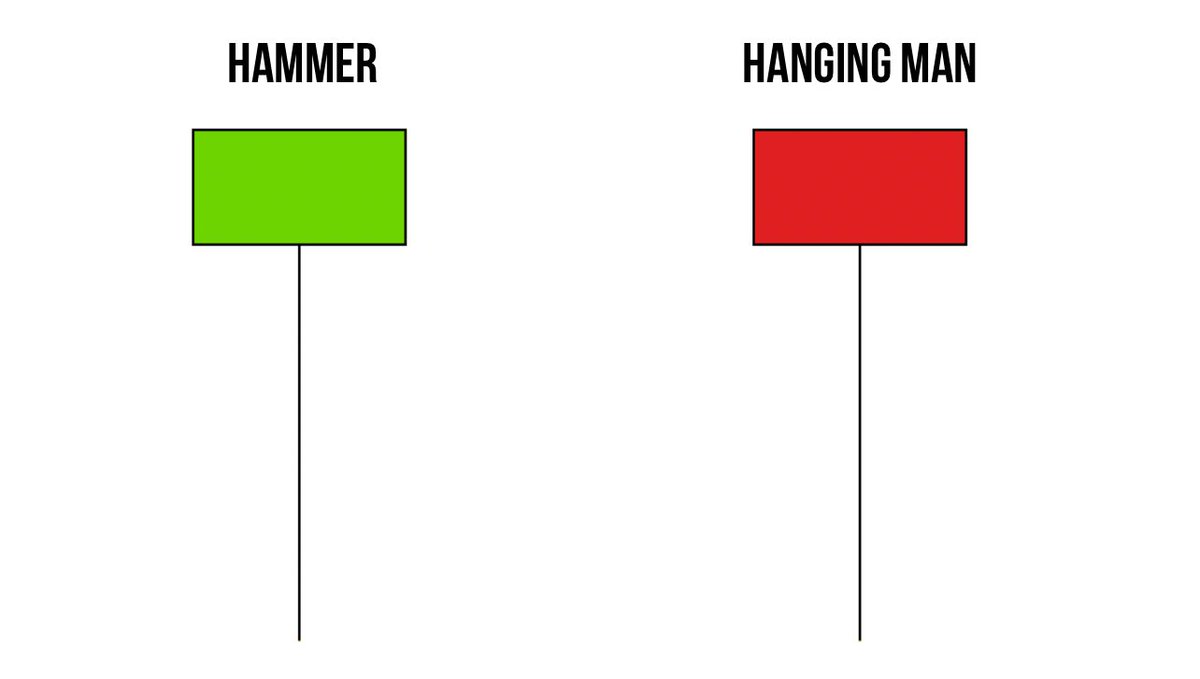
~ Hammer + Hanging man ~
These are one of the most famous candles because they have a high % of successs, hanging man more than hammer.
We can find:
• Hammer at the end of a downtrend.
• Hanging man at the end of an uptrend.
Both are trend reversal candles.
~ Hammer + Hanging man ~
These are one of the most famous candles because they have a high % of successs, hanging man more than hammer.
We can find:
• Hammer at the end of a downtrend.
• Hanging man at the end of an uptrend.
Both are trend reversal candles.
17.
Take note:
It doesn't matter the color of the candle, both hammer and hanging man are efficient figures.
You can therefore use these candles to gauge potential trend reversals and position yourself accordingly.
Take note:
It doesn't matter the color of the candle, both hammer and hanging man are efficient figures.
You can therefore use these candles to gauge potential trend reversals and position yourself accordingly.
18.
~ Inverted hammer + Shooting star ~
These 2 figures are the opposite of hammer and hanging man.
• Inverted hammer is at the end of a downtrend and is a signal of a bullish trend reversal.
• Shooting star is a bearish reversal signal and is at the end of an uptrend.
~ Inverted hammer + Shooting star ~
These 2 figures are the opposite of hammer and hanging man.
• Inverted hammer is at the end of a downtrend and is a signal of a bullish trend reversal.
• Shooting star is a bearish reversal signal and is at the end of an uptrend.

19.
• The inverted hammer pattern may be considered as an entry point
• The shooting star pattern may be considered as an exit point.
Here is an example of both Shooting star and a Hammer covering both directions.
• The inverted hammer pattern may be considered as an entry point
• The shooting star pattern may be considered as an exit point.
Here is an example of both Shooting star and a Hammer covering both directions.


20.
~ Conclusion ~
We tend to rarely take the single candle as a signal, but we combine it with the next one or in groups of three, so as to make the signal stronger and with more confirmations.
They do not have to be used lonely, but together with classic indicators.
~ Conclusion ~
We tend to rarely take the single candle as a signal, but we combine it with the next one or in groups of three, so as to make the signal stronger and with more confirmations.
They do not have to be used lonely, but together with classic indicators.
21.
This helps us to make better decisions, spotting potential uptrends/downtrends and understanding if is the time to buy/wait/sell.
These types of candles are better to be used on a daily timeframe and, as said above, used to gauge the trend direction looking for closures.
This helps us to make better decisions, spotting potential uptrends/downtrends and understanding if is the time to buy/wait/sell.
These types of candles are better to be used on a daily timeframe and, as said above, used to gauge the trend direction looking for closures.
22.
That's it!
• If you liked this thread follow me @IamZeroIka for more crypto insights.
• Like and RT the first tweet to support my work!✌️
• If you want to have access to deeper guides and info, subscribe to my FREE newsletter! (link in bio)
That's it!
• If you liked this thread follow me @IamZeroIka for more crypto insights.
• Like and RT the first tweet to support my work!✌️
• If you want to have access to deeper guides and info, subscribe to my FREE newsletter! (link in bio)
Loading suggestions...