

Many people are confused about Elecon's results, and don't know what caused the sudden fall in stock price.
In this thread I will teach you how to read results correctly with the example of Elecon.
🧵🧵🧵🧵🧵
In this thread I will teach you how to read results correctly with the example of Elecon.
🧵🧵🧵🧵🧵
There are two ways to look at Quarterly results:-
1. YoY= Year on year comparison means that we are comparing Q4FY23 with Q4FY22
2. QoQ= Quarter on Quarter comparison means that we are comparing Q4FY23 with Q3FY23. This is also known as sequential growth.
1. YoY= Year on year comparison means that we are comparing Q4FY23 with Q4FY22
2. QoQ= Quarter on Quarter comparison means that we are comparing Q4FY23 with Q3FY23. This is also known as sequential growth.
Second thing to be careful of while looking at the results of the company:-
1. Always prefer to look at Consolidated results, as this will include all the subsidiaries of the business. And give the correct overall picture of the business performance.
Eg:-
1. Always prefer to look at Consolidated results, as this will include all the subsidiaries of the business. And give the correct overall picture of the business performance.
Eg:-

2. Standalone results will only look at the results of the company standalone and will exclude the results of all the subsidiaries of the business.
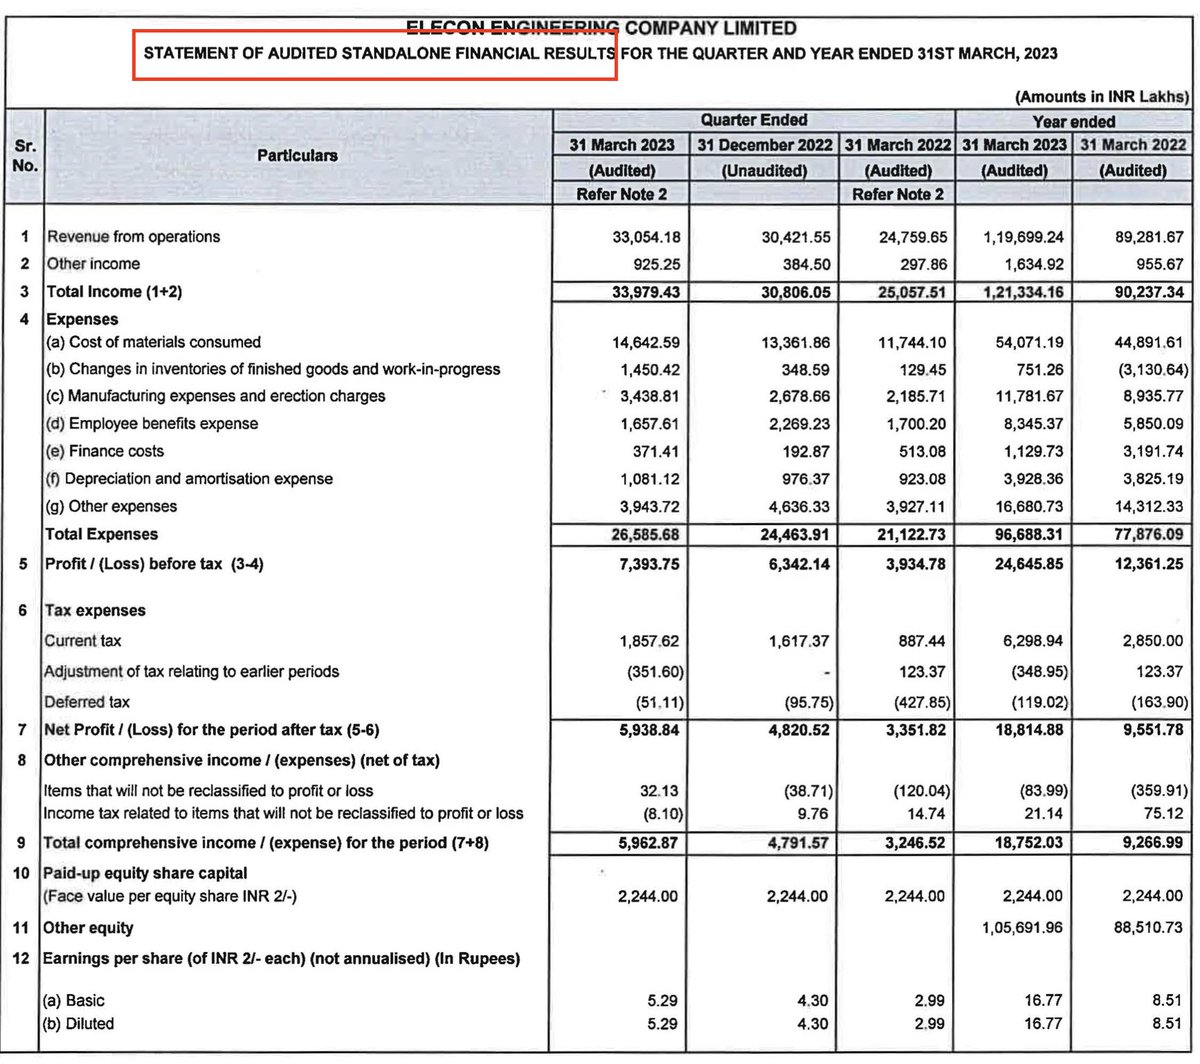
First key thing to look out for in Income statement of the company are the gross margins=
Gross margins simply mean Sales-the Cost of Goods sold or the money spent on Raw material.
It gives you an indication on how comfortably the company has passed on RM price hikes
Gross margins simply mean Sales-the Cost of Goods sold or the money spent on Raw material.
It gives you an indication on how comfortably the company has passed on RM price hikes
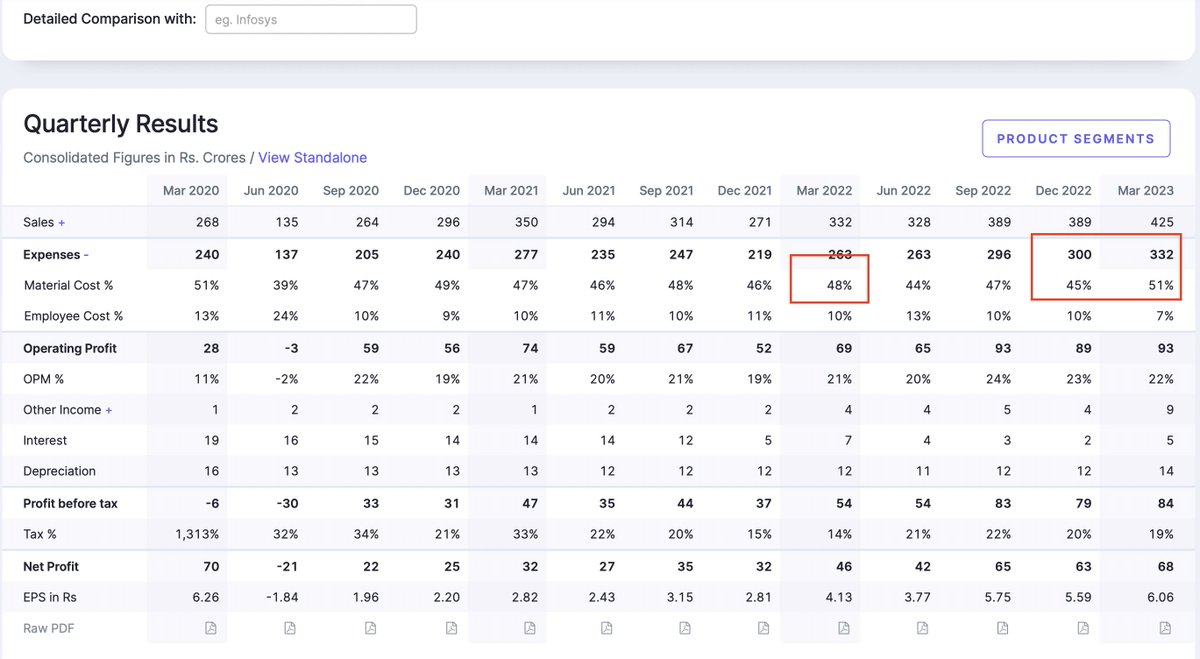
Simply take 100% and subtract it from the material cost shown here on Screener. This will give you the gross margins of the business:-
Eg:-
Q4FY23 GM's=100%-51%=49% Q3FY23 GM's=100%-45%=55% Q4FY22 GM's=100%-48%=52% Gm's have fallen by 600bps QoQ and 300 bps YOY.
Eg:-
Q4FY23 GM's=100%-51%=49% Q3FY23 GM's=100%-45%=55% Q4FY22 GM's=100%-48%=52% Gm's have fallen by 600bps QoQ and 300 bps YOY.
Now coming to absolute Gross Profit Growth=
Gross profit for Elecon in Q4FY23= Sales*Gross Margins
Q4FY23=425 Cr * 49%= 208.25 crores
Q3FY23= 389*55% = 213.95 crores
Q4FY22= 172.64 crores
YOY growth of 20.6% and QOQ de growth of 2%
Gross profit for Elecon in Q4FY23= Sales*Gross Margins
Q4FY23=425 Cr * 49%= 208.25 crores
Q3FY23= 389*55% = 213.95 crores
Q4FY22= 172.64 crores
YOY growth of 20.6% and QOQ de growth of 2%
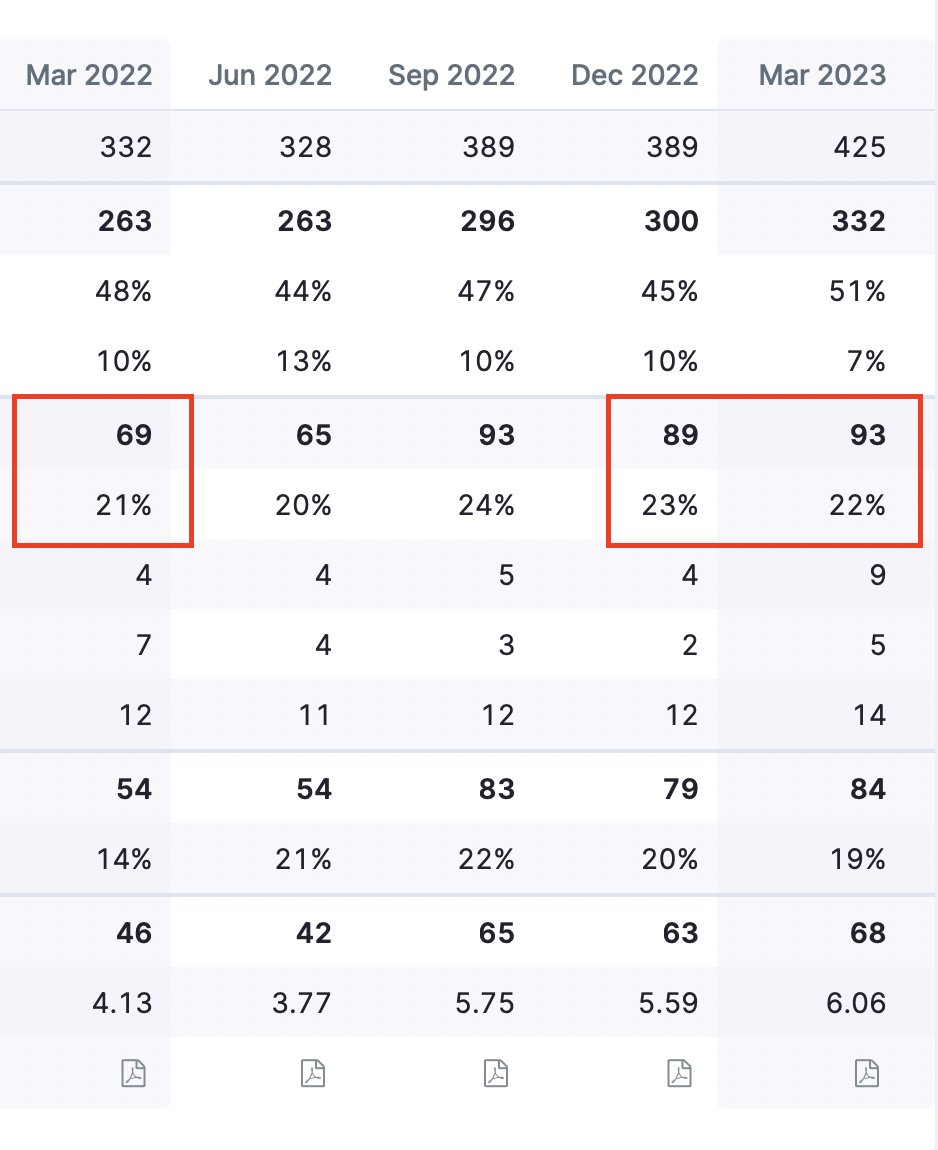
Lets look at the Ebitda Margins and Growth of Elecon this Quarter:-
Q4FY23 Ebitda:- 93 crores and Margins ar 22% Q3FY23 Ebitda:- 89 crores and Margins at 23% Q4FY22 EBITDA:- 69 crores and Margins of 21%.
Q4FY23 Ebitda:- 93 crores and Margins ar 22% Q3FY23 Ebitda:- 89 crores and Margins at 23% Q4FY22 EBITDA:- 69 crores and Margins of 21%.
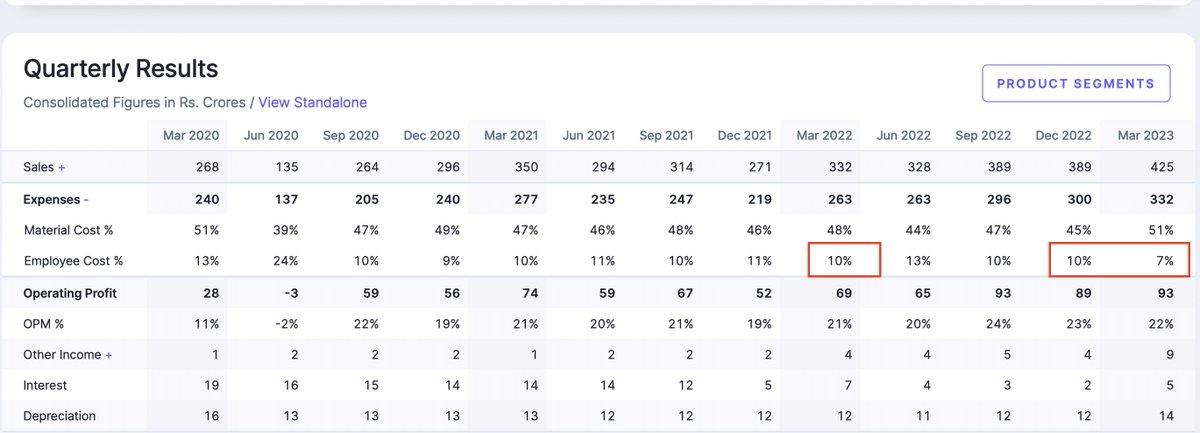
Even though Gross profits have De-grown QoQ. Ebitda has grown QoQ, simply because of Operating leverage. Which can be seen in sequential (QoQ) reduction in Manufacturing Expenses/Employee costs here:-
Therefore,
YOY Ebitda has grown by 34.7% (93-69/69)
QoQ Ebitda has grown by 4.4% (93-89/89)
YOY Ebitda has grown by 34.7% (93-69/69)
QoQ Ebitda has grown by 4.4% (93-89/89)
Now coming to PBT and Pat before we go to Segmental performance, cash flows, Balance sheet and Guidance.
Increase in other income has been offset by higher interest expenses and depreciation costs this Quarter vs the last.
Increase in other income has been offset by higher interest expenses and depreciation costs this Quarter vs the last.
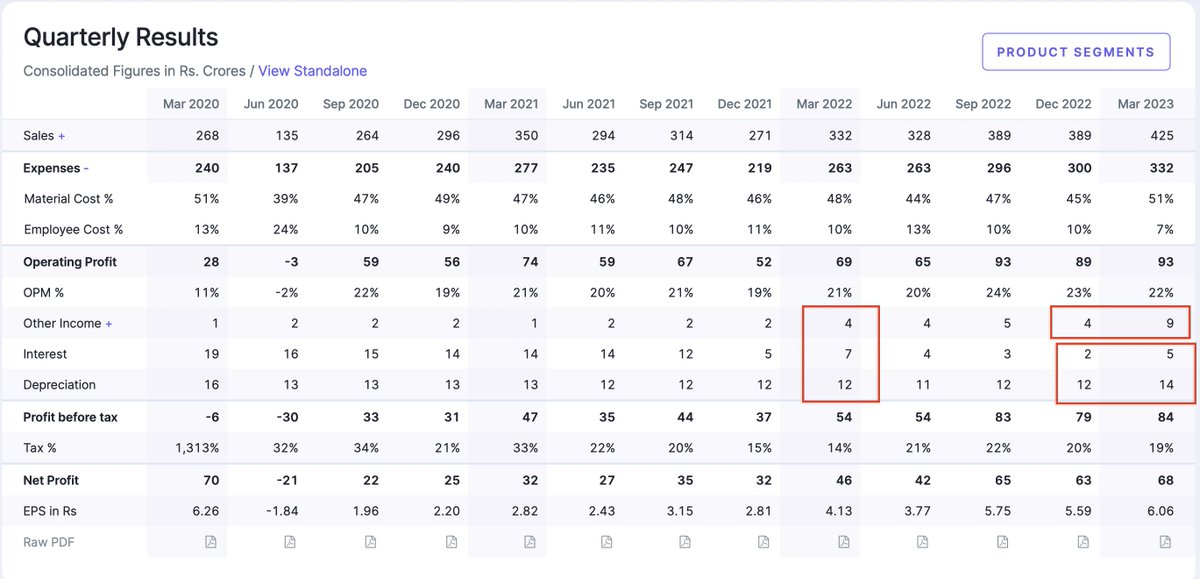
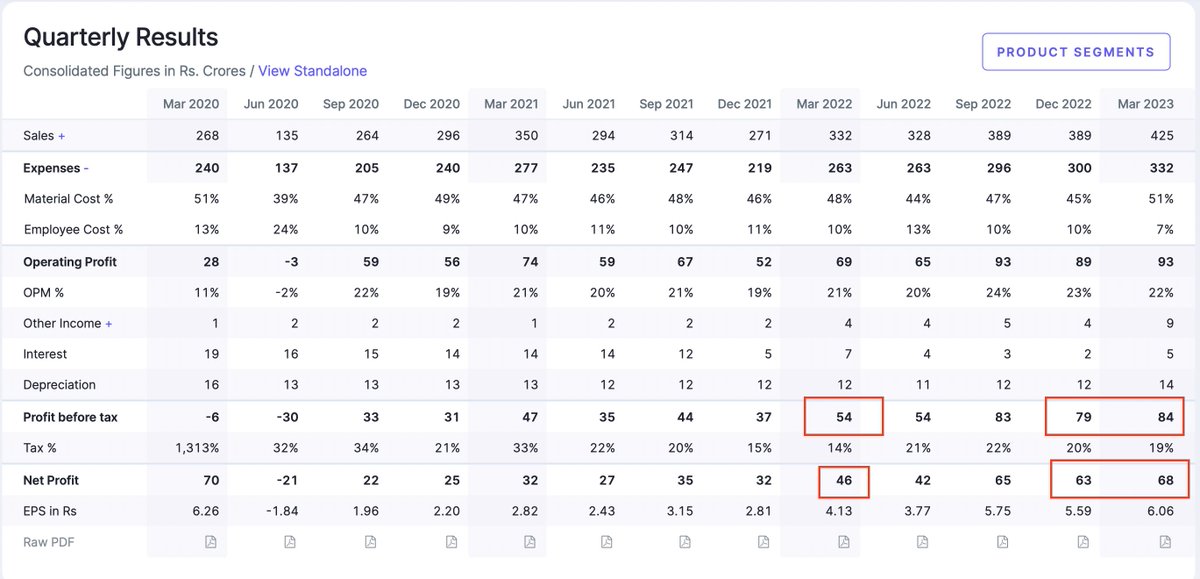
PBT growth looks like this:-
Q4FY23:- 84 crores
Q3FY23:- 79 crores
Q4FY22:- 54 crores
PAT growth looks like this:-
Q4FY23:- 68 crores (19% tax rate this Q)
Q3FY23:- 63 crores (20% Tax rate in Last Q)
Q4FY22:- 46 Crores (14% Tax rate)
Q4FY23:- 84 crores
Q3FY23:- 79 crores
Q4FY22:- 54 crores
PAT growth looks like this:-
Q4FY23:- 68 crores (19% tax rate this Q)
Q3FY23:- 63 crores (20% Tax rate in Last Q)
Q4FY22:- 46 Crores (14% Tax rate)
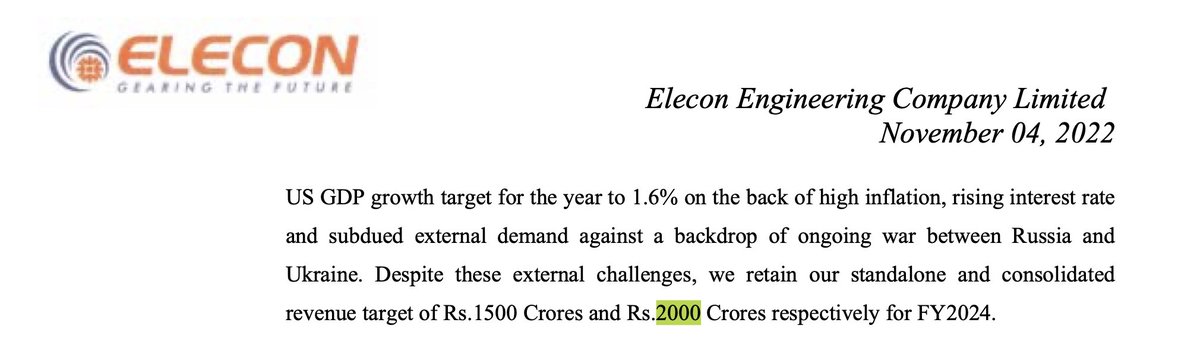
Now lets look at the part that has caused the most confusion amongst investors:-
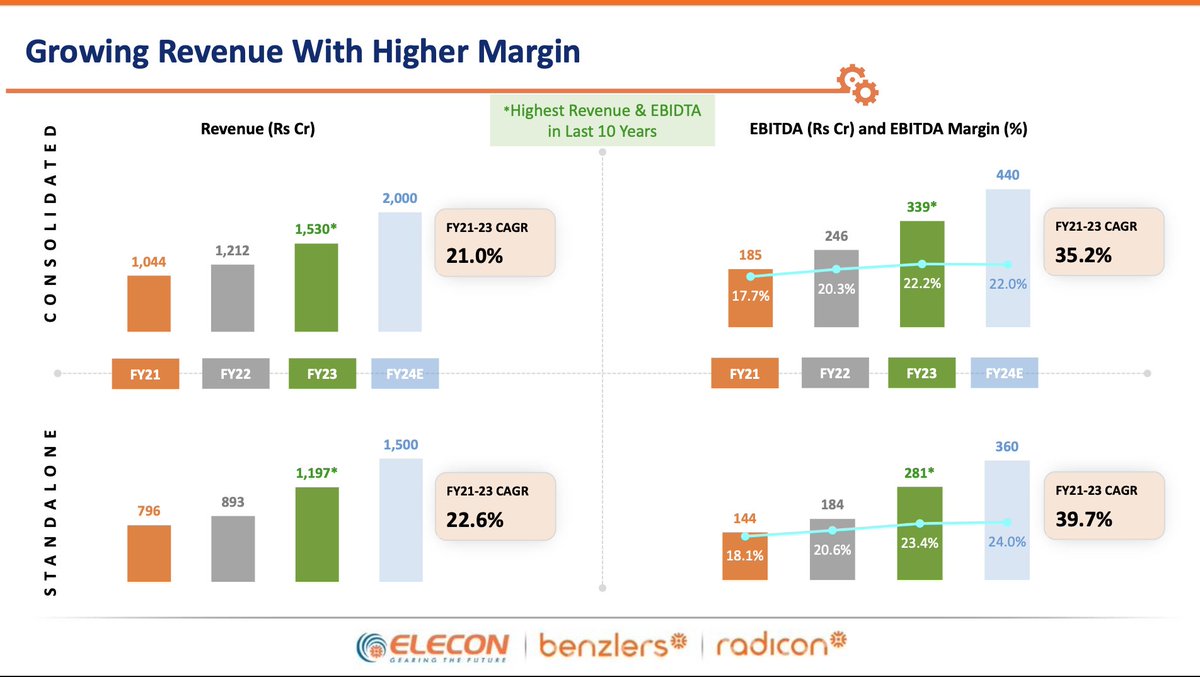
**Guidance for FY24** Earlier in the concalls management has stated that they are confident of achieving 2000 crores Topline for FY24:-
**Guidance for FY24** Earlier in the concalls management has stated that they are confident of achieving 2000 crores Topline for FY24:-
In this Quarters results, in the investor presentation the Guidance for **GEARS Business is mentioned at 1700 crores**. Remember that Elecon has 2 businesses:- Material & Handling and the other one is Gears.
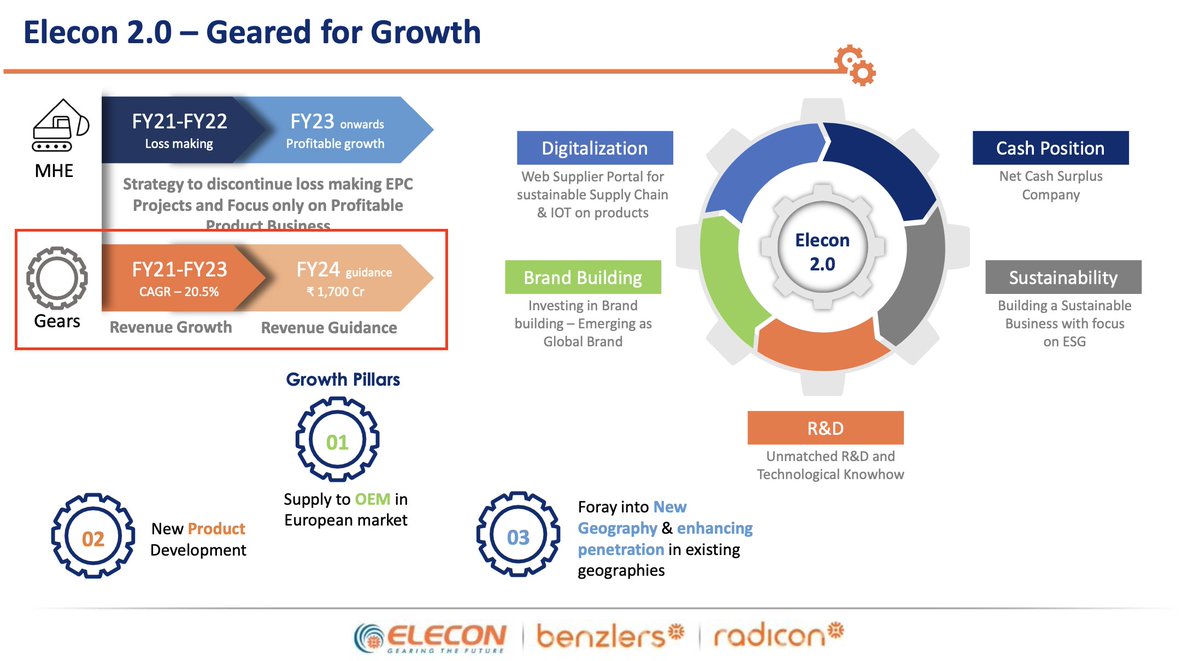
In the Material & Handling business.
The guidance is for 300 odd crores. Listen to this interview from 1min21 seconds-
Thus, M&H=300 Crores Gears= 1700 crores =2000 crores on Consol basis.
Still you should attend the concall to clarify this..
The guidance is for 300 odd crores. Listen to this interview from 1min21 seconds-
Thus, M&H=300 Crores Gears= 1700 crores =2000 crores on Consol basis.
Still you should attend the concall to clarify this..
Overall trajectory of the business over the 2-3 years is what a long term investor might be interested in to look at:-
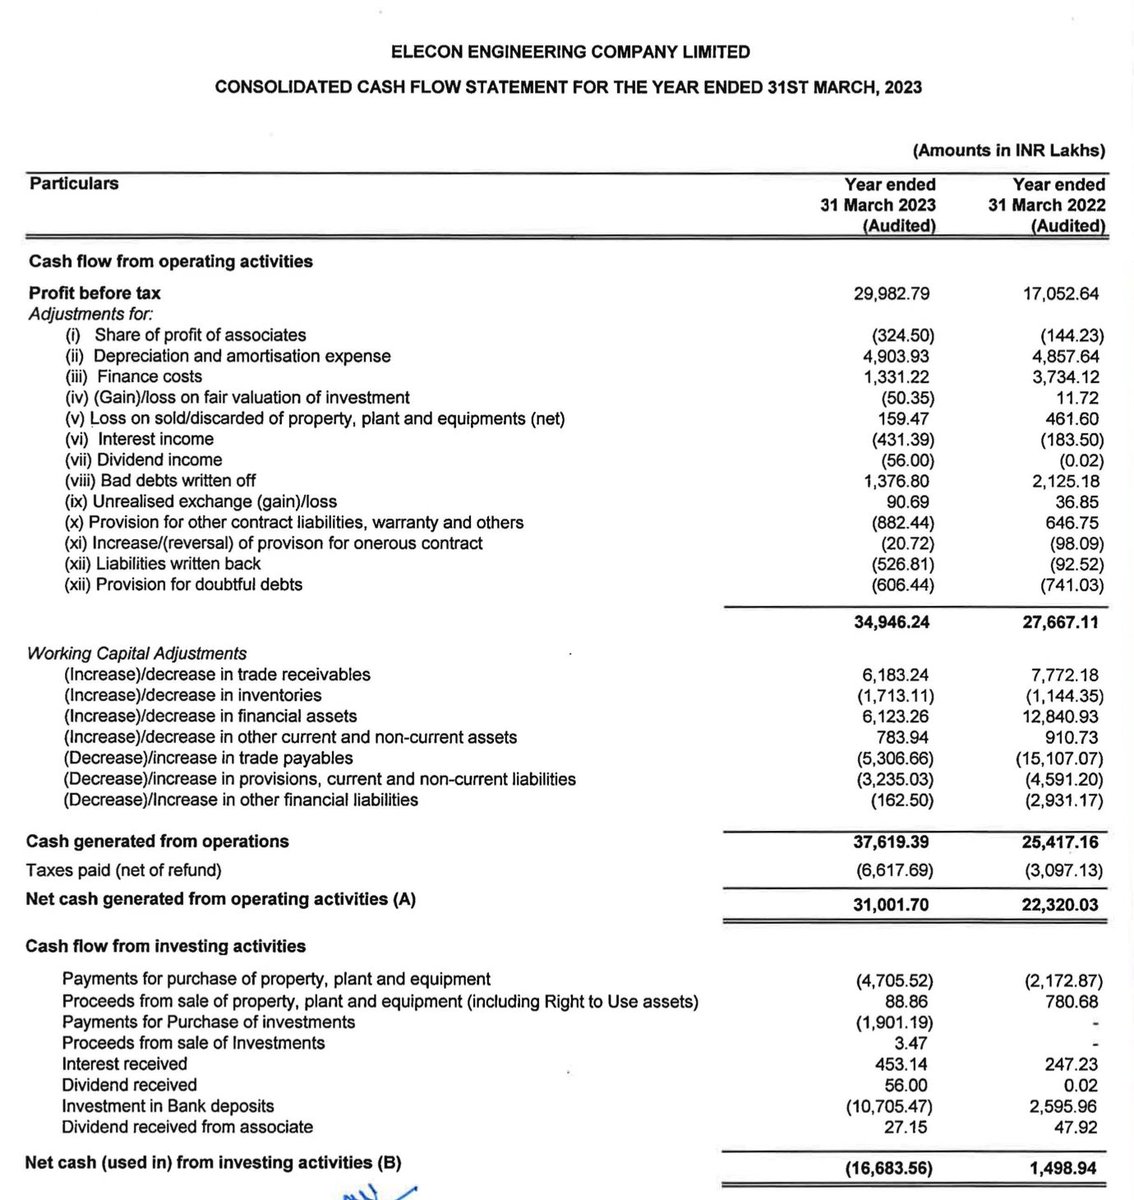
Cash flows from operations have improved from 223 crores to 310 crores. Almost a 40%+ Improvement YOY. Which is driven by improvement in inventory and trade payables.
Purely due to changes in Working capital days which have fallen from 91 days to 78 days.
Purely due to changes in Working capital days which have fallen from 91 days to 78 days.
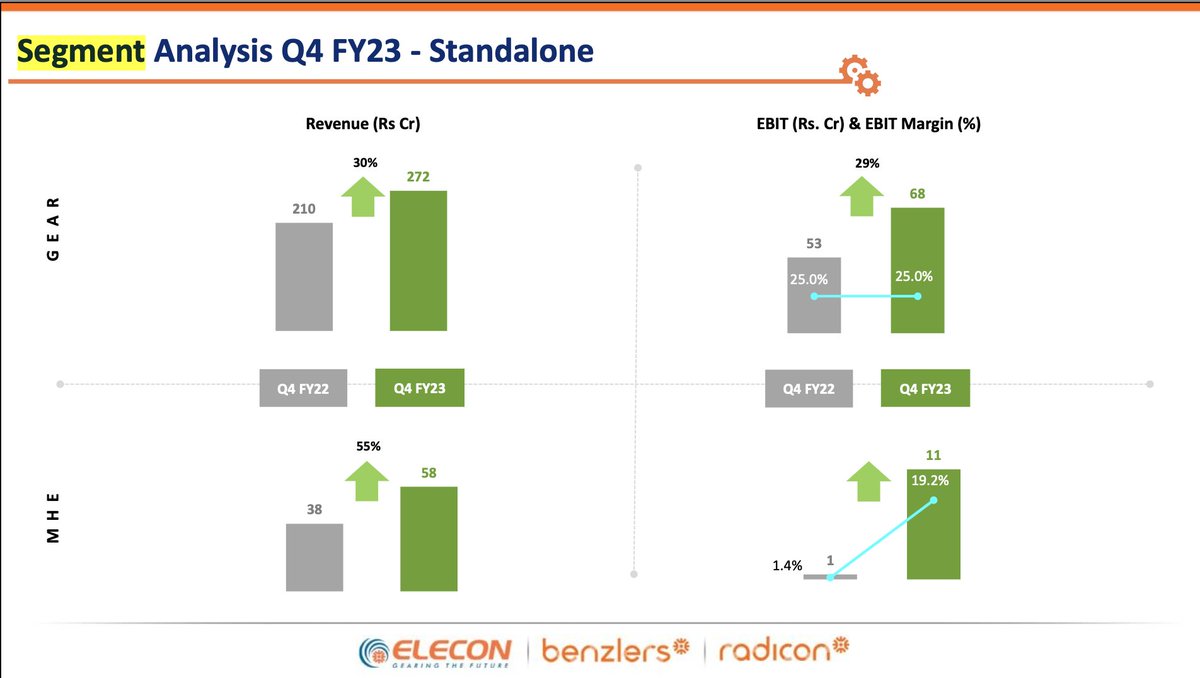
Revenue mix and Segment wise. EBIT Margins for the Gears business has remained at 25%
Thus, incremental operating leverage has been driven by a turn around in Material and Handling business:-
From 1.4% EBIT margins to 19.2%.
FY23:- 86% of revenues from Gears
14% from MH&E
Thus, incremental operating leverage has been driven by a turn around in Material and Handling business:-
From 1.4% EBIT margins to 19.2%.
FY23:- 86% of revenues from Gears
14% from MH&E
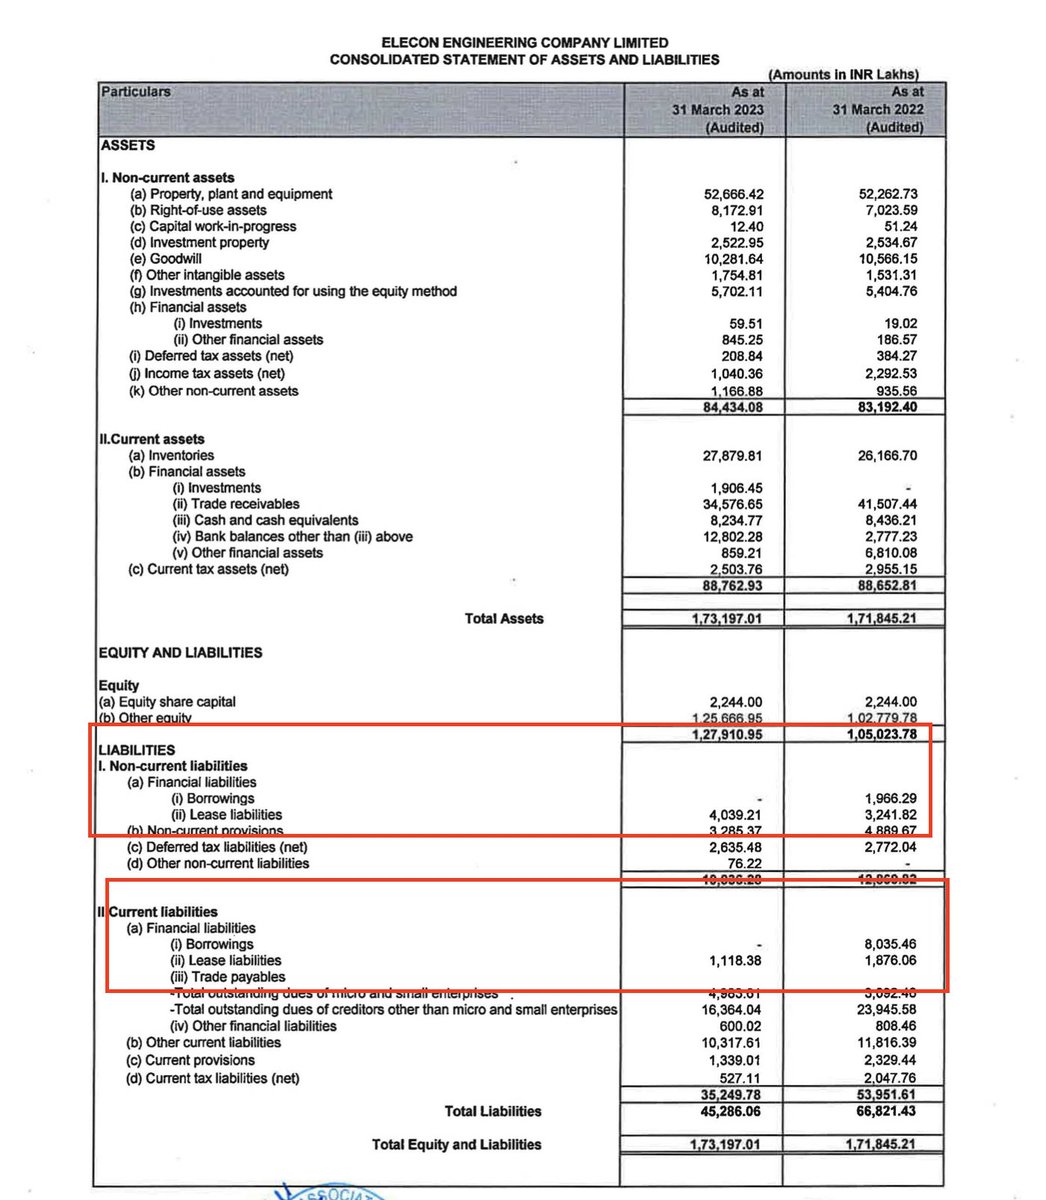
On the balance sheet, the major positive is that
Both Long term debt and Short term debt has become 0.
Observe the Key Fundamental changes. (Interest cost it seems has increased due to leases)
Both Long term debt and Short term debt has become 0.
Observe the Key Fundamental changes. (Interest cost it seems has increased due to leases)
Thus, overall results have been good. Will be interesting to see how Elecon does..
For a retail investor, this is an example of how to read results of a company looking at YOY, QOQ, ORDER BOOK, CASH FLOWS, MARGINS and Overall Fundamental changes which go unnoticed.
For a retail investor, this is an example of how to read results of a company looking at YOY, QOQ, ORDER BOOK, CASH FLOWS, MARGINS and Overall Fundamental changes which go unnoticed.
Disc: This is by no means a buy or sell reco. Have no conflicting views about the business.
Posted on request of one of the students 🙏
Risks remain: that it is a proxy to capex in cement, steel, sugar and Power. One needs to understand the cyclicality.
Posted on request of one of the students 🙏
Risks remain: that it is a proxy to capex in cement, steel, sugar and Power. One needs to understand the cyclicality.
Another Point to add:- Elecon includes manufacturing expenses to GM Calculation.
Ebitda Margin guide was maintaining it between 22%-24%.
Entire reaction is possibly driven by miss on Gross margins, as pointed above ^^
Ebitda Margin guide was maintaining it between 22%-24%.
Entire reaction is possibly driven by miss on Gross margins, as pointed above ^^
Loading suggestions...