

#SWING TRADING STRATEGY Using ATR levels.
What is ATR?
✓The average true range (ATR) is a market volatility indicator used in technical analysis.
✓It is typically derived from the 14-day simple moving average of a series of true range indicators.
Continued....
🧵 1)
What is ATR?
✓The average true range (ATR) is a market volatility indicator used in technical analysis.
✓It is typically derived from the 14-day simple moving average of a series of true range indicators.
Continued....
🧵 1)
✓The indicator does not indicate the price direction; instead, it is used primarily to measure volatility caused by gaps and limit up or down moves.
✓It is is relatively simple to calculate, and only needs historical price data.
✓Mostly used to enter and exit trades.
🧵2)
✓It is is relatively simple to calculate, and only needs historical price data.
✓Mostly used to enter and exit trades.
🧵2)
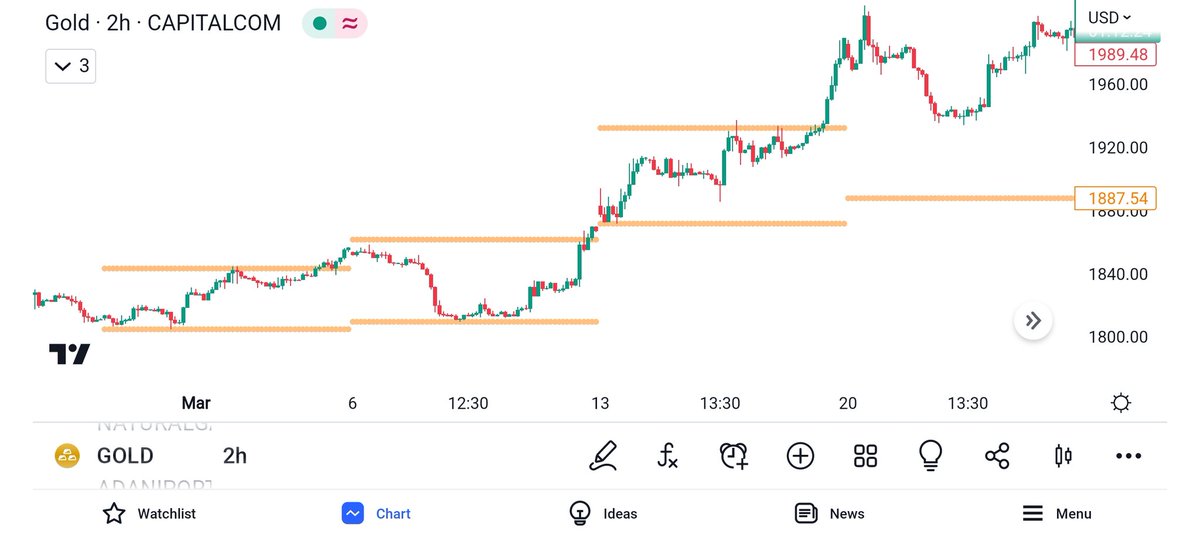
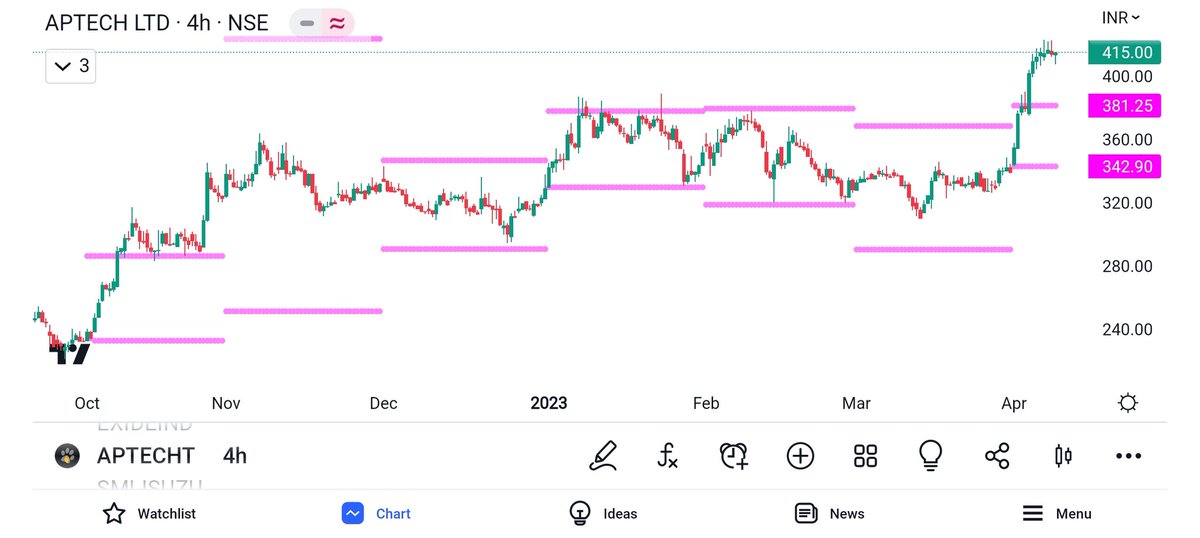
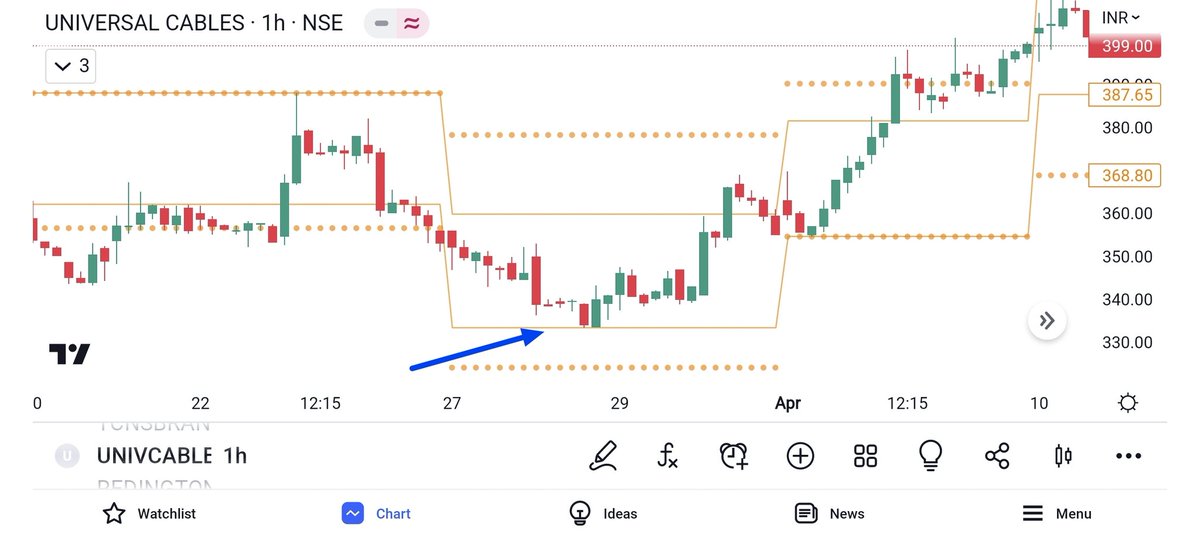
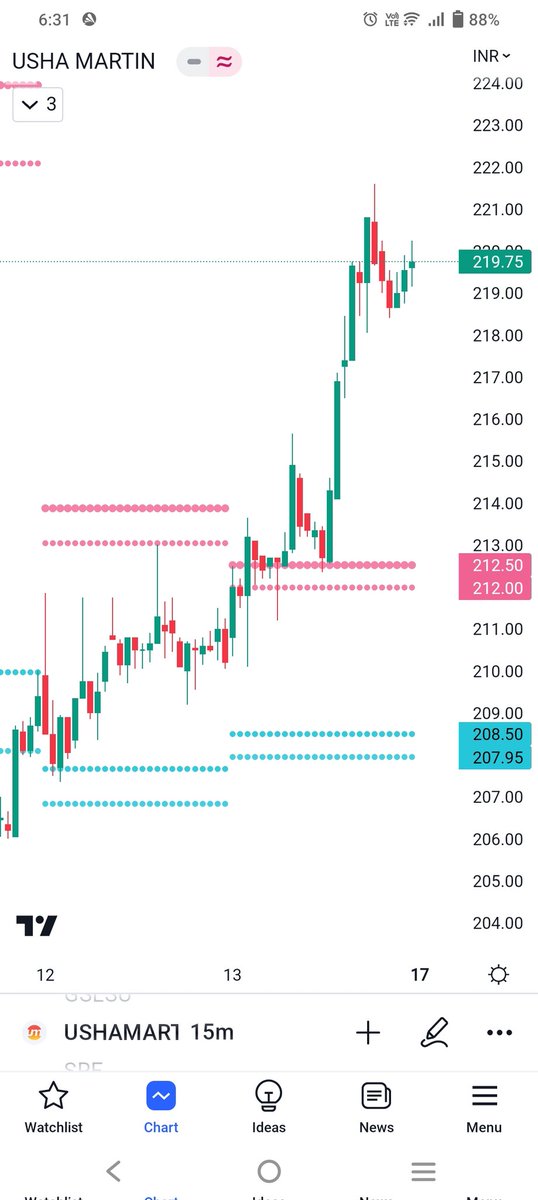
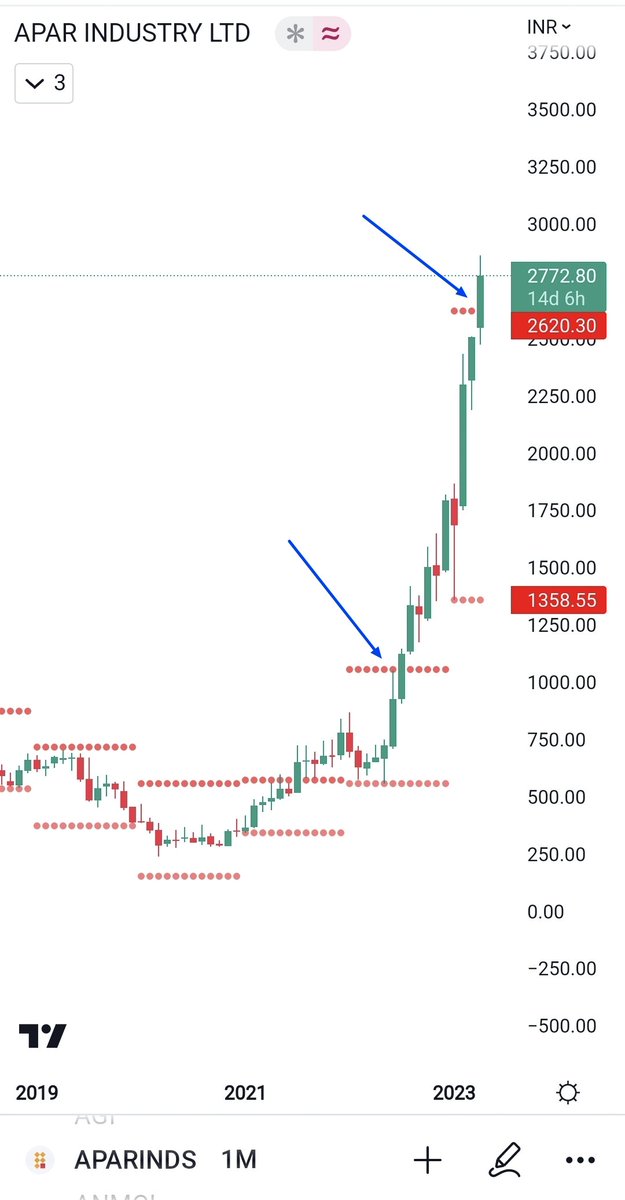
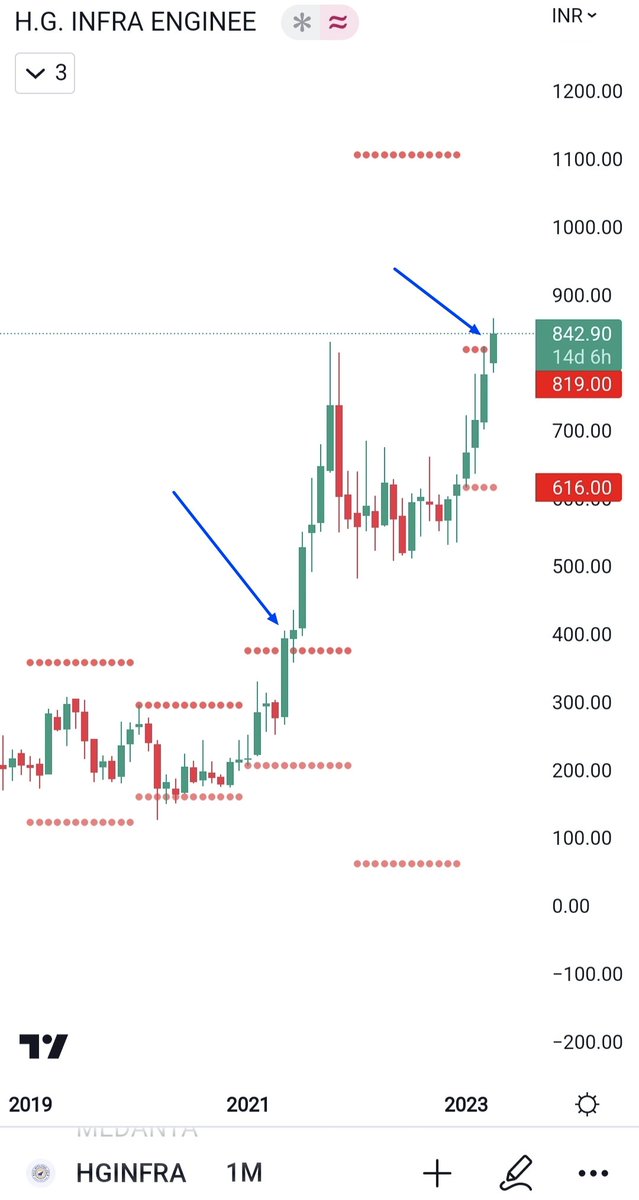
When will take entry?
✓ 1st , The candle taking support at Monthly/weekly ATR low level. Wait for one green candle confirmation. Taken entry once the high of the prv.candle crossed. SL Below ATR level.
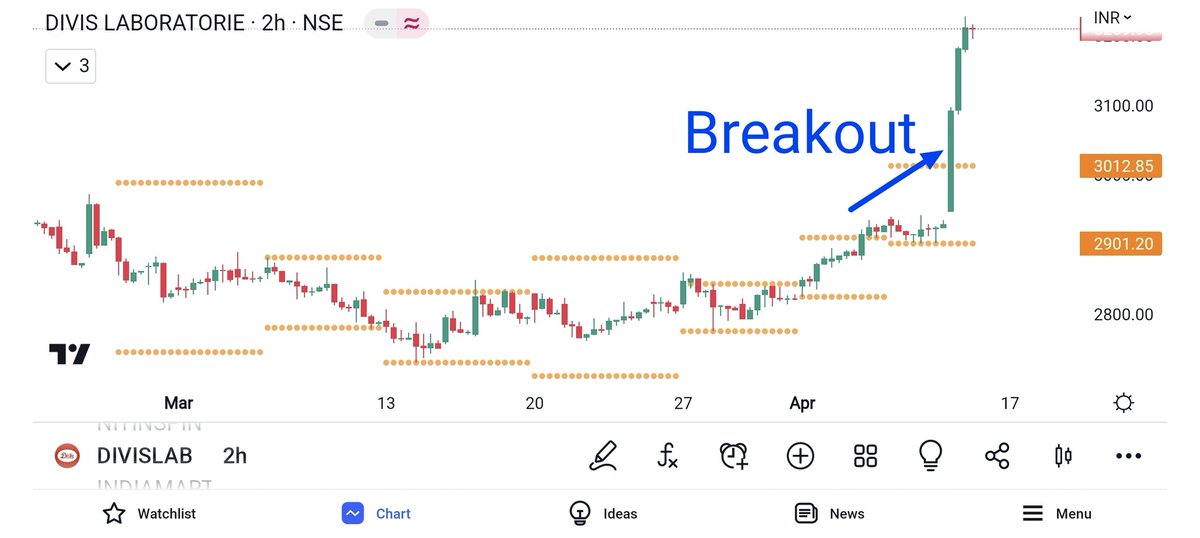
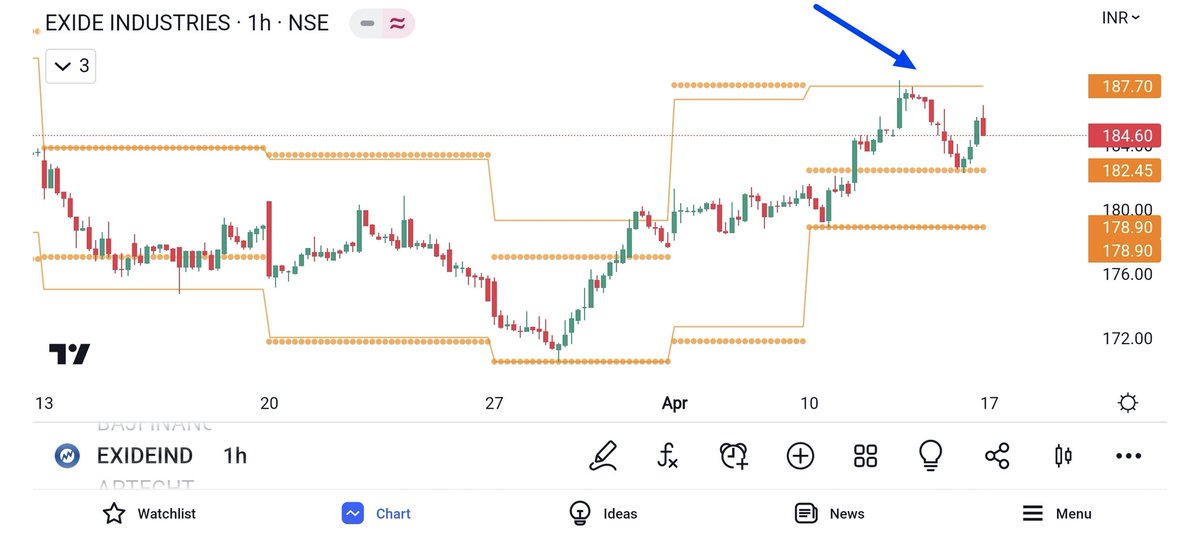
✓ 2nd, The candle breakout & Closed above monthly/weekly ATR high.
🧵 3)
✓ 1st , The candle taking support at Monthly/weekly ATR low level. Wait for one green candle confirmation. Taken entry once the high of the prv.candle crossed. SL Below ATR level.
✓ 2nd, The candle breakout & Closed above monthly/weekly ATR high.
🧵 3)
Time Frame :
Monthly ATR level HIGH B/O : Daily candle should breakout and retest.
Weekly ATR High B/O : 1 HR candle
Intraday : Take entry when crossing ATR levels and exit As soon as in the momentum.
(Chances of B/O failure and candle will close below ATR level).
🧵 4)
Monthly ATR level HIGH B/O : Daily candle should breakout and retest.
Weekly ATR High B/O : 1 HR candle
Intraday : Take entry when crossing ATR levels and exit As soon as in the momentum.
(Chances of B/O failure and candle will close below ATR level).
🧵 4)
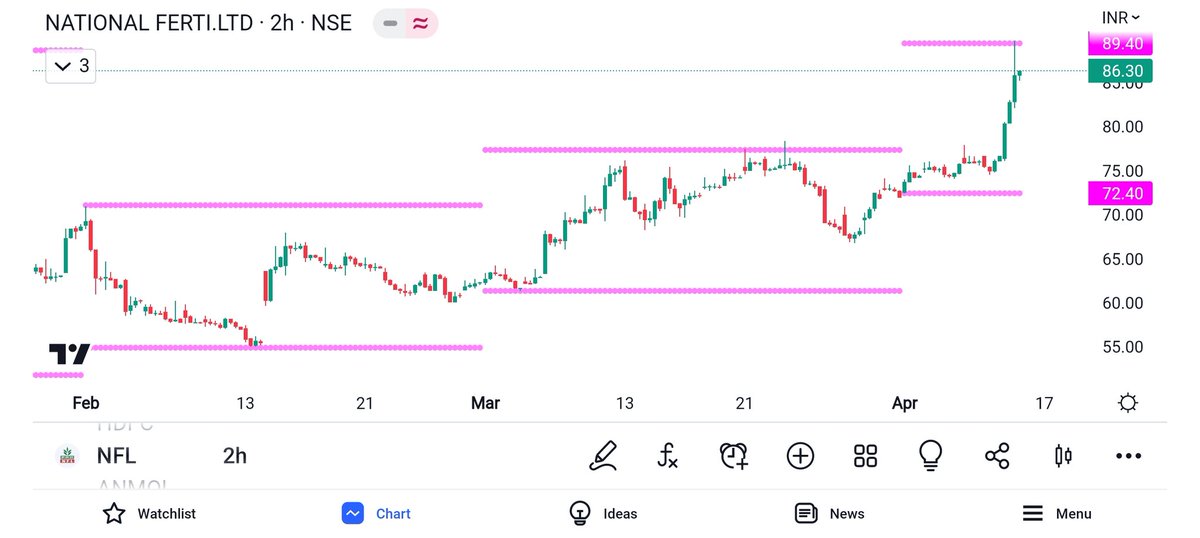
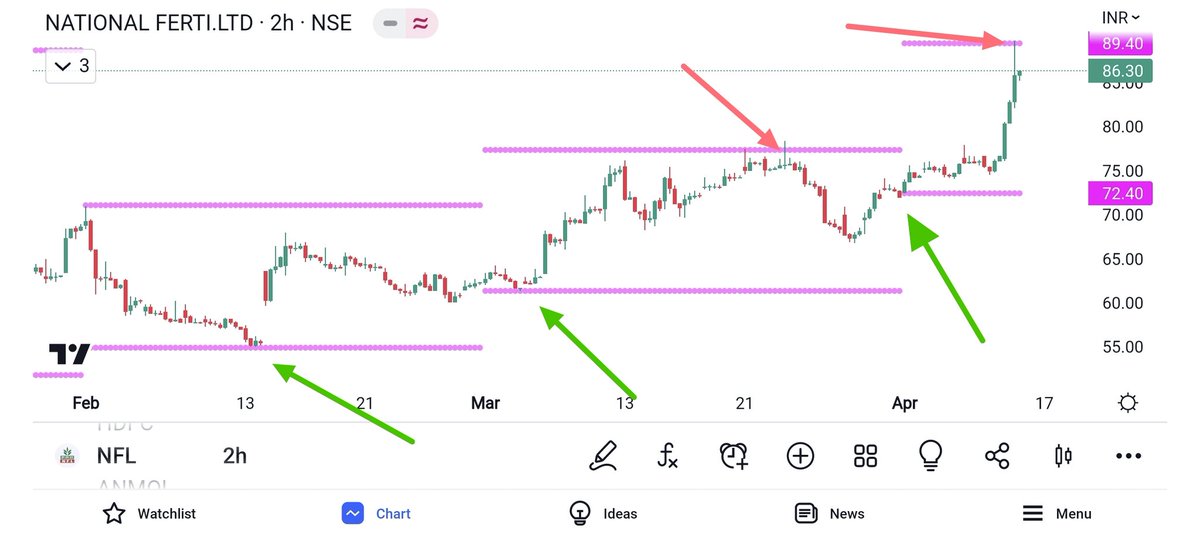
Exit From the trade:
Assume we bought near ATR Support, we will keep SL below ATR and target ATR High (weekly/monthly whichever will comes first).
Exit 50-75% quantities there. Remaining hold with TSL.
Simply Says, "Buy at support sell at High".
🧵 5).
Assume we bought near ATR Support, we will keep SL below ATR and target ATR High (weekly/monthly whichever will comes first).
Exit 50-75% quantities there. Remaining hold with TSL.
Simply Says, "Buy at support sell at High".
🧵 5).
Tips :
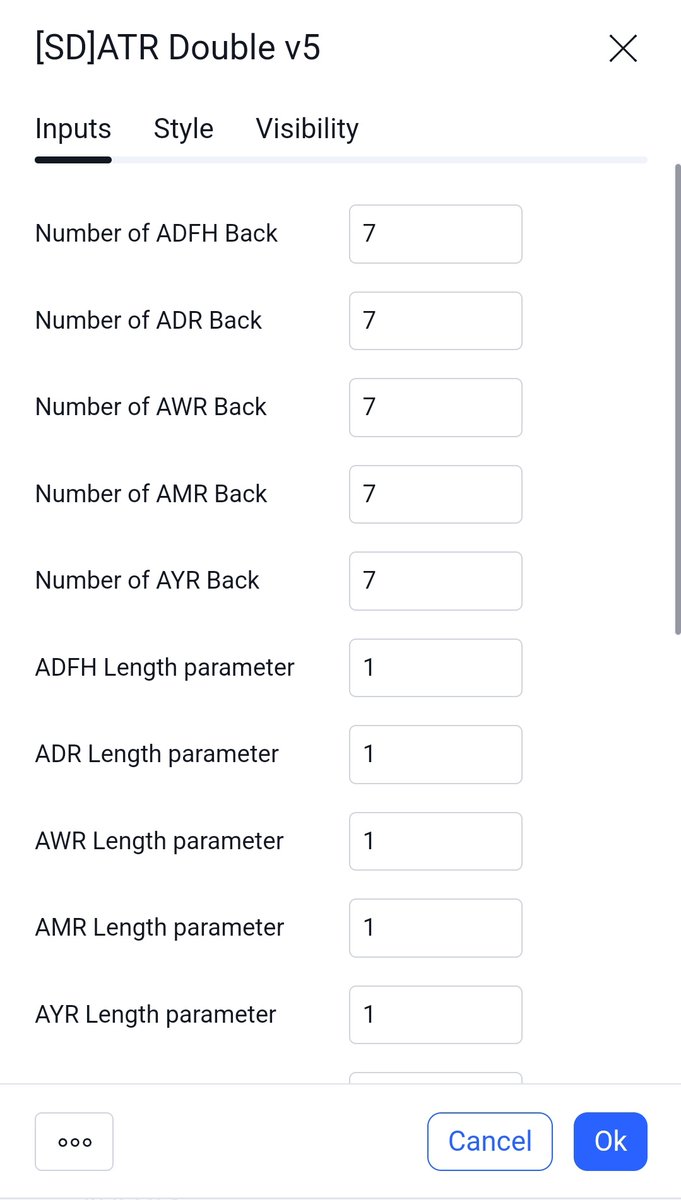
✓ ATR time period used 7 days & 24 days. We have all in one indicator.
Sometimes you may see the candle reverse before touching the ATR support. Bcoz there might be a support of another time period ATR level( 7 or 24)
We must consider that too.
🧵 6)
✓ ATR time period used 7 days & 24 days. We have all in one indicator.
Sometimes you may see the candle reverse before touching the ATR support. Bcoz there might be a support of another time period ATR level( 7 or 24)
We must consider that too.
🧵 6)
Tips :-
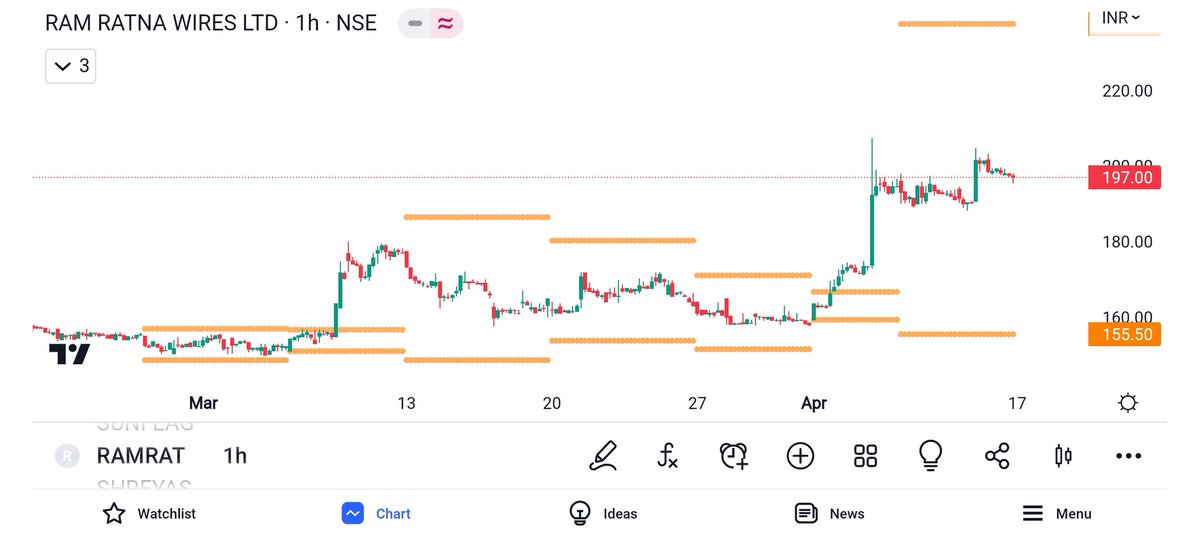
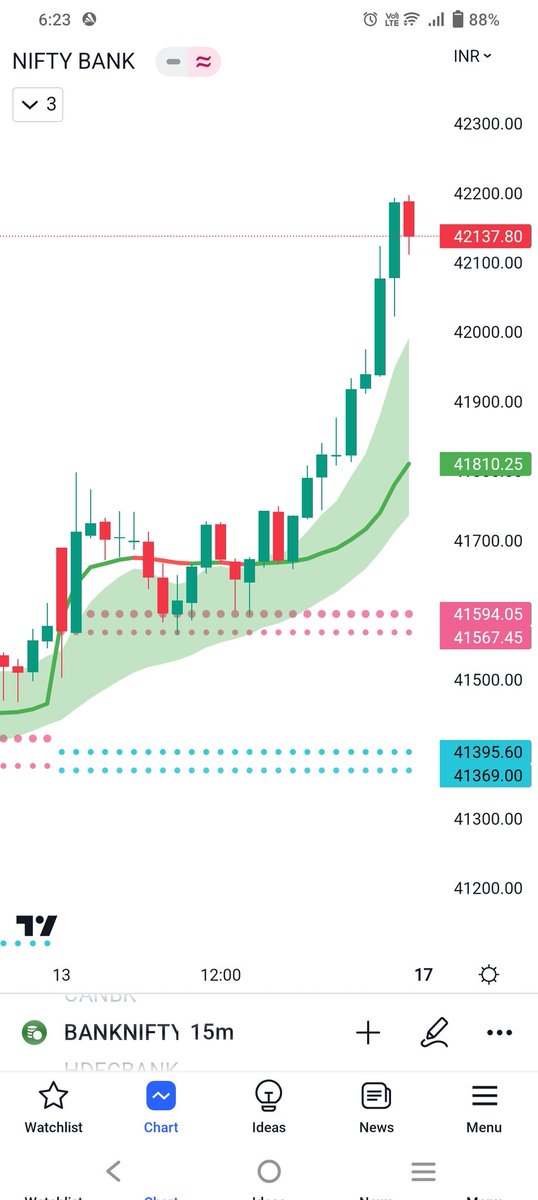
✓ If monthly or weekly ATR High and low levels formed in narrow range, that will be a trending week/month for that stock. Can expect big move for any side.
✓ If we get wider lines, mostly it will be a sideways signal. It can be used for option selling.
🧵 7).
✓ If monthly or weekly ATR High and low levels formed in narrow range, that will be a trending week/month for that stock. Can expect big move for any side.
✓ If we get wider lines, mostly it will be a sideways signal. It can be used for option selling.
🧵 7).
Let's see the indicator setup.
You can search & get the indication in tradingview ( Refer picture).
Initially use only
AWR high & low (weekly) &
AMR high &low (Monthly)
If you use all in same time, it will be confused 🤔. So use only these two. Later you can use all.
🧵 8)
You can search & get the indication in tradingview ( Refer picture).
Initially use only
AWR high & low (weekly) &
AMR high &low (Monthly)
If you use all in same time, it will be confused 🤔. So use only these two. Later you can use all.
🧵 8)
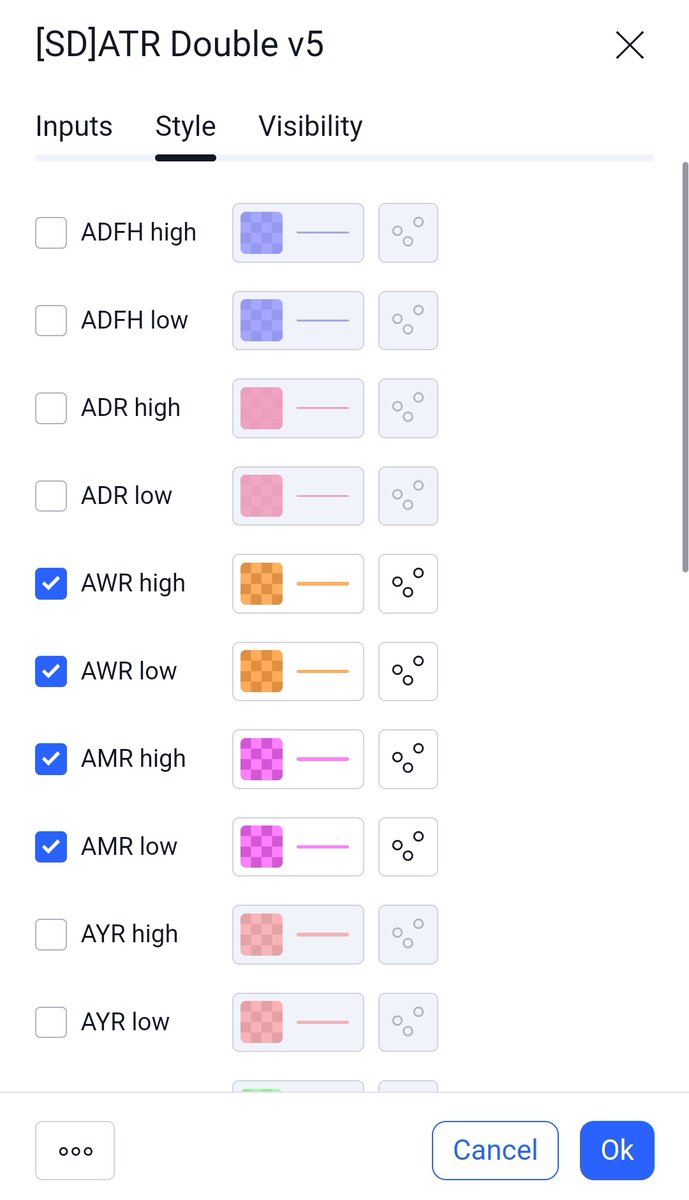
✓Don't change in input section. Keep default settings.
Use this indicator to identify the reversal zone and profit booking zone. It's working good.
ATR levels assist you for perfect execution.
Use this along with EMA, RSI or any favorite indicator.
🧵 9)
Use this indicator to identify the reversal zone and profit booking zone. It's working good.
ATR levels assist you for perfect execution.
Use this along with EMA, RSI or any favorite indicator.
🧵 9)
Conclusion:
Prepare good watchlist from currently trending stocks, and list out the stocks which is nearby ATR support levels and Breakout levels.
Excute as per condition discussed above.
@sandipm75224777 @senthil45372987
@Muxx12851167 @Santhoshcrbt
chartink.com
Prepare good watchlist from currently trending stocks, and list out the stocks which is nearby ATR support levels and Breakout levels.
Excute as per condition discussed above.
@sandipm75224777 @senthil45372987
@Muxx12851167 @Santhoshcrbt
chartink.com

@Vikrantaarya24 @Ki24557912 @trade4sniper @Sri2602360 @Jay07Prakash @RajeshK37492163 @vasavarg @IndianCitzzen79
If you feel, it's useful, share with some new comers in your circle
Good luck 🤞
If you feel, it's useful, share with some new comers in your circle
Good luck 🤞
Loading suggestions...