

Stop wasting time manually debugging your code when AI can do it.
Debug Like Never Before with the Power of AI.
Complete guide on how to do it:
Debug Like Never Before with the Power of AI.
Complete guide on how to do it:
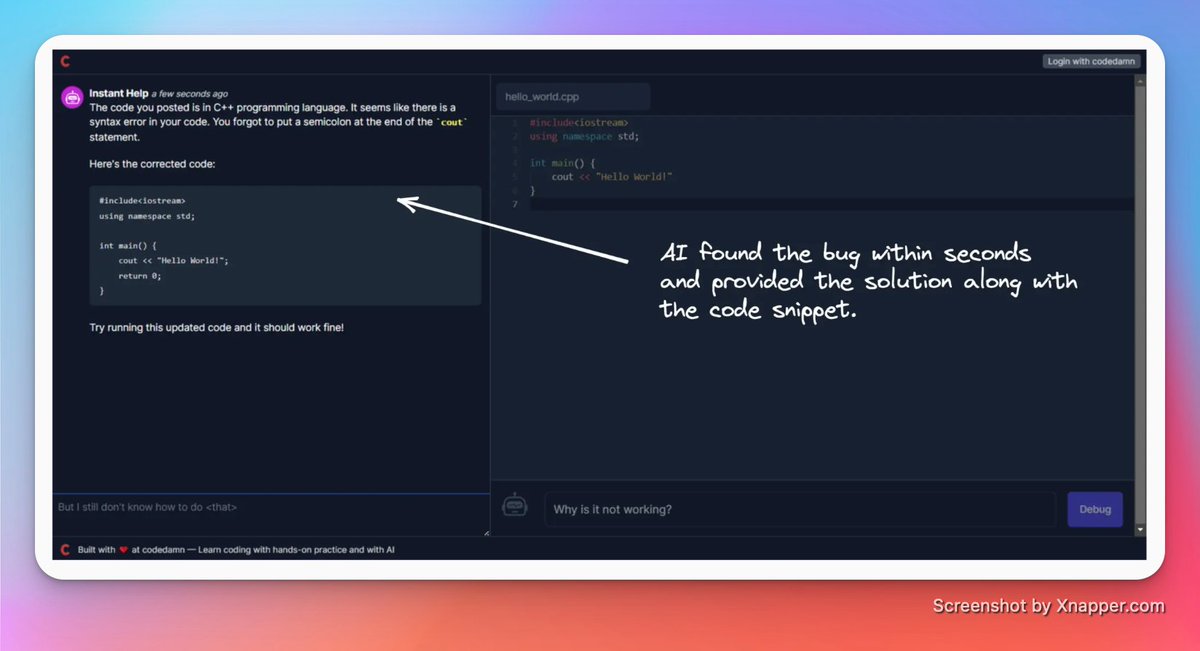
The user interface is pretty intuitive; you have two sections: on the right is a code editor where you write the code you want to debug, and on the left is a chat window where you can interact with your AI companion.

When you click the link, you will start a new session. The first step is to give the file a name. For instance, buggyCode.js in JavaScript or hello_world.cpp in C++.

Now that you’ve specified a filename, the code editor is active. It uses the same code editor as VS Code, so all of your VS Code shortcuts will work without any issues. You can type or paste the necessary code here.

There is an input box below the code editor where you can type your query.
When you press the “Debug” button next to it, your query and code will be shared with your AI companion.
When you press the “Debug” button next to it, your query and code will be shared with your AI companion.

The AI companion will thoroughly analyze your code and respond to your query.
It will give you a detailed explanation of the problem, as well as possible solutions and code snippets to resolve the issues.
It will give you a detailed explanation of the problem, as well as possible solutions and code snippets to resolve the issues.
Not satisfied with the response?
Don’t worry, you can ask it more questions using the chat panel on the left, and your AI companion will clear up any confusion.
Don’t worry, you can ask it more questions using the chat panel on the left, and your AI companion will clear up any confusion.

Pricing:
GPT-3.5 isn’t free, but debugcode.ai is! So, go ahead, throw in your broken code, get the bugs resolved within seconds, and enjoy the rest of your day.
GPT-3.5 isn’t free, but debugcode.ai is! So, go ahead, throw in your broken code, get the bugs resolved within seconds, and enjoy the rest of your day.

That's a wrap!
If you enjoyed this thread:
1. Follow us @codedamncom for more of these.
2. Retweet the first tweet above to share with your friends.
If you enjoyed this thread:
1. Follow us @codedamncom for more of these.
2. Retweet the first tweet above to share with your friends.
Loading suggestions...