

Market Breadth Indicator
How to use it to find tops and bottoms
And also to know when to trade and when to wait
This indicator can save you a lot of money if you understand how to use it
How to use it to find tops and bottoms
And also to know when to trade and when to wait
This indicator can save you a lot of money if you understand how to use it
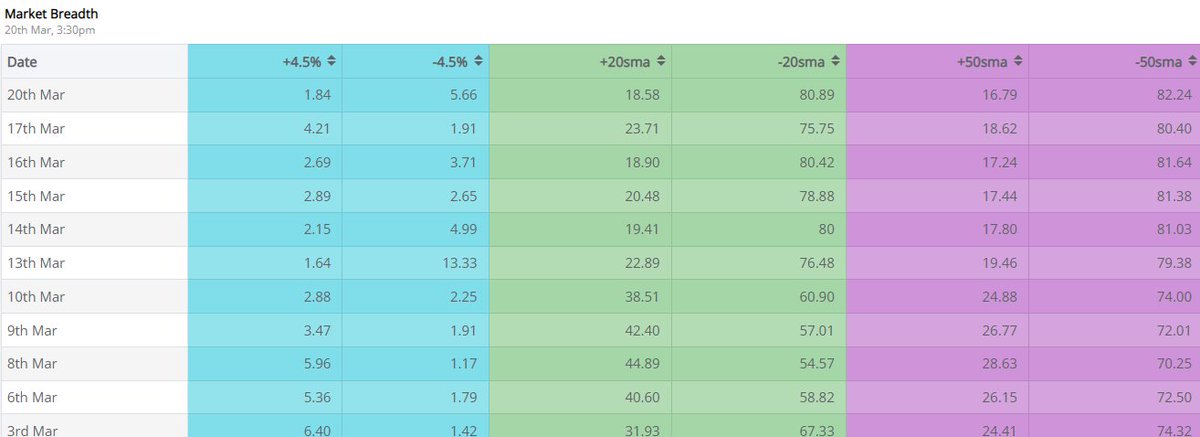
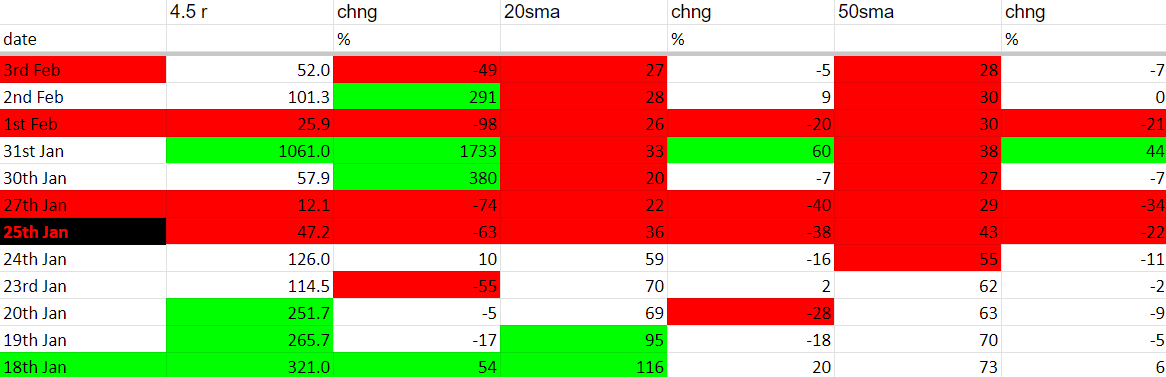
This is my basic market breadth indicator
+4.5 shows % of stocks up above 4.5%
-4.5 shows % of stocks down below 4.5%
+20/50sma shows % of stocks above 20/50 Day Simple Moving Average
-20/50sma shows % of stocks below 20/50 Day Simple Moving Average
+4.5 shows % of stocks up above 4.5%
-4.5 shows % of stocks down below 4.5%
+20/50sma shows % of stocks above 20/50 Day Simple Moving Average
-20/50sma shows % of stocks below 20/50 Day Simple Moving Average
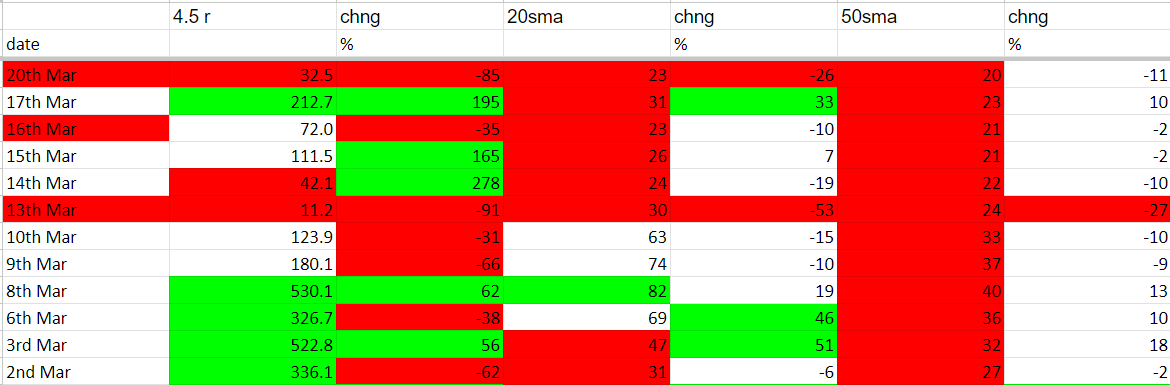
Now what I do is I make an excel of ratios
Eg : 4.5r(Column B) = (+4.5%/-4.5%)*100
And Column C indicates the change in ratio each day from the Previous Day
I have done the same thing for 20 and 50 sma columns and their % change
Eg : 4.5r(Column B) = (+4.5%/-4.5%)*100
And Column C indicates the change in ratio each day from the Previous Day
I have done the same thing for 20 and 50 sma columns and their % change
Now you have to look at extremely high or extremely low values in these columns
Extremely High means that the broader market is overbought and we may see a cool down
We can use this to do some profit booking and wait before making a new position
Extremely High means that the broader market is overbought and we may see a cool down
We can use this to do some profit booking and wait before making a new position
Extremely low means that the overall market is oversold
And the probability of a bounce/reversal is higher
Keep in mind that this is for the overall market and not Nifty or any index
And the probability of a bounce/reversal is higher
Keep in mind that this is for the overall market and not Nifty or any index
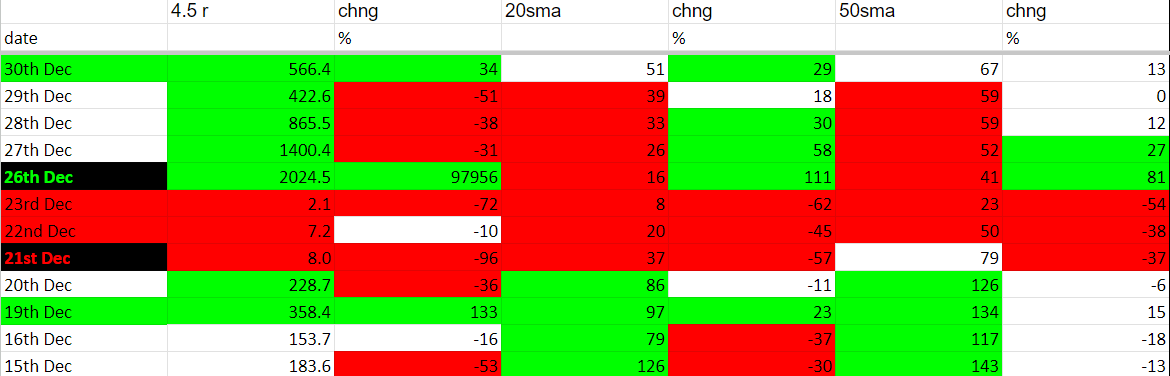
Eg : Look how oversold the market got from 20th dec to 23rd Dec and how we bounced on 26th
The 4.5r column should be used by ultra short-term momentum traders whose holding period is mostly less than a week
The 20sma column should be used by swing traders and 50 sma for positional trading
Keep in mind that 50sma is the slowest indicator
The 20sma column should be used by swing traders and 50 sma for positional trading
Keep in mind that 50sma is the slowest indicator
If the 4.5r is showing high values for more than 5 days then it is a caution signal that the market may cool down
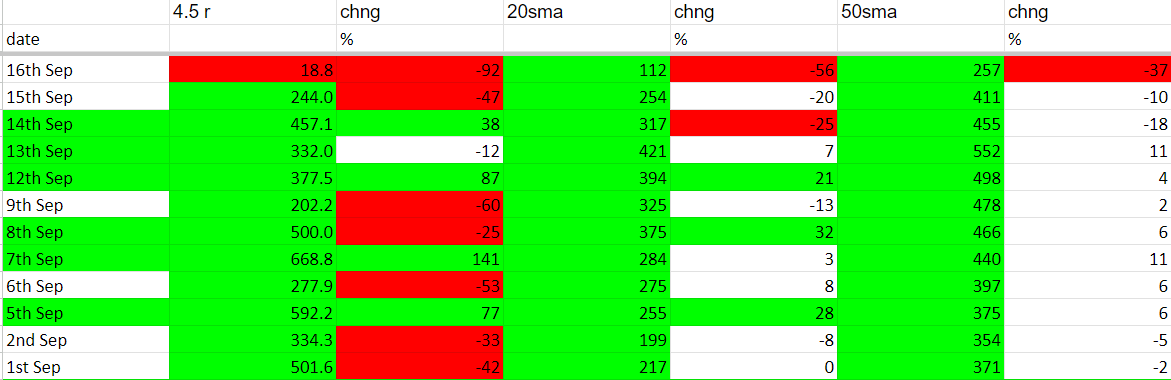
Keep in mind that if you have entered into a really oversold zone or a strong rally has started then the green can last longer as was the case in june to september22
Keep in mind that if you have entered into a really oversold zone or a strong rally has started then the green can last longer as was the case in june to september22
How I have colored the sheet
Colomn B : Abv200 Green, Blw50 Red
Colomn C : Abv20 Green, Blw-20 Red
Colomn D : Abv75 Green, Blw50 Red
Colomn E : Abv20 Green, Blw-20 Red
Colomn F : Abv85 Green, Blw60 Red
Colomn G : Abv20 Green, Blw-20 Red
Colomn B : Abv200 Green, Blw50 Red
Colomn C : Abv20 Green, Blw-20 Red
Colomn D : Abv75 Green, Blw50 Red
Colomn E : Abv20 Green, Blw-20 Red
Colomn F : Abv85 Green, Blw60 Red
Colomn G : Abv20 Green, Blw-20 Red
Column A :
Green if Net color of Green(Column B-G) - Net Colour of Red(Column B-G) is greater than equal to 3
Red if Net color of Green(Column B-G) - Net Colour of Red(Column B-G) is less than equal to -3
Eg : 20th March the net value color is -5 hence it is a red day
Green if Net color of Green(Column B-G) - Net Colour of Red(Column B-G) is greater than equal to 3
Red if Net color of Green(Column B-G) - Net Colour of Red(Column B-G) is less than equal to -3
Eg : 20th March the net value color is -5 hence it is a red day
Column A is the easiest and the best indicator of when breakout trading is working and when to wait before making new positions
If the last time we got a color day and it was green then you are good to trade breakouts and if it was red then don't trade
If the last time we got a color day and it was green then you are good to trade breakouts and if it was red then don't trade
The last time we got a green day was on 18th Jan
And from 25th Jan we have only got red days which is an indication that breakouts have a lesser probability of working
And from 25th Jan we have only got red days which is an indication that breakouts have a lesser probability of working
The red day green day signal will work best for most traders
The veterans and ultra short-term traders can use 4.5r column as long as they know when to book profits and cut losses as it is mainly used to play for momentum and momentum can go out anytime
The veterans and ultra short-term traders can use 4.5r column as long as they know when to book profits and cut losses as it is mainly used to play for momentum and momentum can go out anytime
You can also add columns like 20% up/down in 5 days, a month, or a certain percentage up move or down move in a quarter to understand the market breadth better as per your trading style
I find adding too much overcomplicates things hence I prefer this basic setup
I find adding too much overcomplicates things hence I prefer this basic setup
Loading suggestions...